Cold gas properties of the Herschel Reference Survey. III. Molecular gas stripping in cluster galaxies
Abstract
Context. The Herschel Reference Survey is a complete volume-limited, K-band-selected sample of nearby objects including Virgo cluster and isolated objects. Using a recent compilation of Hi and CO data for this sample we study the effects of the cluster environment on the molecular gas content of spiral galaxies. With the subsample of unperturbed field galaxies, we first identify the stellar mass as the scaling variable that traces the total molecular gas mass of galaxies better. We show that, on average, Hi-deficient galaxies are significantly offset (4 ) from the vs. relation for Hi-normal galaxies. We use the vs. scaling relation to define the H2-deficiency parameter as the difference, on logarithmic scale, between the expected and observed molecular gas mass for a galaxy of given stellar mass. The H2-deficiency parameter shows a weak and scattered relation with the Hi-deficiency parameter, here taken as a proxy for galaxy interactions with the surrounding cluster environment. We also show that, as for the atomic gas, the extent of the molecular disc decreases with increasing Hi-deficiency. All together, these results show that cluster galaxies have, on average, a lower molecular gas content than similar objects in the field. Our analysis indicates that ram pressure stripping is the physical process responsible for this molecular gas deficiency. The slope of the vs. relation is less than unity, while the vs. relation is steeper than the vs. relation, thereby indicating that the molecular gas is removed less efficiently than the atomic gas. This result can be understood if the atomic gas is distributed on a relatively flat disc that is more extended than the stellar disc. It is thus less anchored to the gravitational potential well of the galaxy than the molecular gas phase, which is distributed on an exponential disc with a scalelength . There is a clear trend between the colour index, which is a proxy for the specific star formation activity, and the H2-deficiency parameter, which suggests that molecular gas removal quenches the activity of star formation. This causes galaxies migrate from the blue cloud to the green valley and, eventually, to the red sequence. The total gas-consumption timescale of gas deficient cluster galaxies is comparable to that of isolated, unperturbed systems. The total gas depletion timescale determined by considering the recycled fraction is 3.0-3.3 Gyr, which is significantly larger than the typical timescale for total gas removal in a ram pressure stripping process, indicated by recent hydrodynamical simulations to be 1.5 Gyr. The comparison of these timescales suggests that ram pressure, rather than a simple stop of the infall of pristine gas from the halo, will be the dominant process driving the future evolution of these cluster galaxies.
Aims.
Methods.
Results.
Key Words.:
Galaxies: clusters: general; Galaxies: clusters: individual: Virgo; Galaxies: interactions; Galaxies: ISM; Galaxies: spiral; Galaxies: star formation;1 Introduction
The molecular gas phase plays a fundamental role in the process of star formation in galaxies. The atomic gas, which is dominant in normal, field late-type galaxies, collapses within molecular clouds to form new stars. This simple matter cycle can be significantly perturbed in dense environments (e.g. Boselli 2011). The atomic gas phase, which in normal, unperturbed galaxies extends up to 1.8 times the stellar disc (Cayatte et al. 1994; Bigiel & Blitz 2012), can be easily removed during the interaction of galaxies with the surrounding environment (Boselli & Gavazzi 2006). Since the seminal work of Haynes & Giovanelli (1984), there has indeed been strong observational evidence that late-type cluster galaxies have less atomic gas than similar objects in the field (e.g. Cayatte et al. 1990; Solanes et al. 2001; Gavazzi et al. 2005). Tidal interactions with nearby companions or with the cluster gravitational potential well (galaxy harassment, Moore et al. 1998), the dynamical interaction between the hot intracluster medium (ICM) with the cold interstellar medium (ISM) of galaxies moving at high velocity ( 1000 km s-1) within clusters (ram pressure stripping, Gunn & Gott 1972; thermal evaporation, Cowie & Songaila 1977) can remove the gaseous component.
The lack of gas naturally quenches star formation, thereby transforming active systems in
quiescent objects (e.g. Boselli & Gavazzi 2006). The timescales relative to this transforming process, and the structural, physical and kinematical properties of the perturbed galaxies drastically change according to the perturbing process.
Gravitational interactions indistinctly perturb all galaxy components (dark matter, stars, gas, dust, etc.) thereby producing strong signatures in the morphological and kinematical
structure of the perturbed objects. To be efficient in fully transforming the whole late-type galaxy population falling into rich clusters, however,
they require very long timescales since multiple encounters are necessary. Indeed, given the high-velocity dispersion within clusters ( 1000 km s-1), the perturbative phase
during a fly-by encounter is too short to induce strong effects (Boselli & Gavazzi 2006). The dynamical interactions with the hot, dense ICM and, in particular, the
ram pressure stripping phenomenon, has been identified as the dominant process perturbing late-type galaxies in nearby rich clusters (e.g. Vollmer et al. 2001; Boselli & Gavazzi 2006; Tonnesen et
al. 2007). Observations, models and simulations all indicate that the atomic gas phase can be easily perturbed
on relatively short timescales ( 100-200 Myr; Vollmer et al. 2004; Roediger et al. 2005; Boselli et al. 2006; 2008a, 2008b; Crowl & Kenney 2008).
The effects on the molecular gas phase are still under study. Modelling the effects of ram pressure on a multiphase gas disc is still challenging
since it requires taking several physical effects into account, such as heating and cooling of the ISM, self-gravity, star formation,
stellar feedback, and magnetic field. Given the fractal distribution of the gaseous component within the ISM, models must also simultaneously predict
the gas distribution on different scales, from giant molecular clouds to the tails whose size can exceed the size of galaxies (Roediger 2009). Recent attempts to simulate
the effects of ram pressure on a multiphase ISM on different scales have been carried out by Tonnesen & Bryan (2009). These authors have shown that the molecular gas phase,
even in high-density regions, can be removed during the interaction. Whereas detailed multifrequency observations of representative objects
in nearby clusters begin to show cases of ongoing molecular gas ram pressure stripping events (Vollmer et al. 2008a, 2009, 2012a; Sivanandam et al. 2010),
strong and convincing statistical evidence is still lacking.
Since star formation occurs mainly inside molecular clouds, the perturbation of the molecular gas phase in any kind of interaction can have a strong impact on the evolution of the stellar populations
of galaxies. It is thus paramount to understand whether the molecular hydrogen is perturbed or not and removed in high-density environments.
The first studies of the molecular gas content of cluster galaxies and the search for any possible evidence of molecular gas stripping come from Kenney & Young (1989) for the Virgo cluster and from Casoli et al. (1991) for the Coma cluster. Kenney & Young (1988; 1989) discovered low-luminosity Virgo cluster spirals characterised by weak CO emission lines, which they interpreted as the first proof of a low molecular hydrogen content in this cluster. Casoli et al. (1991), on the other hand, observed normal molecular gas content in a few spiral galaxies in the Coma cluster and deduced that the cluster environment is not able to remove the molecular phase, which is strongly anchored to the deep gravitational potential well of galaxies. These results were later questioned by Boselli et al. (1997) as due to strong biases. Boselli et al. (1997) have shown how the low CO emission of the low-luminosity Virgo cluster galaxies discovered by Kenney & Young (1988) was not evidence of the lack of H2, but rather an effect related to the decrease in the conversion factor in low-luminosity, metal-poor objects with respect to massive, metal-rich galaxies. Indeed, in these low-metallicity systems the interstellar radiation field is able to dissociate the molecular gas in the diffuse medium, where is low, thus increasing the mean factor of these galaxies with respect to massive objects (Boselli et al. 1995, 1997, 2002). The result of Casoli et al. (1991) has also been criticised because the observed Coma cluster galaxies were selected in the far-infrared. Given the tight correlation between the far-infrared and the CO emission, this selection criterion might have excluded molecular gas poor objects from the observed sample (Boselli et al. 1997, 2002). Other CO surveys of nearby clusters have been published in Lavezzi & Dickey (1998) and in Scott et al. (2013). Using a collection of CO data taken from the literature for a large sample of nearby galaxies, Jablonka et al. (2013) have recently shown that, on average, cluster galaxies have a lower CO luminosity per unit far-infrared luminosity than field objects. They interpreted this result as an evidence of molecular gas stripping in high-density environments. This result, however, is based on a heterogeneous sample of isolated and cluster galaxies often selected according to different criteria and thus might be biased by subtile and complex selection effects (e.g. Boselli et al. 1997; 2013c). The lack of cluster and field samples selected according to similar criteria prevented previous works from deriving any firm conclusion on this topic. In recent years, several efforts have been undertaken to construct a sample of isolated, unperturbed galaxies with molecular gas data that are ideally defined to be used as references for any statistical study. Sauty et al. (2003) made systematic CO observations of galaxies in the catalogue of isolated objects constructed by Karachentseva (1973). Observations of these isolated objects were later extended by Lisenfeld et al. (2011). However, these new datasets have not yet been used to quantify the molecular gas content of nearby cluster galaxies.
In the preparation of the Herschel mission (Pilbratt et al. 2010) we began a SPIRE guaranteed time key project aimed at studying the properties of the ISM of a K-band-selected, volume-limited sample of 322 nearby galaxies. This project, named the Herschel Reference Survey (HRS), has been extensively described in Boselli et al. (2010). To provide the community with the largest possible set of multifrequency data necessary for any kind of statistical analysis, we have collected data at all wavelengths, from UV (Boselli et al. 2011; Cortese et al. 2012a) to radio centimetric, including H narrow-band imaging (Boselli et al. in prep.), integrated optical spectroscopy (Boselli et al. 2013a), PACS (Cortese et al. 2014) and SPIRE photometry (Ciesla et al. 2012). For such purpose, we have recently obtained new CO data for a large fraction of the late-type galaxies of the HRS. We combined these data with those available in the literature and produced a homogenised catalogue of 12CO(1-0) data for 225 galaxies of the HRS sample. We also collected from the literature and homogenised Hi data for 315 out of the 322 HRS galaxies (256/260 for spirals; Boselli et al. 2013b, Paper I). The quality of the data at hand, the accurate estimate of the total CO flux emission and of their uncertainties, and the presence of a well defined, complete sample including cluster and isolated galaxies selected according to similar criteria, all allow us to extend and revisit the critical topic of the effects of the environment on the molecular gas properties of cluster galaxies on the best statistically significant sample with CO data available in the literature. The study of the effects of the environment on the atomic gas content of cluster galaxies has been presented in Cortese et al. (2011), the one on the dust mass in Cortese et al. (2010, 2012). In an accompanying paper (Boselli et al. 2013c; paper II of this series), we study the molecular and total gas scaling relations of the HRS.
2 The sample
The analysis presented in this work is based on the spiral galaxies of the Herschel Reference Survey,
a K-band-selected (K 12 mag), volume-limited (15 25 Mpc) sample of nearby objects
spanning a wide range in morphological type (from Sa to Sd-Im-BCD) and stellar mass (109 3 1011 M⊙
for those galaxies of the sample with available molecular gas data). The K-band selection was chosen as proxy for stellar mass (Gavazzi et al. 1996).
The sample, which is extensively described in Boselli et al. (2010), is perfectly suited for environmental studies since it includes
galaxies in high-density regions such as those located in the core of the Virgo cluster and fairly isolated objects in the field. The local galaxy density
of the sample, defined as in Tully (1988) as the number of galaxies brighter than = -16 per Mpc3,
ranges from 4 gal Mpc-3 in the core of the Virgo cluster to 0.2 gal Mpc-3 in the field (Tully 1988). The cluster
environment is also characterised by a diffuse, hot intergalactic medium ( 107 K) whose density reaches 2 10-3 atoms cm-3
(Böhringer, private comm.) and a velocity dispersion of the order of 1000 km s-1 (Boselli & Gavazzi 2006).
The analysis done in this work is based on the subsample of spiral galaxies (type Sa) with available CO data (168 objects). As extensively described in the next section,
we use the Hi-deficiency parameter to quantify the degree of perturbation induced by the cluster environment on the atomic gas component of our sample.
Sixty % of the analysed galaxies have 0.4 and can thus be considered as unperturbed objects. Indeed, out of these 101 galaxies, 93 are located outside Virgo cluster A, the X-ray dominated region surrounding M87, and B, close to M49, where the perturbations are known to be dominant. The remaining 40 % have a significant lower atomic gas content than objects of similar size and morphological type in the field. These are galaxies preferentially located within Virgo cluster A and B (33/67), in the outskirts of Virgo, or in the other substructures of the cluster (W, W1, M, East and North clouds, Southern extension) (19/67), where the perturbations are known to be milder (Gavazzi et al. 1999), with a few objects in close pairs or multiple systems (9/67). Seventeen out of the 168 spirals have molecular gas masses estimated from accurate CO mapping done by Kuno et al. (2007) (see Table 1). The analysis presented in paper I has shown that the uncertainty on the total CO flux of these galaxies is 12 %, thus significantly smaller than the typical uncertainty on the CO flux of the rest of the sample ( 44 %) determined by applying aperture corrections. Since the present analysis is devoted to the study of second order effects (is the dispersion in the scaling relations controlled by the environment?), the use of high-quality data is of paramount importance. We will thus consider in the following analysis the subsample of HRS galaxies observed by Kuno et al. (2007) as a high-quality sample, and see whether the relations traced by the whole HRS on a large statistical basis are also shared by this subsample of high-quality data. Table 1 shows that the subsample of HRS galaxies observed by Kuno is well suited for this purpose since it includes eight unperturbed objects ( 0.4) and nine gas-poor galaxies, seven of which located within Virgo A. The analysis presented in this work has also shown a significant lack of CO data for Hi-deficient low-mass objects. This lack of data might introduce systematic effects in the comparison of the statistical properties in the molecular gas content of cluster and field objects. Whenever necessary, we thus consider separately the whole sample of galaxies and the subsample of massive objects ( 1010 M⊙) complete in CO data to test the robustness of our conclusions.
3 The data
The data used for the following analysis have been collected from the literature or from our own observations and homogenised to provide complete catalogues useful for any kind of statistical analysis. Molecular hydrogen masses have been derived from 12CO(1-0) data available for 168 out of the 260 spiral galaxies of the sample (143 detections). CO data of 59 out of these 168 objects come from our own observations done at the 12 metre Kitt Peak radiotelescope, presented in paper I. CO fluxes are converted into molecular gas masses assuming either a constant, Galactic conversion factor of = 2.3 1020 cm-2/(K km s-1) (Strong et al. 1988), or the H-band luminosity-dependent conversion factor of Boselli et al. (2002), log = -0.38 log ()+ 24.23 (cm-2/(K km s-1).
Complete CO mapping, available for the brightest 37 objects (22%) and single beam observations have been corrected for aperture effects and homogenised as described in Boselli et al. (2013b; paper I). The estimated error on the total, extrapolated CO flux ranges from 12% for the integrated values given in Kuno et al. (2007) (17 galaxies) to 44% in those objects where the total flux has been determined from single beam observations reaching 120% when the surface of the galaxy covered by the beam of the telescope is 10% of the total optical surface. Despite the accurate aperture correction, a possible systematic bias can affect the total molecular gas determiation of the perturbed galaxies. Indeed, if this extrapolation is very accurate in isolated, unperturbed galaxies such as those used to define the H2-deficiency parameter (Boselli et al. 2013b), this might not be the case in perturbed cluster objects. The molecular gas distribution of these cluster galaxies might be truncated because of their interaction with the cluster environment. Furthermore, in these objects the scalelength of the CO emitting disc is not necessarily extended as in unperturbed systems, as is indeed the case for the atomic component. Variations of the molecular radial profile of Hi-deficient galaxies has been indeed observed by Fumagalli et al. (2009). More recently, Davies et al. (2013) have shown that also the molecular gas disc of the few CO detected early-type galaxies within the Virgo cluster is less extended than that of similar objects in the field. The Hi gas profile is significantly truncated and the mean gas column density reduced in the most deficient cluster galaxies as indicated by interferometric observations (Cayatte et al. 1994). NGC 4569, an anemic, gas deficient galaxy ( = 1.05) close to the core of the cluster, has a reduced molecular gas column density and a profile truncated at the same level than the Hi and the star forming disc (Boselli et al. 2006).
The extrapolated CO flux of Hi-deficient galaxies with single beam observations measured using the prescription
given in paper I might thus be overestimated, and as a consequence the H2-deficiency parameter underestimated. To quantify this effect, we have extrapolated the observed CO radial profile of NGC 4569
of Kuno et al. (2007) and compared the integrated CO flux to that determined by limiting the aperture up to the truncation radius. The difference between the extrapolated and the aperture limited flux is
less than a few percent. We have also tried to correct for aperture effects single beam observations of the HRS galaxies integrating the CO exponential radial profile
to the isophotal FUV radii given in Cortese et al. (2012a) rather than to infinity.
Indeed at these short wavelengths sensitive to the youngest stellar populations isophotal diameters follow the truncation of the atomic gas disc (Cortese et al. 2012a). Again,
the difference in the CO integrated profiles using -band (as done in paper I) or FUV isophotal radii is less than a few percent. This test, however, can only be taken as indicative since we
are forced to assume that the scalelength of the CO disc is unchanged between unperturbed and perturbed objects: .
These tests suggest that any possible systematic bias in the determination of the total CO
emission of perturbed galaxies with single beam observations should be minor. This evidence is explained by the fact that in normal galaxies the CO radial profile is very steep.
To have a significant impact on the determination of the total CO emission
using the prescription given in paper I, the truncation of the molecular gas disc must occur in the inner region. Multifrequency observations combined with
stripping models of interacting galaxies indicate that this can happens only in dwarf systems (Boselli et al. 2008a).
Atomic gas data are available for 256/260 of the spiral galaxies of the sample, and for 100% of those objects with available CO data.
The atomic gas data are used to estimate the
degree of perturbation induced by the cluster environment on late-type galaxies. This is done through the determination of the Hi-deficiency parameter ,
defined as the difference in logarithmic scale between the expected and the observed
Hi mass of a galaxy of given angular size and morphological type (Haynes & Giovanelli 1984). The Hi-deficiency for all the HRS galaxies
is determined using the recent calibration of Boselli & Gavazzi (2009). Atomic and molecular gas data are also used to derive the total cold gas content of the target
galaxies. This is done accounting for 30% of helium.
Optical radii, determined at the 24.5 mag arcsec-2 -band isophote, and stellar masses are taken from Cortese et al. (2012a). The latter have been determined
through -band luminosities with the colour-dependent stellar mass-to-light ratio relation from Zibetti et al. (2009), and assuming a Chabrier (2003) initial
mass function.
Star formation rates are determined using UV GALEX data (from Boselli et al. 2011, Cortese et al. 2012a), corrected for dust attenuation using 22 m
WISE data (from Ciesla et al. 2014) following the prescription of Hao et al. (2011). This calibration has been originally defined for
the Spitzer MIPS 24 m band, but given the similarity of the flux densities in the two adjacent bands (WISE 22 m and MIPS 24 m),
it can be adopted without any correction. UV corrected luminosities are transformed into star formation rates
(in M⊙ yr-1) using the standard calibrations of Kennicutt (1998), as described in Boselli et al. (2009). These star formation rates are consistent with those
determined using narrow band H imaging data corrected for [NII] contamination and dust attenuation with the Balmer decrement using integrated spectroscopy
(Boselli et al. 2013a): the mean ratio for the HRS galaxies is log=0.040.28.
Molecular and total gas masses, combined with star formation rates, are used to estimate the total and molecular gas depletion times, or equivalently total and
molecular star formation efficiencies (Young et al. 1996; Boselli et al. 2001; 2002). The definition and the determination of all these variables is extensively
described in paper II.
4 The molecular gas content of cluster galaxies
4.1 Calibration of the H2-deficiency parameter
The definition of a gas-deficiency parameter was first introduced by Haynes & Giovanelli (1984). The idea beyond this definition is that
of quantifying the amount of gas removed from galaxies during their interaction with the surrounding medium (Boselli & Gavazzi 2006).
Using a large sample of isolated galaxies, Haynes & Giovanelli (1984) determined standard scaling relations between the total Hi content and different characteristic
variables representative of the size of galaxies.
Among these, they identified the relation between the total Hi mass and the optical diameters as the one with the smallest scatter (0.3 dex).
This relation can be used to estimate the total mass of Hi gas that a galaxy belonging to different environments of a given size should have,
and compare it to the observed value. The difference between the expected and the observed value, in logarithmic scale, is the Hi-deficiency parameter.
The large sample of isolated galaxies in their hand allowed them to define different calibrations for galaxies of different morphological type.
Consistent with what done in our previous works on the molecular gas properties of cluster galaxies (Boselli et al. 1997, 2002), we use the present set of molecular gas data to define and calibrate a recipe for measuring the molecular gas deficiency of the HRS spiral galaxies. We first need to identify the unperturbed objects of the sample to be taken as reference for the determination of the calibrating scaling relations. The atomic gas component generally extends out to 1.8 times the optical disc and is thus poorly anchored to the gravitational potential well. It is thus the galaxy component most easily perturbed in any kind of interaction (Boselli & Gavazzi 2006). For this reason we identify the unperturbed objects of the sample using the Hi-deficiency parameter ( 0.4). This threshold in the Hi-deficiency parameter is chosen because is very close to the typical dispersion in the distribution of observed in isolated galaxies ( 0.3; Haynes & Giovanelli 1984).
To identify the scaling variable that minimises the scatter in the molecular gas mass vs. size/luminosity/mass relations, we plot in Fig. 1 and Fig. 2 the relationship between the molecular gas mass and the -band optical disc surface (defined as ) and the stellar mass, respectively. Both figures have two panels, the left one where is determined using a constant conversion factor, the right one with a variable . As expected, the two variables are tightly correlated just because bigger galaxies have larger radii and more gas content than smaller systems. The linear best fit to the data for Hi-rich spiral galaxies ( 0.4; direct fit)
| (1) |
gives the coefficients and listed in Table 2. The mean values in different bins of optical disc surface and stellar mass, indicated by blue large filled dots in both figures, are listed in Table 3. Both fits and mean values are determined including CO non-detections at their upper limits. We choose to consider CO non-detections as detections because we want to avoid introducing any systematic bias in the determination of the best fit. The inclusion of upper limits as detections is justified by the fact that, because of the sample definition, all galaxies are at the same distance (15-25 Mpc). Since the CO surveys from which most of the data have been collected, and in particular our own which is the deepest among all, are limited to a given sensitivity (see paper I), the upper limits naturally follow in the low stellar and molecular gas mass range (lower left corner in Figs 1 and 2), and are mainly located below the fitted relations. The exclusion of these data from the fit might thus artificially flatten the fitted scaling relation, thereby introducing a systematic bias in the results. Furthermore, if the cluster environment is responsible for gas removal, we would expect that, for a given sensitivity, the number of undetected objects increases in high-density regions. A fair comparison of the statistical properties of cluster and field objects must thus consider non-detections.
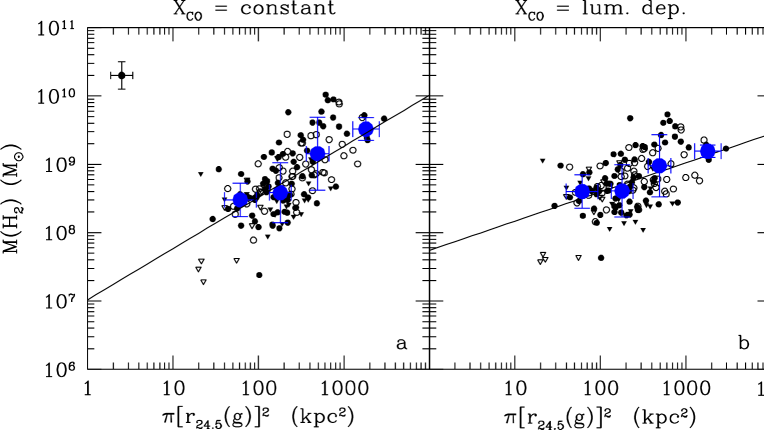
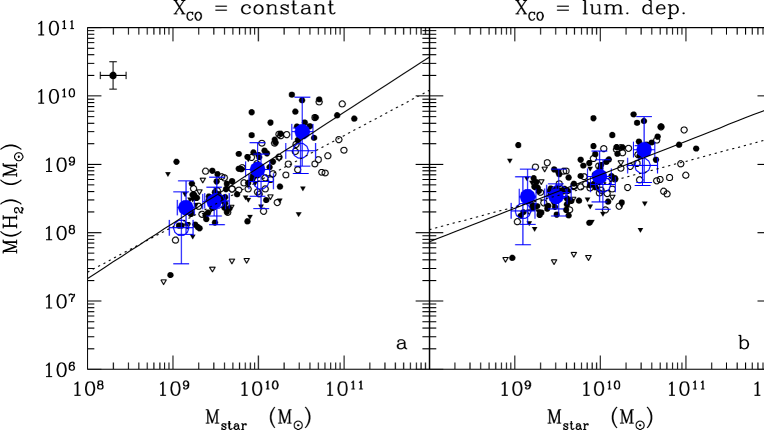
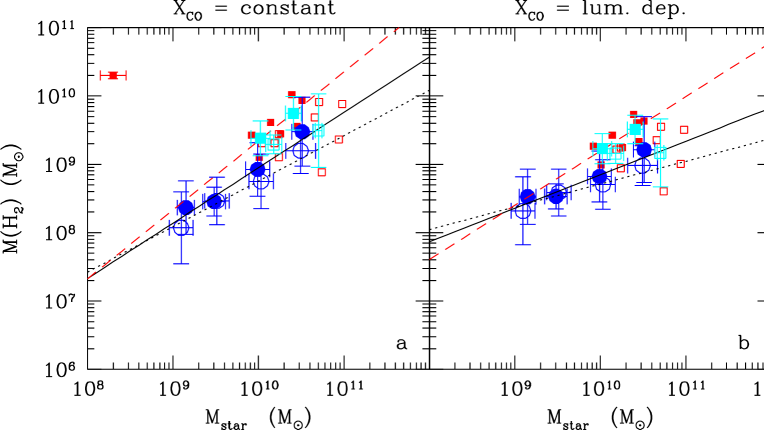
Fig. 1, 2, and Table 2 all indicate that the physical parameter which minimises the dispersion in these two scaling relations is the total stellar mass. The dispersion in the various relations with stellar mass are indeed a factor of 1.3 smaller than in those done using the optical area. This result only is in apparent contradiction with the work of Haynes & Giovanelli (1984), who identified the optical diameter as the best tracer for the atomic gas. Indeed the atomic gas has a much more extended distribution than the molecular phase, which has a steep radial gradient. It is thus not surprising that the Hi content is more correlated to the outer extension of the stellar disc traced by the optical radius, while the molecular gas located in the inner regions by the potential well of the galaxy, traced by the total stellar mass. There is also another possible reason explaining the smaller dispersion in the vs. with respect to the vs. relation: the stellar mass is determined from integrated magnitudes. Total magnitudes are less uncertain than optical isophotal diameters, which require the determination of the light radial profile and are thus more sensitive to the sky subtraction and the determination of the fitting parameters (inclination, position angle, etc.).
The reference scaling relation for the calibration of the gas deficiency parameter must use a scaling variable that is not affected by the interaction of galaxies with the perturbing environment. Multizone chemo-spectrophotometric models of galaxy evolution especially tailored to mimic the perturbations induced by the environment on spiral discs have shown that, on relatively short timescales, ram pressure stripping events do not perturb the total stellar mass of galaxies (Boselli et al. 2006)111 They can, however, reduce the extension of the stellar disc when measured in photometric bands sensitive to the presence of young stellar populations. Even though the -band is sensitive to the presence of relatively young stars, we did not observe any strong systematic difference in the isophotal radii of isolated and cluster galaxies (Cortese et al. 2012a).. There is a further reason to prefer the stellar mass to the optical area as scaling variable to calibrate the molecular gas deficiency parameter. Molecular gas masses of most of the galaxies of our sample (78 %) have been determined by correcting central single beam observations using an aperture correction depending on the optical diameter of the galaxies. Although this is a second order effect, it might artificially reduce the scatter in the vs. relation.
Part of the scatter in the molecular gas mass vs. stellar mass relation might result from the uncertainty in the determination of the stellar mass through the use of simple recipes as the one adopted in this work. To quantify this possible effect, we compare the stellar masses estimated following the prescription of Zibetti et al. (2009) used in this work to those determined using two different methods. We first compare our stellar masses to those determined using the recipe given in Boselli et al. (2009) based on -band luminosities and colour-dependent stellar mass-to-light ratios. These two prescriptions are totally independent since based on different sets of photometric data (SDSS for the former, Johnson the latter), stellar population synthesis models (the 2007 version of the Bruzual & Charlot 2003 models for Zibetti et al. 2009, Boissier & Prantzos 2000 for Boselli et al. 2009), IMF (Chabrier 2003 vs. Kroupa 2001). The two sets of stellar masses determined using these methods are consistent, with a typical scatter of 0.14 dex. We then compare these two sets of stellar masses to those determined by Boquien et al. (2012) using a SED fitting technique for a subsample of 64 HRS galaxies in common. For these objects stellar masses have been estimated using the CIGALE SED fitting code (Noll et al. 2009) based on the Maraston (2005) population synthesis models, and assuming a Kroupa (2001) IMF. The code has been run for a solar metallicity, and assuming two exponentially declining star formation histories, the first one 13 Gyr old to reproduce the old stellar population, the second one recent to mimic the present star formation activity. Once again the stellar masses determined using the prescription of Zibetti et al. (2009) and Boselli et al. (2009) are very consistent with those determined using the SED fitting technique. The comparison with both stellar masses has a typical scatter of 0.13 dex. This test indicates that the uncertainty on the stellar mass of our galaxies is 0.10 dex, and is independent of the method adopted to estimate it. The advantage of using several photometric bands in a SED fitting technique with respect to colour-based relations is balanced by the large uncertainty in the star formation history of these perturbed, cluster galaxies and by the use of a fixed, solar metallicity (the HRS sample spans a relatively large range in metallicity, 8.4 12+log O/H 8.8, Hughes et al. 2013). On the other hand, the colour-based stellar mass recipes such as those of Boselli et al. (2009) have been calibrated using chemo-photometric models of galaxy evolution able to reproduce the radial gradients of nearby galaxies and are thus perfectly tuned to reproduce the objects analysed in this work. The uncertainty on the stellar mass (0.10 dex) must be compared to that on the molecular gas mass, which is hard to quantify given the large uncertainty on the conversion factor that might change from galaxy to galaxy. A direct comparison can be done with the uncertainty on the total CO flux determination, which is 12 % (0.05 dex) in the subsample of galaxies with CO data from Kuno et al. (2007), and 44 % (0.16 dex) in the remaining objects. The uncertainty on the stellar mass only dominates the scatter in the vs. relation in the subsample of galaxies with high-quality CO maps from Kuno et al. (2007), but not on the whole sample, where the dispersion in the relation ( 0.30) is significantly higher.
Identified the stellar mass as the best variable tracing the molecular gas content of spiral galaxies, we can also plot and calibrate the relationship between molecular gas and stellar mass for the subsample of galaxies mapped by Kuno et al. (2007; Fig. 3). Despite its poor statistical robustness (it is based on only eight galaxies with a normal atomic gas content), this calibration is well tuned to quantify the molecular gas stripping of the subsample of galaxies homogeneously mapped in CO by Kuno et al. (2007). This calibration should not be extended to low-mass systems given that the dynamic range covered by the subsample of galaxies with data from Kuno is limited to 1010 M⊙. Figure 3, however, shows that the extrapolation of the Kuno et al. calibration well matches the molecular gas vs. stellar mass relation observed in low-mass systems, where aperture corrections are expected to be more accurate. The molecular gas mass of the mapped galaxies is systematically higher than that of similar galaxies with extrapolated data. The systematic difference in the high stellar mass range might be partly due to a larger uncertainty in the aperture correction in extended, massive systems than in small objects, where the beam of the telescope approximately matches the optical extension of the galaxy.
The and coefficients given in Table 2, combined with eq. 1, can be used to estimate the expected molecular gas content of a galaxy of given stellar mass . As in Boselli et al. (2002), we define a molecular hydrogen gas deficiency:
| (2) |
where the expected molecular gas mass of a target galaxy of stellar mass , deduced from eq. 1 by substituting with , is compared to that determined from the CO observations (). As defined, the molecular gas deficiency parameter is consistent with the atomic hydrogen deficiency parameter of Haynes & Giovanelli (1984) to quantify any possible effect on the atomic gas properties of galaxies in dense environments. Part of the dispersion in Fig. 2 can be correlated to other physical parameters. In paper II we have shown that the ratio is indeed correlated to the specific star formation rate, a parameter tightly connected to the cluster environment (Gavazzi et al. 2002). Given the poor statistics in our subsample of Hi-normal objects, and in particular in those with high-quality integrated CO data (8 objects), we cannot test whether the use of different coefficients for subsamples of galaxies selected according to different criteria (morphological type, effective surface brightness…) can reduce the scatter in the relation. Equation 2 is in logarithmic scale, and thus indicates that a galaxy with an = 1 has 10 times less molecular hydrogen than a typical unperturbed object of similar stellar mass. The mean dispersion in the vs. for galaxies with 0.4 used to calibrate the -deficiency parameter is = 0.27 and = 0.31 for the whole sample (the first value is relative to a constant , the second one to a luminosity-dependent ), and drops to = 0.14-0.13 for the subsample of galaxies with integrated data. We can thus consider as molecular gas deficient objects those galaxies with 0.3. We recall, however, that both the Hi- and -deficiency parameters should be considered only statistically. This is even more evident for where the uncertainties on the determination of the total CO luminosity due to aperture corrections are significantly more important than those on the estimate of the total Hi mass.
4.2 Molecular gas stripping
The effects of the cluster environment on the molecular gas content of all the HRS galaxies can already be noticed from the analysis of Fig. 2 where, for a given stellar mass, Hi-deficient cluster galaxies ( 0.4; empty symbols) are located systematically below unperturbed objects ( 0.4; filled symbols). The same effect, if present, is very marginal in low-mass systems. The best fit of the vs. relation determined using all unperturbed galaxies (black solid line) is indeed steeper and higher than that measured using all the Hi-deficient galaxies (black dotted line). The two best fits match at 109 M⊙, the lower limit in stellar mass sampled by our data. The different behaviour of massive and dwarf systems might be related to a bias in the CO data. At low stellar masses, where the sample is not complete, there is a systematic lack of CO data in the most HI-deficient galaxies of the sample, as discussed in sect. 4.3. The mean value of determined for the low-mass systems should thus be considered as an upper limit.
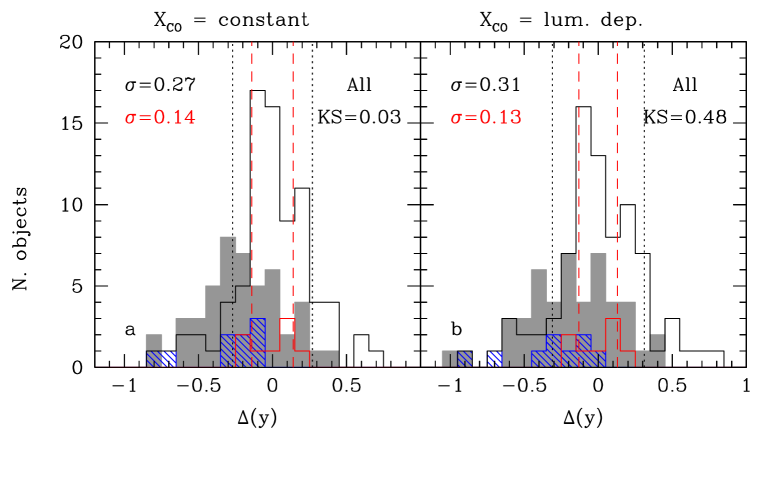
To quantify statistically this effect we show in Fig. 4 the distribution of the distance from the
fitted vs. relations shown in Figs. 2 and 3
for different subsamples of galaxies. Since we expect that the molecular gas content of galaxies decreases gradually with their degree of perturbation,
thus with their Hi-deficiency parameter, we compare the distribution of the distance from the fitted relations for two well distinct populations.
We identify unperturbed objects those with 0.3. This is a more stringent limit than the one generally used in this work. We recall that
= 0.3 corresponds to the dispersion in the Hi-deficiency distribution of isolated galaxies first determined by Haynes & Giovanelli (1984). We compare their distribution
to that of the most Hi-deficient objects of the sample ( 0.6).
Figure 4 shows that the most Hi-deficient galaxies of the sample have, on average, a lower molecular gas content per unit stellar mass than unperturbed objects.
The mean value for the 80 galaxies with 0.3 is = 0.00 0.03 (error on the mean) for both a constant or a luminosity-dependent ,
while that of the 47 most Hi-deficient objects of the sample ( 0.6) is = -0.21 0.04 ( constant) and = -0.18 0.04 (
luminosity-dependent).
A Kolmogorov-Smirnov test indicates that the probability that the two distributions are drawn by the same underlying population is less than 0.5%, and this regardless the use of a constant
or a luminosity-dependent conversion factor222The mean values of Hi-normal and Hi-deficient galaxies when a unique threshold of 0.4 is
used to separate the two subsamples are = -0.01 0.03 for both a constant or a luminosity-dependent ,
and = -0.15 0.04 ( constant) and = -0.12 0.04 ( luminosity-dependent). Using this definition to identify perturbed and unperturbed
objects, the probability that the two distributions are drawn by the same underlying population is still less than 0.5% when a constant is assumed, and increases to 9.1%
for luminosity-dependent..
The same systematic difference is also observed in the distribution of of Hi-normal ( 0.4)
and Hi-deficient ( 0.4) galaxies with high-quality data from Kuno et al. (2007), or for the subsample of massive ( 1010 M⊙) objects
(the number of objects belonging to these subsamples is unfortunately too small to make reliable statistical tests such as the Kolmogorov-Smirnov test).
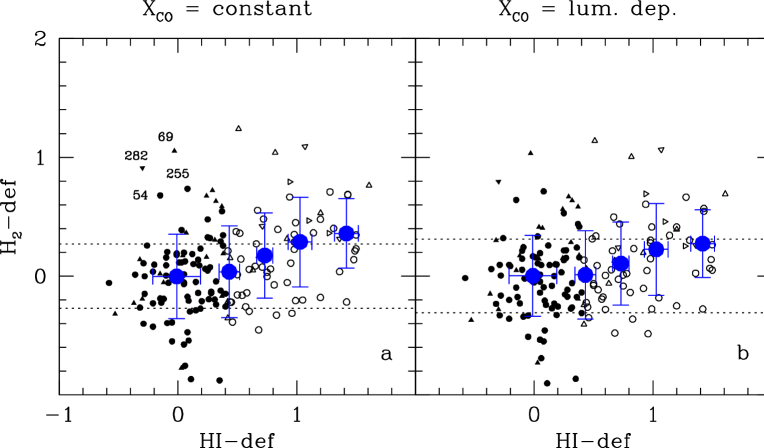
To quantify the effect of the Virgo cluster environment on the molecular gas content of the HRS galaxies, we plot in Figs. 5 the relationship between the H2 () and the Hi () deficiency parameters for the whole sample of galaxies. Given that the Hi gas is easily removed in any kind of gravitational or dynamical interaction with the cluster environment (Boselli & Gavazzi 2006), the parameter is here used as a proxy for the induced perturbation. Figure 5 shows a dispersed but statistically significant relation between the two variables. This relation seems robust vs. the adoption of a constant or a luminosity-dependent conversion factor (left vs. right panels), with a probability that the two variables are correlated always larger than 99 %. Figure 5 shows that, on average, Hi-poor galaxies have a lower molecular gas content than unperturbed objects. The observed relation is steeper for the unbiased subsample of massive galaxies than for the whole HRS sample. The lack of moleculr gas, however, seems significantly less important than that of atomic gas: the mean value of for all the Hi-normal ( 0.4) HRS spiral galaxies of the sample is 0.00 0.04 (error on the mean) and increases up to 0.3 0.08 for the most Hi-poor objects ( 1.2) (see Table 5). Limited to massive galaxies, the -deficiency parameter increases by 0.4 from the unperturbed to the most Hi-deficient objects of the sample ( 4 effect).
As discussed in Fumagalli et al. (2009), there are several Hi-deficient galaxies with a normal molecular gas content. At the same time, Fig. 5 shows also the presence of a few spiral galaxies with a normal atomic gas content but deficient in molecular hydrogen. These objects are identified in panel a of Fig. 5, and are the galaxies HRS 54 (NGC 3681), HRS 69 (NGC 3898), HRS 255 (NGC 4688) and HRS 282 (NGC 4803). Clearly the uncertainty on the estimate of the total CO emission of HRS 69 and HRS 255 is very high given the filling factor of the telescope beam during the observations ( = 0.107 in HRS 69, =0.036 in HRS 255, see paper I). We also notice that the UV (Cortese et al. 2012a), H (Boselli et al., in prep.) or mid-infrared (Bendo et al. 2012) images of HRS 54 and 69 are characterised by an external ring of HII regions, thereby suggesting that the molecular gas associated to these star forming regions might not be detected by the central beam observation. We recall that HRS 282 is morphologically identified as ”compact”, and is much more similar to a quiescent, early-type galaxy than to a star forming spiral. It is indeed one of the few bright spirals non-detected by SPIRE (Ciesla et al. 2012).
The trend between the Hi- and H2-deficiency parameters is very weak, with the most Hi-poor galaxies only having, on average, a factor of 2 less molecular gas (at 4 level) than unperturbed objects. This small variation is hardly detectable with the whole sample of galaxies given that it is just a factor of 2 the typical uncertainty on the molecular gas mass estimate, and can thus be taken only with a statistical sense. This weak trend was not detectable with the data set of Boselli et al. (2002), where the typical dispersion in the H2-deficiency parameter of unperturbed objects was as large as 0.5, nor with the very small sample of galaxies in A1367 by Scott et al. (2013).
We can check whether the trends observed using the whole HRS sample are also shared by the subsample of galaxies with high-quality CO data from Kuno et al. (2007). As for Fig. 2, Fig.
3 shows a systematic difference in the molecular gas mass vs. stellar mass relation in the CO mapped galaxies. Indeed those objects with a normal atomic gas content have systematically higher
molecular gas masses than the perturbed objects ( 0.4). The small dispersion in the vs. relation, probably due to the small uncertainty in the
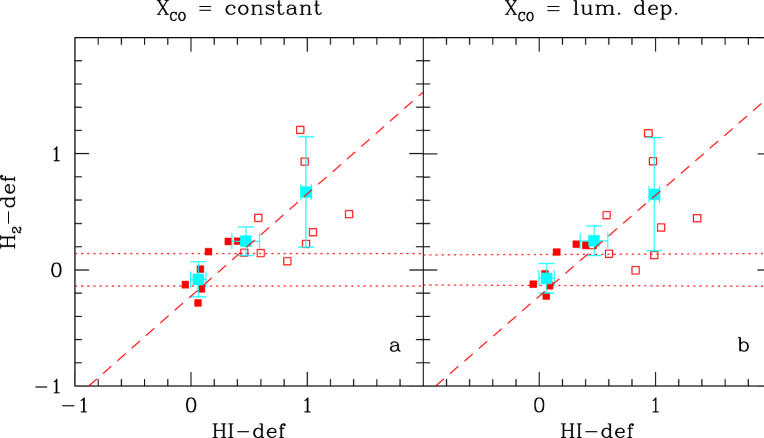
molecular gas determination, indicates that this difference is significant. We can also see the relationship between the Hi- and H2-deficiency parameters in Fig. 6
when the H2-deficiency parameter of the Kuno et al. galaxies is calculated using the calibration given in Fig. 3. Again, Fig. 6 shows a well defined trend between the
two variables ( 99.9 %), thereby confirming the results obtained for the whole sample (the results of the bisector fit
are given in Table 4). Here the dispersion in the H2-deficiency parameter of unperturbed galaxies is only 0.14, thus a factor of
4 less than the mean H2-deficiency of the most Hi-perturbed galaxies of the Kuno et al. sample.
The same H2 vs. Hi-deficiency relations for the whole sample
of HRS galaxies but determined using the H2-deficiency calibration of Kuno et al. give steeper
and stronger ( 99.9%) trends between the two variables than those shown in Fig. 5.
The slope in the vs. relation is 1 for every H2-deficiency calibration and analysed subsample,
whcih suggests that the molecular gas depletion is less efficient than the atomic one.
The interpretation of this new, observational evidence, i.e. the molecular gas deficiency in cluster galaxies, can follow two different arguments. The first one is related to the transformation of Hi to H2, the second one ram pressure stripping of the molecular gas (Fumagalli et al. 2009).
4.2.1 Molecular gas formation
Following the theoretical
motivations of Krumholz et al. (2008, 2009), the molecular gas phase is formed from the condensation of the atomic hydrogen, which only happens when the Hi column density exceeds a
critical value of 10 M⊙ pc-2. The decrease of the atomic gas column density resulting from
the gas stripping in cluster galaxies, probably related to a ram pressure phenomenon (Boselli & Gavazzi 2006), drops the Hi column density to
values of 2 M pc-2 (Cayatte et al. 1994, Chung et al. 2009a, Fumagalli et al. 2009), thus below this
critical density. This effect might induce a lower formation rate of the molecular gas phase, producing thus molecular gas poor cluster galaxies.
The timescale for molecular gas formation on dust grains is indeed quite short, of the order of 10-30 Myr (Liszt 2007; Goldsmith et al. 2007; Lee et al. 2012).
This phenomenon, however, would not affect the dust component associated to the molecular gas and thus does not explain the observed truncation of the far-infrared radial profiles
of Hi-deficient late-type galaxies in the Virgo cluster (Cortese et al. 2010; 2012b).
4.2.2 Ram pressure stripping
In the assumption that the radial molecular hydrogen distribution
linearly follows the CO emission, i.e. that the radial variations of the conversion factor due to metallicity gradients are minor
compared to the variations of the CO emission (Sandstrom et al. 2013), the analysis presented in this work just indicates that the molecular gas phase is removed by a ram pressure stripping event less efficiently than the
atomic one. This can be understood considering that the CO emission over the disc of galaxies is exponentially declining with a characteristic disc scalelength
0.2 the optical isophotal radius (Lisenfeld et al. 2011 and references therein), while the atomic hydrogen has a much
flatter and extended distribution (Cayatte et al. 1994, Bigiel & Blitz 2012). The atomic gas phase,
which is dominating the gas phase in the outer disc, is thus the one less anchored
to the gravitational potential well of the galaxy. It can be easily removed during any kind of gravitational interaction with nearby companions or with the cluster gravitational potential well
(galaxy harassment), or during the dynamical interaction of the galaxy with the hot and dense intracluster medium (Boselli & Gavazzi 2006). The molecular phase,
more centrally peaked, thus trapped within the gravitational potential well of the galaxy, is less efficiently removed during this kind of interaction.
The ram pressure stripping scenario is supported by
recent Herschel observations of the HRS. Cortese et al. (2010, 2012b)
have shown that the dust component, tightly associated to the molecular gas phase of the ISM, is stripped in the most Hi-deficient Virgo cluster galaxies, which are indeed the same
galaxies showing molecular gas deficiency. This result is also in agreement with the observation of targeted objects with evidence of ongoing molecular gas stripping, such as
NGC 4522, NGC 4438, and NGC 4330 in Virgo (Vollmer et al. 2008a, 2009, 2012a) or ESO 137011 in Abell 3627 (Sivanandam et al. 2010).
We also notice that, among the brightest galaxies mapped by Kuno and collaborators, those with the highest H2-deficiencies have all truncated
(NGC 4419, 4501, 4569, 4579) or anemic (NGC 4548) H (Koopmann & Kenney 2004) and Hi (NGC 4548, 4569, 4579) profiles (Cayatte et al. 1994),
typical signs of a recent interaction with the intracluster medium. The detailed analysis of some of these objects have indeed shown
an ongoing (NGC 4501, Vollmer et al. 2008b) or recent (NGC 4548, Vollmer et al. 1999; NGC 4569, Vollmer et al. 2004, Boselli et al. 2006)
ram pressure stripping event.
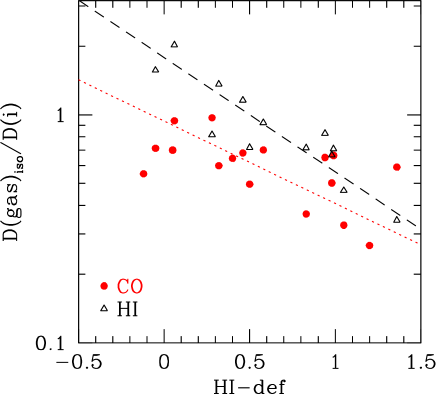
To test whether this scenario is consistent with the data, we plot in Fig. 7 the relationship between the ratio of the atomic and molecular gas-to-stellar (-band)
isophotal diameter ratio and the Hi-deficiency parameter. CO and Hi isophotal diameters are taken from the subsample of HRS galaxies mapped by Chung et al. (2009b)333The galaxy NGC 4536 (HRS 205) is not included
in the plot because not fully mapped in CO by Chung et al. (2009b) in CO and by Chung et al.
(2009a) in Hi. Both molecular and atomic gas isophotal diameters are determined where the gas column density drops to 1 M⊙ pc-2.
The figure shows two statistically significant anticorrelations between the gas (atomic and molecular)-to-stellar isophotal
diameter ratios and the Hi-deficiency parameter. A bisector fit to the data gives
log = -0.50 +0.25, -0.80, 99.5% and
log = -0.36 -0.03, -0.57, 99%, thereby suggesting that gas erosion in cluster galaxies is an outside-in process.
The atomic gas and, to a lower extent, the molecular gas, are removed in the outer parts of galaxies belonging to high-density environments.
A steeper relation between vs. than between vs. is consistent with our previous
result that the slope of the - vs. Hi-deficiency relation is smaller than one (see Figs. 5-6). This result is also
perfectly consistent with a ram pressure stripping scenario, where only the gaseous component is perturbed during the interaction. Gravitational interactions (harassment) would indeed perturb also the
stellar component. We recall that the vs. relation shown in Fig. 7 also perfectly matches the observed cold dust-to-optical
isophotal diameter ratio vs. Hi-deficiency relation determined using SPIRE/Herschel data for the HRS galaxies by Cortese et al. (2010).
Recent high-resolution (40 pc) 3D hydrodynamical simulations of galaxies undergoing a ram pressure stripping event support this scenario. Tonnesen & Bryan (2009) have included in their code radiative cooling on a multiphase medium. This naturally produces a clumpy ISM with densities spanning six orders of magnitude, thus quite representative of the physical conditions encountered in normal, late-type galaxies. Their simulations show that under these conditions the gas is stripped more efficiently up to the inner regions with respect to an homogeneous gas. They also show that all the low density, diffuse gas is quickly stripped at all radii. When the ram pressure stripping is strong there is also less gas at high densities. The deficiency in high-density regions results from the lack of the diffuse component feeding giant molecular clouds. This evidence suggests that the ram pressure stripping process, at the origin of the Hi-deficiency observed in cluster galaxy, is able to remove also the molecular gas. For this reason we interpret the trend between the H2 and the Hi-deficiency parameters shown in Fig. 5 as an evidence of molecular gas ram pressure stripping in cluster galaxies.
4.3 Implications on the star formation history of cluster galaxies
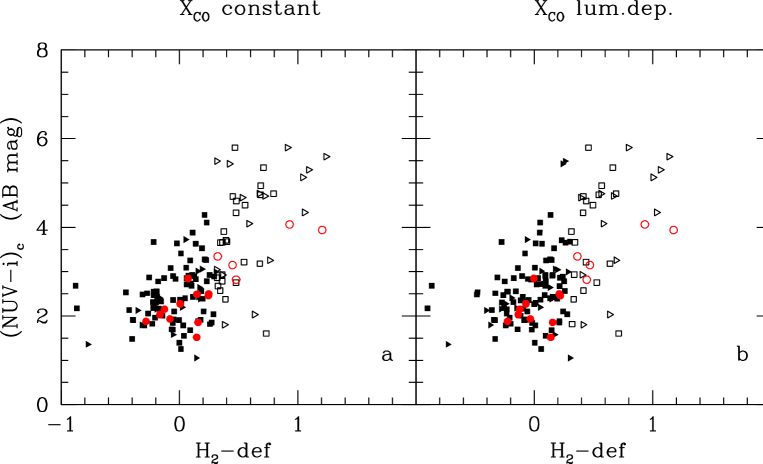
To study the physical consequences of the molecular gas stripping of cluster galaxies on the process of star formation, we plot in
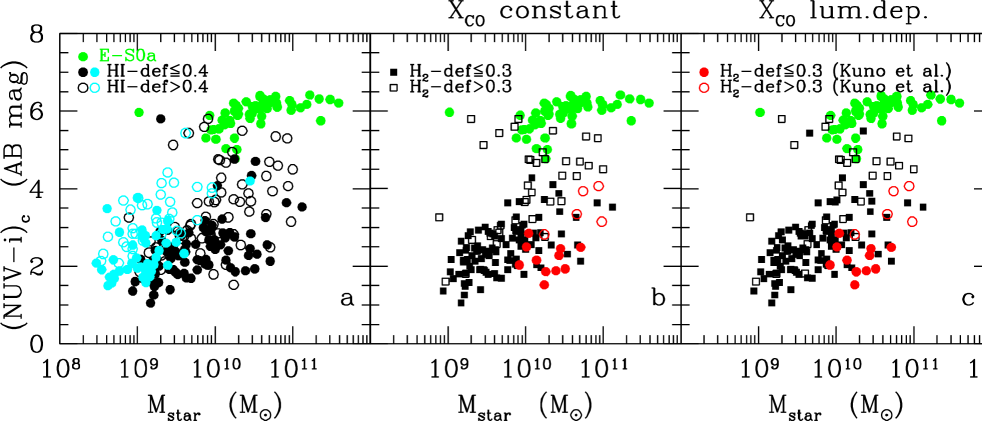
Fig. 8 the relationship between the colour index, here taken as a proxy for the specific star formation rate, and the H2-deficiency parameter.
444NUV magnitudes are corrected for internal dust attenuation according to Hao et al. (2011), while the attenuation in the -band is simply determined by scaling those in the NUV band
using the Galactic extinction law of Fitzpatrick & Massa (2007). They are also corrected for Galactic extinction according to Schlegel et al. (1998).
There is a clear trend between the two variables regardless of the adopted definition which indicates that -deficient spiral galaxies have, on average, redder colours
than objects with a normal molecular gas content. The lack of molecular gas quenches the activity of star formation making galaxies redder. This evolutionary picture can be seen
also in a vs. colour-magnitude relation (Fig. 9).
The atomic and molecular gas-deficient cluster spiral galaxies of the sample are located in the ”green valley” consistently with the picture where they are
migrating from the blue cloud to
the red sequence (Hughes & Cortese 2009; Cortese & Hughes 2009; Gavazzi et al. 2013a,b). Figure 9 also shows that atomic and molecular gas
deficient objects in the green valley are mainly massive galaxies ( 1010 M⊙). There is a lack of H2-deficient objects in the low stellar mass range.
This clearly results from a selection bias in the sample since at low stellar masses there
is a large number of Hi-deficient galaxies, mainly located in the ”green valley”, without CO data. This bias explains the
trend observed in Fig. 2, where the few Hi-deficient low-mass galaxies have molecular gas contents comparable to that of unperturbed systems.
Our data show that the gas consumption timescales of cluster and isolated objects are comparable (see Table
6).
Because of the tight relation between gas column density and star
formation, the stripped gas does not further supply the star formation process reducing the global activity
in the perturbed galaxies. The ratio of the gas mass to the star formation activity, or in other words the gas consumption timescale, thus remains fairly constant and
similar to that of unperturbed objects. This result is consistent with the pixel per pixel analysis of resolved, Virgo cluster galaxies done by Vollmer et al. (2012b).
What is the physical process governing the future evolution of these galaxies? To answer this question we first compare the gas depletion timescales determined in this work to other representative timescales for the evolution of galaxies in clusters. The typical crossing of a cluster such as Virgo is 1.7 Gyr (Boselli & Gavazzi 2006), while the timescale necessary to strip gas from a galaxy via ram pressure is of the order of 100-200 Myr (Vollmer et al. 2004, 2008a, 2009, 2012a; Boselli et al. 2006; Roediger & Bruggen 2007; Crowl & Kenney 2008). This stripping process only removes a fraction of the total gas from massive objects, while it has dramatic effects in dwarfs, where the star formation process is completely stopped (Boselli et al. 2008a). The simulations of Tonnesen et al. (2007) done considering only the atomic, diffuse gas phase indicate that ram pressure is the dominant process responsible for gas sweeping up to the virial radius of the cluster, which in Virgo is of 1.68 Mpc. Models and simulations indeed show that, although dominant in the core of the cluster where the velocity of the galaxy and the density of the ICM are maximal, ram pressure stripping is an ongoing process eroding the gaseous component all over the orbit of the galaxy within the cluster (Roediger & Hensler 2005; Roediger & Bruggen 2006, 2007). If most of the gas is removed rapidly, the total gas sweeping requires longer timescales. The simulations of Tonnesen et al. (2007) done using a single phase component of the ISM show that the gas is totally removed on timescales 1 Gyr. Timescales of the order of 1.5 Gyr are also obtained using 3D hydrodynamical simulations by Roediger & Bruggen (2007) for a substantial reduction of the total gas content of the perturbed galaxy via ram pressure. These hydrodynamical simulations based on a single and homogeneous gas phase for the ISM, however, generally underestimate the efficiency of ram pressure stripping (Tonnesen & Bryan 2009). Multiphase hydrodynamical simulations indicate that gas ablation in all its phases (from diffuse atomic to dense molecular gas) can take place at all galactic radii if ram pressure stripping is sufficiently strong, as indeed is the case in rich clusters of galaxies such as Virgo (Tonnesen & Bryan 2009). There is also observational evidence indicating that ram pressure stripping is efficient up to the cluster virial radius (Scott et al. 2012; Gavazzi et al. 2001; Yagi et al. 2010; Fossati et al. 2012). It is thus reasonable to assume that ram pressure stripping can completely remove the gas of the ISM on timescales of 1.5 Gyr in galaxies within the virial radius555This assumption is different from the one taken by Cortese & Hughes (2009) based on earlier simulations, where ram pressure stripping is not able to remove the whole gas content of massive spiral galaxies in rich clusters..
How does this timescale compare with the timescale for gas consumption via star formation (starvation)? We recall that the definition of starvation that we adopt here
is the consumption of the gas via star formation when the cosmological infall of pristine gas is stopped (Boselli et al. 2006). This definition is quite different from the original one given in Larson et al. (1980),
who considered in the starvation process also the removal of the gas rich envelopes of galaxies. Here we consider any process able to remove any gaseous component associated to the galaxy, including the Hi
gas located well outside the optical disc, as ram pressure stripping.
To estimate the gas consumption timescales we should consider the contribution of the recycled gas.
The amount of recycled gas during the whole life of galaxies is generally assumed of the order of 30% of their stellar mass (Kennicutt 1994). Since a large fraction of this gas, the one produced by the oldest stars,
has been already injected into the ISM before the first interaction with the ICM and partly removed by the ram pressure stripping event, we have to consider here only the fraction of recycled gas
produced after the beginning of the interaction. The chemo-spectrophotometric models expressly tailored to take the perturbation induced by the cluster environment on galaxy evolution
that we have developed into account
can be used for this purpose (Boselli et al. 2008a). They indicate that the amount of recycled gas after a ram pressure stripping event is of the order of 9.0 108 M⊙ for a
massive galaxy of = 4.6 1010 M⊙, and of 4.2 107 M⊙ for an object of = 2.0 109 M⊙, the typical stellar mass range covered by our sample. These amounts of gas
are re-injected into the ISM in a few Gyr. We can interpolate these values to calculate the mean quantity of recycled gas that should be taken into account for galaxies of different stellar mass.
With the contribution of the recycled gas, the amount of gas locked in galaxies available to sustain star formation at a rate similar to the present one increases up to 3.0-3.3 Gyr.
These timescales are a factor of 2 longer than the timescale for total gas removal through a ram pressure stripping event.
They are also comparable to two crossing of the cluster (3.4 Gyr), a time sufficiently long to
allow ram pressure stripping to reach its maximum for three times. Furthermore, these timescales must
be considered as lower limits to the time necessary to completely stop any star formation activity since the star formation activity smoothly decreases with time after a gradual consumption of the gas content
(Schmidt law). We can thus conclude that, if the timescale for totally removing the gas content of cluster galaxies
is of the order of 1.5 Gyr as indicated by hydrodynamical simulations, ram pressure stripping will be the dominant process regulating
the future activity of these cluster spiral galaxies.
Can these results, combined with those obtained in other works, be used to identify the main physical process driving the formation of the bright end of the red sequence in a cluster such as Virgo? Ram pressure stripping events have been less efficient in the past because the velocity dispersion within the cluster and the density of the ICM were smaller than at the present epoch. It is thus conceivable that their contribution to the quenching of the star formation activity of cluster galaxies has increased with the age of the universe to be at their maximum at the present epoch. To produce effects on the total gas content comparable to those observed in Virgo Hi-deficient cluster galaxies ( up to 1), the stop of infall of pristine gas from the halo must have started 7 Gyr ago (Boselli et al. 2006). This timescale, quite accurate since determined using tuned chemo-spectrophotometric models of galaxy evolution, is even longer than the rough estimates given in this work. Here we just indicate that the timescale for gas consumption does not drastically change in different environments. We can thus expect that the timescale for gas consumption via star formation is long at any epoch. The same chemo-spectrophotometric models also indicate that the effects on the star formation activity of the starved galaxies are minor. They cannot move, for instance, a galaxy from the blue to the red sequence (Boselli et al. 2008a). If started at such early epochs, the stop of infall of pristine gas would also have had major effects on the structural properties of the perturbed galaxies. Their effective surface brightness would have been much lower than the one of unperturbed, spiral galaxies (Boselli et al. 2006). This is exactly the opposite of what is observed (Boselli & Gavazzi 2006). Furthermore, 7 Gyr ago roughly corresponds to the epoch when a cluster such as Virgo started to form through the aggregation of small groups (Gnedin 2003; McGee et al. 2009; Roediger et al. 2011). Preprocessing was at that time dominating (e.g. Dressler 2004; Dressler et al. 2013). Under these conditions the gravitational interactions were much more efficient than those affecting galaxies in a formed cluster because of the low velocity dispersion of the group. We thus expect that gravitational interactions were able to dynamically heat the systems, thicken the stellar disc and produce the analogue of local, massive lenticular galaxies.
5 Conclusion
We use the recent compilation of homogeneous atomic and molecular gas data for the Herschel Reference Survey, a K-band-selected, volume-limited, complete sample of galaxies in the nearby universe, to study the effects of the surrounding environment on the molecular gas content of cluster galaxies. Using the subsample of isolated, unperturbed objects, we first identify the vs. relation as the less dispersed scaling relation necessary to estimate the expected molecular gas content of perturbed galaxies of different size and luminosity. By studying the distribution of the distance to this relation we show that Hi-deficient, Virgo cluster galaxies have, on average, less molecular gas than Hi-normal field objects. We then calibrate the H2-deficiency parameter, defined as the difference between the expected and the observed molecular gas mass of an unperturbed galaxy of similar stellar mass. The H2-deficiency parameter increases with Hi-deficiency parameter, here taken as tracer of an undergoing perturbation. The relation is weak and scattered, but statistically significant (the probability that the two variables are correlated is 99 %). This relation is barely detectable in the whole sample because of the large uncertainty on the total CO fluxes due to aperture corrections. It is, however, confirmed on a subsample of galaxies with high-quality CO data from mapping. Using a subsample of seventeen CO mapped galaxies, we show that, as for the atomic gas, the extension of the molecular disc decreases with increasing Hi-deficiency. This result suggests that gas removal is an outside-in process able to truncate the gaseous disc of galaxies in high-density regions.
The analysis presented in this work shows the presence of molecular gas deficient galaxies in the core of the Virgo cluster. It is consistent with previous results based on the study of the radial distribution of the molecular gas of a few, resolved galaxies (Boselli et al. 2006; Fumagalli et al. 2009) and on the statistical analysis of a heterogeneous sample of cluster and isolated objects (Jablonka et al. 2013). This result is statistically significant, based on a homogeneous sample of cluster and field galaxies selected according to similar criteria to minimise selection biases, and robust vs. the adoption of a constant or a luminosity-dependent conversion factor. Combined with the recent evidence of dust stripping obtained from Herschel observations (Cortese et al. 2010, 2012b), the deficiency of molecular gas in cluster galaxies can be interpreted as an effect of the ram pressure stripping exerted by the hot intergalactic medium on galaxies moving at high velocity within the cluster rather than due to a low formation rate of molecular gas whenever the interstellar medium of galaxies drops below a critical density, as firstly proposed by Fumagalli et al. (2009). Given the steep gradient in the molecular gas distribution over the galactic disc, molecular gas stripping is less efficient than atomic gas stripping, as indicated by the slope 1 in the vs. relation and by the steeper slope in the vs. (slope = -0.50) than in the vs. (slope = -0.36) relation. The most Hi-deficient, Virgo cluster galaxies ( 1) have, on average, a factor of 2 less molecular gas than similar objects in the filed.
The molecular and total gas consumption timescales of these H2-deficient cluster galaxies are 1.2 Gyr, 2.6 Gyr, and 3.0-3.3 Gyr when the recycled gas is considered. These timescales are significantly longer than the timescale necessary for ram pressure to produce a typical Hi-deficient cluster galaxy ( 0.1 Gyr). On these timescales a galaxy can cross the core of the cluster and thus reach the peak of its gas stripping three times. The total gas depletion timescale determined considering the contribution of the recycled gas produced by stars after the first crossing of the cluster is also a factor of 2 longer than the typical timescale for total gas ablation via ram pressure determined by recent hydrodynamical simulations to be of the order of 1.5 Gyr. This indicates that ram pressure stripping, rather than gas consumption via star formation, is the main process driving the future evolution of these cluster gas-deficient spiral galaxies. The removal of the cold gaseous phase quenches the activity of star formation, inducing the migration of these originally star forming systems from the blue sequence into the green valley and, eventually into the red sequence.
Acknowledgements.
A.B thanks the ESO visiting program committee for inviting him at the Garching headquarters for a two-month stay. We are also grateful to M. Fossati for his help during the preparation of the CO dataset and to M. Gerin for a constructive discussion on the timescale for molecular gas formation. We also thank the anonymous referee for useful comments and suggestions which improved the quality of the manuscript. The research leading to these results has received funding from the European Community’s Seventh Framework Programme (/FP7/2007-2013/) under grant agreement No 229517. B.C. is the recipient of an Australian Research Council Future Fellowship (FT120100660).This research has made use of the NASA/IPAC Extragalactic Database (NED) which is operated by the Jet Propulsion Laboratory, California Institute of Technology, under contract with the National Aeronautics and Space Administration and of the GOLDMine database (http://goldmine.mib.infn.it/). IRAF is distributed by the National Optical Astronomy Observatory, which is operated by the Association of Universities for Research in Astronomy (AURA) under cooperative agreement with the National Science Foundation.References
- (1) Balogh, M., Navarro, J., Morris, S., 2000, ApJ, 540, 113
- (2) Bendo, G., Galliano, F., Madden, S., 2012, MNRAS, 423, 197
- (3) Bigiel, F., Blitz, L., 2012, ApJ, 756, 183
- (4) Boissier, S., Prantzos, N., 2000, MNRAS, 312, 398
- (5) Boquien, M., Buat, V., Boselli, A., et al., 2012, A&A, 539, 145
- (6) Boselli, A., 2011, in ”A Panchromatic View of Galaxies”, Wiley-VCH, Berlin (ISBN-10: 3-527-40991-2)
- (7) Boselli, A., Gavazzi, G., 2006, PASP, 118, 517
- (8) Boselli, A., Gavazzi, G., 2009, A&A, 508, 201
- (9) Boselli, A., Gavazzi, G., Lequeux, J., Buat, V., Casoli, F., Dickey, J., Donas, J., 1995, A&A, 300, L13
- (10) Boselli, A., Gavazzi, G., Lequeux, J., Buat, V., Casoli, F., Dickey, J., Donas, J., 1997, A&A, 327, 522
- (11) Boselli, A., Gavazzi, G., Donas, J., Scodeggio, M., 2001, AJ, 121, 753
- (12) Boselli, A., Lequeux, J., Gavazzi, G., 2002, A&A, 384, 33
- (13) Boselli, A., Boissier, S., Cortese, L., et al., 2006, ApJ, 651, 811
- (14) Boselli, A., Boissier, S., Cortese, L., Gavazzi, G., 2008a, ApJ, 674, 742
- (15) Boselli, A., Boissier, S., Cortese, L., Gavazzi, G., 2008b, A&A, 489, 1015
- (16) Boselli, A., Boissier, S., Cortese, L., Buat, V., Hughes, T., Gavazzi, G., 2009, ApJ, 706, 1527
- (17) Boselli, A., Eales, S., Cortese, L., Bendo, G., Chanial, P., Buat, V., Davies, J., Auld, R., et al., 2010, PASP, 122, 261
- (18) Boselli, A., Boissier, S., Heinis, S., et al., 2011, A&A, 528, 107
- (19) Boselli, A., Hughes, T., Cortese, L., Gavazzi, G., Buat, V., 2013a, A&A, 550, 114
- (20) Boselli, A., Cortese, L., Boquien, M., 2013b, A&A, (paper I), in press
- (21) Boselli, A., Cortese, L., Boquien, M., Boissier, S., Catinella, B., Lagos, C., Saintonge, A., 2013c, A&A, (paper II), in press
- (22) Bruzual, G., Charlot, S., 2003, MNRAS, 344, 1000
- (23) Casoli, F., Boissie, P., Combes, F., Dupraz, C., 1991, A&A, 249, 359
- (24) Cayatte, V., van Gorkom, J., Balkowski, C., Kotanyi, C., 1990, AJ, 100, 604
- (25) Cayatte, V., Kotanyi, C., Balkowski, C., van Gorkom, J., 1994, AJ, 107, 1003
- (26) Chabrier, G, 2003, PASP, 115, 763
- (27) Chung, A., van Gorkom, J., Kenney, J., Crowl, H., Vollmer, B., 2009a, AJ, 138, 1741
- (28) Chung, E., Rhee M., Kim, H., Yun M., Heyer, M., Young J., 2009b, ApJS, 184, 199
- (29) Ciesla, L., Boselli, A., Smith, M., et al., 2012, A&A, 540, 52
- (30) Cortese, L., Hughes, T., 2009, MNRAS, 400, 1225
- (31) Cortese, L., Davies, J., Pohlen, M., et al., 2010, A&A, 518, L49
- (32) Cortese, L., Catinella, B., Boissier, S., Boselli, A., Heinis, S., 2011, MNRAS, 415, 1797
- (33) Cortese, L., Boissier, S., Boselli, A., et al., 2012a, A&A, 544, 101
- (34) Cortese, L., Ciesla, L., Boselli, A., et al., 2012b, A&A, 540, 42
- (35) Cowie, L., Songaila, A., 1977, Nat., 266, 501
- (36) Crowl, H., Kenney, J., 2008, AJ, 136, 1623
- (37) Davies, T., Alatalo, K., Bureau, M., et al., 2013, MNRS, 429, 534
- (38) Dressler, A., in Clusters of Galaxies: Probes of Cosmological Structure and Galaxy Evolution, from the Carnegie Observatories Centennial Symposia. Published by Cambridge University Press, as part of the Carnegie Observatories Astrophysics Series. Edited by J.S. Mulchaey, A. Dressler, and A. Oemler, 2004, p. 206
- (39) Dressler, A., Oemler, A., Poggianti, B., Gladders, M., Abramson, L., Vulcani, B., 2013, ApJ, 770, 62
- (40) Fitzpatrick, E., Massa, D., 2007, ApJ, 663, 320
- (41) Fossati, M., Gavazzi, G., Boselli, A., Fumagalli, M., 2012, A&A, 544, 128
- (42) Fumagalli, M., Krumholz, M., Prochaska, X., Gavazzi, G., Boselli, A., 2009, ApJ, 697, 1811
- (43) Gavazzi, G., Pierini, D., Boselli, A., 1996, A&A, 312, 397
- (44) Gavazzi, G., Boselli, A., Mayer, L., Iglesias-Paramo, J., Vilchez, JM., Carrasco, L., 2001, ApJ, 563, L23
- (45) Gavazzi, G., Boselli, A., Pedotti, P., Gallazzi, A., Carrasco, L., 2002, A&A, 396, 449
- (46) Gavazzi, G., Boselli, A., van Driel, W., O’Neil, K., 2005, A&A, 429, 439
- (47) Gavazzi, G., Savorgnan, G., Fossati, M., et al., 2013a, A&A, 553, 90
- (48) Gavazzi, G., Fumagalli, M., Fossati, M., Galardo, V., Grossetti, F., Boselli, A., Giovanelli, R., Haynes, M., 2013b, A&A, 553, 89
- (49) Gnedin, O., 2003, ApJ, 582, 141
- (50) Goldsmith, P., Li, D., Krco, M., 2007, ApJ, 654, 273
- (51) Gunn, J., Gott, R., 1972, ApJ, 176, 1
- (52) Hao, C., Kennicutt, R., Johnson, B., Calzetti, D., Dale, D., Moustakas, J., 2011, ApJ, 741, 124
- (53) Haynes, M., Giovanelli, R., 1984, AJ, 89, 758
- (54) Hughes, T., Cortese, L., 2009, MNRAS, 396, L41
- (55) Hughes, T., Cortese, L., Boselli, A., Gavazzi, G., Davies, J., 2013, A&A, 550, 115
- (56) Jablonka, P., Combes, F., Rines, K., Finn, R., Welch, T., 2013, A&A, 557, 103
- (57) Karachentseva, V., 1973, Soobshceniya Spetsial’noj Astrofizicheskoj Observatorii, 8, 3
- (58) Kenney, J., Young, J., 1988, ApJ, 326, 588
- (59) Kenney, J., Young, J., 1989, ApJ, 344, 171
- (60) Kennicutt, R., 1998, ApJ, 498, 541
- (61) Kennicutt, R., Tamblyn, P., Congdon, C., 1994, ApJ, 435, 22
- (62) Koopmann, R., Kenney, J., 2004, ApJ, 613, 866
- (63) Kroupa, P., 2001, MNRAS, 322, 231
- (64) Krumholz, M., McKee, C., Tumlinson, J., 2008, ApJ, 689, 865
- (65) Krumholz, M., McKee, C., Tumlinson, J., 2009, ApJ, 693, 216
- (66) Kuno, N., Sato, N., Nakanishi, H., et al., 2007, PASJ, 59, 117
- (67) Larson, R., Tinsley, B., Caldwell, C., 1980, ApJ, 237, 692
- (68) Lavezzi, T., Dickey, J., 1998, AJ, 115, 405
- (69) Lee, MY., Stanimirovic, S., Douglas, K., et al., 2012, ApJ, 748, 75
- (70) Lisenfeld, U., Espada, D., Verdes-Montenegro, L., et al., 2011, A&A, 534, 102
- (71) Liszt, H., 2007, A&A, 461, 205
- (72) Maraston, C., 2005, MNRAS, 362, 799
- (73) McGee, S., Balogh, M., Bower, R., Font, A., McCarthy, I., 2009, MNRAS, 400, 937
- (74) Moore, B., Lake, G., Katz, N., 1998, ApJ, 495, 139
- (75) Noll, S., Burgarella, D., Giovannoli, E., et al., 2009, A&A, 507, 1793
- (76) Pilbratt, G., Reidinger, J., Passvogel, T., et al., 2010, A&A, 518, L1
- (77) Roediger, E., 2009, AN, 330, 888
- (78) Roediger, E., Hensler, G., 2005, A&A, 433, 875
- (79) Roediger, E., Bruggen, M., 2006, MNRAS, 369, 567
- (80) Roediger, E., Bruggen, M., 2007, MNRAS, 380, 1399
- (81) Roediger, E.,Bruggen, M., Simionescu, A., Böhringer, H., Churazov, E., Forman, W., 2011, MNRAS, 413, 2057
- (82) Sancisi, R., Fraternali, F., Oosterloo, T., van der Hulst, T., 2008, A&ARv, 15, 189
- (83) Sandstrom, K., Leroy, A., Walter, F., et al., 2013, ApJ, in press (astroph/1212.1208)
- (84) Sauty, S., Casoli, F., Boselli, A., et al., 2003, A&A, 411, 381
- (85) Schlegel, D., Finkbeiner, D., Davis, M., 1998, ApJ, 500, 525
- (86) Scott, T., Cortese, L., Brinks, E., Bravo-Alfaro, H., Auld, R., Minchin, R., 2012, MNRAS, 419, L19
- (87) Scott, T., Usero, A., Brinks, E., Boselli, A., Cortese, L., Bravo-Alfaro, H., 2013, MNRAS, 429, 221
- (88) Sivanandam, S., Rieke, M., Rieke, G., 2010, ApJ, 717, 147
- (89) Solanes, JM., Manrique, A., Garcia-Gomes, C., Gonzalez-Casado, G., Giovanelli, R., Haynes, M., 2001, ApJ, 548, 97
- (90) Strong, A., Bloemen J., Dame, T., et al., 1988, A&A, 207, 1
- (91) Tonnesen, S., Bryan, G., 2009, ApJ, 694, 789
- (92) Tonnesen, S., Bryan, G., van Gorkom, J., 2007, ApJ, 671, 1434
- (93) Tully, B., 1988, Nearby Galaxy Catalog, Cambridge and New York, Cambridge University Press, 221 p.
- (94) Vollmer, B., Cayatte, V., Boselli, A., Balkowski, C., Duschl, W., 1999, A&A, 349, 411
- (95) Vollmer, B., Cayatte, V., Balkowski, C., Duschl, W., 2001, ApJ, 561, 708
- (96) Vollmer, B., Balkowski, C., Cayatte, V., van Driel, W., Huchtmeier, W., 2004, A&A, 419, 35
- (97) Vollmer, B., Braine, J., Pappalardo, C., Hilly-Blant, P., 2008a, A&A, 491, 455
- (98) Vollmer, B., Soida, M., Chung, A., van Gorkom, J., Otmianowska-Mazur, K., Beck, R., Urbanik, M., Kenney, J., 2008b, A&A, 483, 89
- (99) Vollmer, B., Soida, M., Chung, A., Chemin, L., Braine, J., Boselli, A., Beck, R., 2009, A&A, 496, 669
- (100) Vollmer, B., Soida, M., Braine, J., et al., 2012a, A&A, 537, 143
- (101) Vollmer, B., Wong, O., Braine, J., Chung, A., Kenney, J., 2012b, A&A, 543, 33
- (102) Yagi, M., Yoshida, M., Komiyama, Y., et al., 2010, AJ, 140, 1814
- (103) Young, J., Allen, L., Kenney, J., Lesser, A., Rownd, B., 1996, AJ, 112, 1903
- (104) Zibetti, S., Charlot, S., Rix, F., 2009, MNRAS, 400, 1181
|
|
Notes: linear fit.
: The sample used to fit the vs. relations is composed of all spiral galaxies
() with molecular gas (considering CO non-detections as detections) with and Hi
deficiency parameter 0.4 (black filled dots and triangles in Figs. 1 and 2). The sample indicates the subsample of
galaxies with integarted CO data from Kuno et al. (2007). For this subsample, the galaxies used to fit the
relation are all those with 0.4 (red filled dots in Fig. 3).
: Spearman correlation coefficient.
: Dispersion in the relation.
|
||||||||||||||||||||||||||||||||||||||||||||||||||||||||||||||||||||||||||||||||||||||
Note: scaling relations for unperturbed ( 0.4) spiral galaxies determined considering Hi and CO non-detections as detections.
|
Notes: bisector fit considering CO and Hi non-detections at their upper limit.
: Spearman correlation coefficient.
: Dispersion in the relation.
: Probability that the two variables are correlated.
|
Note: mean values determined considering Hi and CO non-detections at their upper limit.
|