11email: Marcus.Lohr@open.ac.uk22institutetext: Institute of Astronomy, Madingley Road, Cambridge CB3 0HA, UK
Parameters of two low-mass contact eclipsing binaries near the short-period limit
The two objects 1SWASP~J150822.80$-$054236.9 and 1SWASP~J160156.04+202821.6 were initially detected from their SuperWASP archived light curves as candidate eclipsing binaries with periods close to the short-period cut-off of the orbital period distribution of main sequence binaries, at 0.2 d. Here, using INT spectroscopic data, we confirm them as double-lined spectroscopic and eclipsing binaries, in contact configuration. Following modelling of their visual light curves and radial velocity curves, we determine their component and system parameters to precisions between 2 and 11%. The former system contains 1.07 and 0.55 components, with radii of 0.90 and 0.68 respectively; its primary exhibits pulsations with period 1/6 the orbital period of the system. The latter contains 0.86 and 0.57 components, with radii of 0.75 and 0.63 respectively.
Key Words.:
stars: individual: 1SWASP J150822.80054236.9 - stars: individual: 1SWASP J160156.04+202821.6 - binaries: close - binaries: eclipsing - binaries: spectroscopic1 Introduction
The orbital period distribution of main sequence binary stars exhibits a fairly sharp lower limit at around 0.2 d (Rucinski 1992, 2007; Szymański et al. 2001; Paczyński et al. 2006), the cause of which is the subject of ongoing research e.g. Stepień (2006); Stepień & Gazeas (2012); Jiang et al. (2012). However, despite the inherent interest of this region of parameter space, relatively few eclipsing binaries (EB) have been discovered with periods near the cut-off point. This motivated a search of the archive of the SuperWASP project (Wide Angle Search for Planets: Pollacco et al. (2006)) for EB candidates with apparent periods 20 000 s (0.2315 d), reported in Norton et al. (2011). 53 candidates were found, 48 of which were new discoveries at the time. A subsequent search of these candidate EBs for evidence of period change (Lohr et al. 2012) corrected the periods of nine to values slightly greater than 20 000 s, but still 22600 s (0.2616 d). A more rigorous search of the SuperWASP archive (Lohr et al. 2013) then detected 143 candidate EBs with periods 20 000 s, including 97 new discoveries since Norton et al. (2011), and measured significant period changes in 74 candidates.
Here, spectroscopic data allow us to confirm two of these candidates as double-lined EBs in contact configuration (W UMa-type variables): 1SWASP~J150822.80$-$054236.9 (J150822) and 1SWASP~J160156.04+202821.6 (J160156). Both were initially identified in Norton et al. (2011); the period of J150822 was revised upwards to 22469.2 s in Lohr et al. (2012) and so it did not appear in Lohr et al. (2013). We report system and component parameters obtained for these EBs by simultaneous modelling of their SuperWASP light curves and radial velocities. These should be of interest for the study of low-mass dwarfs and W UMa systems in general, and of very short period binaries specifically.
2 Observations
2.1 Photometry


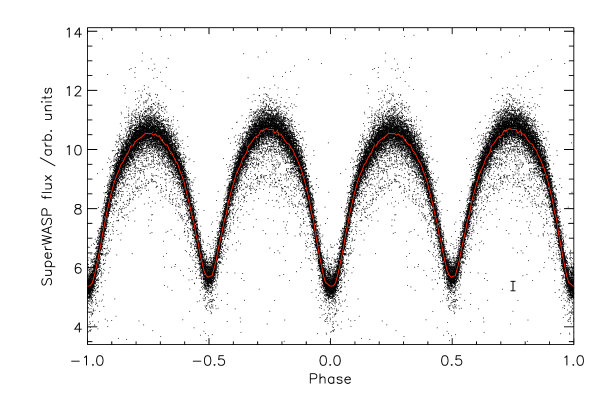
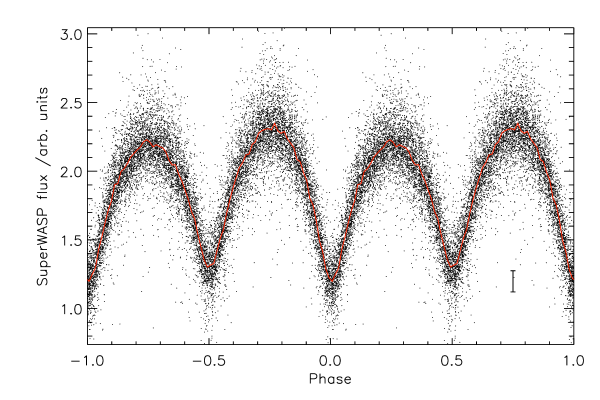
The SuperWASP archive contains 30131 photometric points for J150822, taken between 5 March 2008 and 29 March 2011. For J160156 there are 14651 observations, made between 2 May 2004 and 21 February 2011. Sys-Rem-corrected fluxes (Tamuz et al. 2005; Mazeh et al. 2006) from the 3.5 pixel-radius photometric aperture (the middle of three available apertures) were used to construct the light curves used here, which correspond approximately to the Johnson V band. Periods and period-change measurements were obtained using a custom-written IDL program, as described in Lohr et al. (2013), and the binned averaged phase-folded data produced high-precision phased light curves (Figs. 1 to 4). A small secular period decrease (0.055 s y-1) was measured for J150822, and a slightly larger secular period increase (0.094 s y-1) for J160156; both values are fairly unexceptional for variables of this type (Lohr et al. 2013). The scatter here is comparable to that seen in other SuperWASP light curves for objects of similar magnitude, and we do not believe that either period variation over time, or flux variability caused by surface spots, contribute to it significantly. The uncertainties on the means in the light curves used in subsequent modelling were given by the standard deviation of points in each bin, divided by the square root of the number of observations per bin i.e. .
2.2 Spectroscopy
| HJD | Phase | Primary | Primary | Secondary | Secondary | Continuum flux at |
|---|---|---|---|---|---|---|
| RV (km s-1) | RV (km s-1) | RV (km s-1) | RV (km s-1) | 8500 (arb. units) | ||
| 5997.5934 | 0.302 | a𝑎aa𝑎aRadial velocities unusable. | 2995 | |||
| 5997.5977 | 0.319 | -128 | 24 | 242 | 37 | 2858 |
| 5997.6015 | 0.333 | -117 | 26 | 248 | 34 | 2342 |
| 5997.6406 | 0.484 | 1115 | ||||
| 5997.6444 | 0.498 | 1202 | ||||
| 5997.6482 | 0.513 | 1346 | ||||
| 5997.6756 | 0.618 | 46 | 29 | -203 | 36 | 3682 |
| 5997.6792 | 0.632 | 70 | 38 | -191 | 45 | 3852 |
| 5997.6829 | 0.646 | 109 | 30 | -233 | 27 | 3678 |
| 5997.7080 | 0.743 | 118 | 33 | -265 | 23 | 4034 |
| 5997.7119 | 0.758 | 126 | 31 | -265 | 23 | 3978 |
| 5997.7155 | 0.772 | 118 | 36 | -257 | 24 | 4278 |
| 5998.6826 | 0.490 | 2050 | ||||
| 5998.6863 | 0.504 | 2095 | ||||
| 5998.7272 | 0.661 | 127 | 28 | -221 | 30 | 2196 |
| 5998.7309 | 0.676 | 100 | 37 | -237 | 25 | 3401 |
| 5998.7348 | 0.691 | 126 | 28 | -239 | 23 | 3530 |
| 5998.7571 | 0.776 | 145 | 24 | -243 | 28 | 4294 |
| 5998.7613 | 0.793 | 130 | 29 | -245 | 24 | 4143 |
| 5998.7650 | 0.807 | 139 | 23 | -227 | 31 | 3403 |
| 5999.5733 | 0.915 | 69 | 22 | -117 | 22 | 2737 |
| 5999.5770 | 0.929 | 2689 | ||||
| 5999.5806 | 0.943 | 2459 | ||||
| 5999.6170 | 0.083 | -85 | 18 | 86 | 21 | 2965 |
| 5999.6244 | 0.111 | -86 | 23 | 131 | 26 | 3316 |
| 5999.6316 | 0.139 | -111 | 30 | 190 | 30 | 3613 |
| 5999.6680 | 0.279 | -143 | 24 | 253 | 27 | 4167 |
| 5999.6765 | 0.312 | -147 | 27 | 237 | 27 | 3810 |
| 5999.6850 | 0.344 | -131 | 29 | 235 | 31 | 3744 |
| 5999.7209 | 0.482 | 1954 | ||||
| 5999.7282 | 0.510 | 0 | 13 | 1754 | ||
| 5999.7356 | 0.539 | 2014 | ||||
| 5999.7681 | 0.664 | 116 | 26 | -219 | 27 | 3669 |
| 5999.7719 | 0.678 | 121 | 29 | -224 | 30 | 3737 |
| 5999.7755 | 0.692 | 121 | 27 | -269 | 21 | 3582 |
| 5999.7804 | 0.711 | 138 | 21 | -248 | 25 | 3802 |
| HJD | Phase | Primary | Primary | Secondary | Secondary | Continuum flux at |
|---|---|---|---|---|---|---|
| RV (km s-1) | RV (km s-1) | RV (km s-1) | RV (km s-1) | 8500 (arb. units) | ||
| 5997.6567 | 0.923 | 635 | ||||
| 5997.6605 | 0.940 | 765 | ||||
| 5997.6643 | 0.957 | 702 | ||||
| 5997.6902 | 0.071 | 858 | ||||
| 5997.6939 | 0.087 | 925 | ||||
| 5997.6976 | 0.104 | -68 | 26 | 133 | 27 | 909 |
| 5998.7083 | 0.565 | 594 | ||||
| 5998.7120 | 0.582 | 58 | 20 | -133 | 20 | 637 |
| 5998.7157 | 0.598 | 97 | 20 | -96 | 21 | 628 |
| 5998.7401 | 0.706 | 180 | 23 | -223 | 31 | 1087 |
| 5998.7439 | 0.722 | 169 | 18 | -226 | 22 | 1107 |
| 5998.7499 | 0.749 | 168 | 28 | -218 | 19 | 1102 |
| 5998.7718 | 0.846 | 128 | 22 | -190 | 23 | 1062 |
| 5998.7768 | 0.868 | 135 | 29 | -193 | 22 | 1062 |
| 5998.7806 | 0.884 | 156 | 27 | -126 | 31 | 983 |
| 5998.7851 | 0.904 | 144 | 17 | -30 | 41 | 933 |
| 5999.5888 | 0.452 | 7 | 18 | 410 | ||
| 5999.5968 | 0.487 | 593 | ||||
| 5999.6039 | 0.519 | 584 | ||||
| 5999.6409 | 0.682 | 151 | 25 | -203 | 20 | 1080 |
| 5999.6481 | 0.714 | 141 | 23 | -218 | 19 | 1110 |
| 5999.6553 | 0.746 | 167 | 27 | -219 | 20 | 1143 |
| 5999.6945 | 0.919 | 879 | ||||
| 5999.7033 | 0.958 | 761 | ||||
| 5999.7105 | 0.989 | -8 | 9 | 680 | ||
| 5999.7439 | 0.137 | -125 | 26 | 165 | 27 | 903 |
| 5999.7512 | 0.169 | -142 | 21 | 219 | 23 | 937 |
| 5999.7583 | 0.200 | -150 | 25 | 229 | 26 | 957 |
36 long-slit spectra were obtained for J150822, and 28 for J160156, with the Intermediate Dispersion Spectrograph (IDS) on the 2.5 m Isaac Newton Telescope at La Palma in the Canary Islands. The observations for the two stars were interspersed with each other, and covered three consecutive nights (11-13 March 2012), to optimise phase coverage. Exposures were 300 or 600 s to allow for the short orbital periods involved, and a wavelength range of 7915–9040 was chosen, which covers the Ca II triplet. The RED+2 CCD and R1200R gratings were used, providing a resolution of 0.51 per pixel. S/N values of 40–50 were obtained around quadrature for J150822, and 30–40 for J160156. The spectra were flat-fielded, bias-corrected and optimally extracted using standard IRAF routines, and calibrated using CuArNe arc lamp exposures.
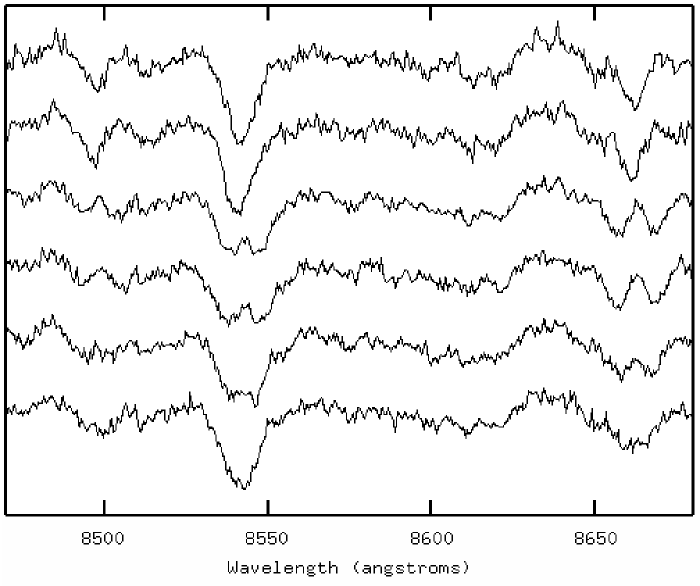
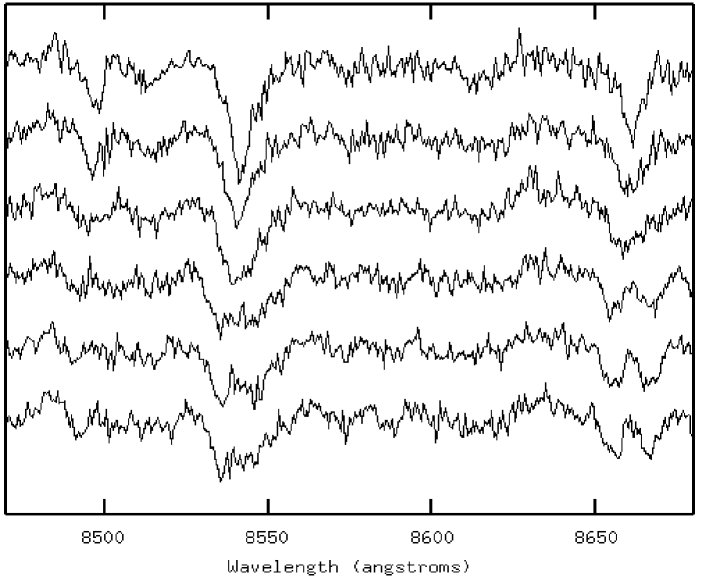
Line splitting was clearly observable by eye (Figs. 5 and 6) and could be used to estimate phase. A suitable synthetic comparison spectrum was then selected by cross-correlation with a phase 0 program spectrum; the best-matching template for both objects had a temperature of 4500 K. Radial velocities were measured by cross-correlation with the template, using the IRAF task FXCOR. Uncertainties were minimized by excluding the broadest Ca II line from consideration. Improved phase determinations were obtained by fitting sinusoidal functions to the RV curves to locate cross-over points corresponding to phases 0 and 0.5.
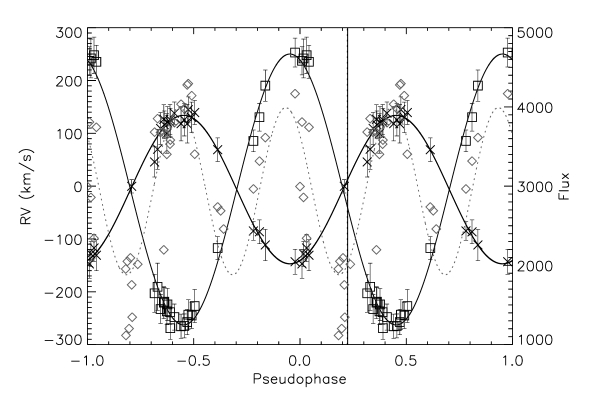
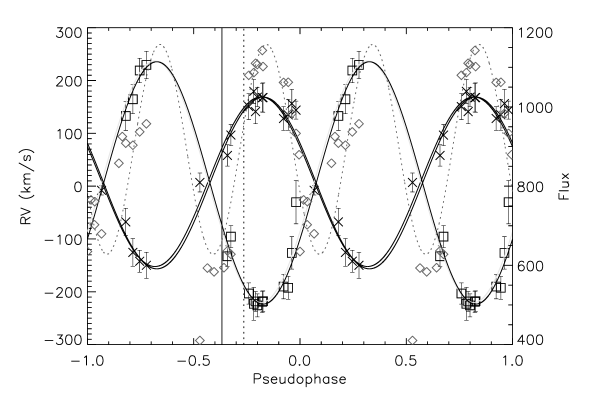
These phasings were then compared with the predictions of the SuperWASP linear and quadratic ephemerides (implying constant periods and secular period change respectively), and with internal simultaneous low-resolution light curves extracted from the spectra themselves (by evaluating a continuum fit at 8500 ), and were found to be substantially self-consistent (Figs. 7 and 8). The divergence between different phase measures is greater for J160156; this is a consequence of its shorter period, more rapid predicted period change, smaller data sets (both photometric and spectroscopic) and longer time gap between the last archived photometry and the spectroscopy. It is notable that in each system the deeper minimum of the light curve corresponds to the eclipse of the secondary, less massive binary component; the SuperWASP light curves were consequently refolded to locate phase 0 at the time of true primary eclipse. The resulting spectroscopic observations and derived quantities are given in Tables 1 and 2. The velocity uncertainties are those obtained with FXCOR; uncertainties in phase (using the sinusoidal fitting described above) are negligible in comparison, and were not included in subsequent modelling.
3 Results
The eclipsing binary modelling software PHOEBE (Prša & Zwitter 2005), built upon the code of Wilson & Devinney (1971), was used to model simultaneously the binned SuperWASP light curves and INT radial velocity curves of the two systems. (The full SuperWASP light curves were also modelled as a final check on the validity of the optima found using binned curves; it would have been prohibitively time-consuming to carry out the full modelling procedure using curves consisting of tens of thousands of data points.) A semi-detached or contact configuration (one or both components overfilling their Roche lobes) was assumed on the basis of the continuous light variation in the light curves, so the Unconstrained mode was used to allow for both possibilities. An approximate shared temperature (which would correspond to the envelope surrounding the components of a W UMa-type system) of K was used for both EBs, because a template with this effective temperature had provided the best match for phase 0 and phase 0.5 spectra during radial velocity determination; this was not varied during modelling due to the relatively low S/N of the spectroscopic data and the limited contribution of temperature to the goodness of model fit.
The shortness of the orbital periods involved constrained us to sub-solar or approximately solar parameters for masses and radii: large stars simply would not fit into the orbits implied, and so trial values of semi-major axis were limited accordingly. No third light was included since in each light curve the deeper eclipse has roughly half the flux of the higher maximum. The details of light curve shape also constrained the possible angles of inclination: J150822 has slightly flattened eclipse bottoms, implying close to 90, while J160156 has more pointed eclipse bottoms, ruling out such a high angle. The shapes of the ‘shoulders’ of the maxima in each case implied Kopal potentials lower than the critical potential at Lagrange point i.e. yielding binary filling factors in (0,1], using Prša’s definition
| (1) |
The radial velocity curve amplitudes alone determined the semi-major axes of the orbits and hence the absolute sizes of the components, while their mass ratios were constrained by both light and radial velocity curves, via the relative eclipse depths and relative amplitudes of primary and secondary components. The light curves provided most of the information needed to determine the optimum angles of inclination and Kopal potentials .
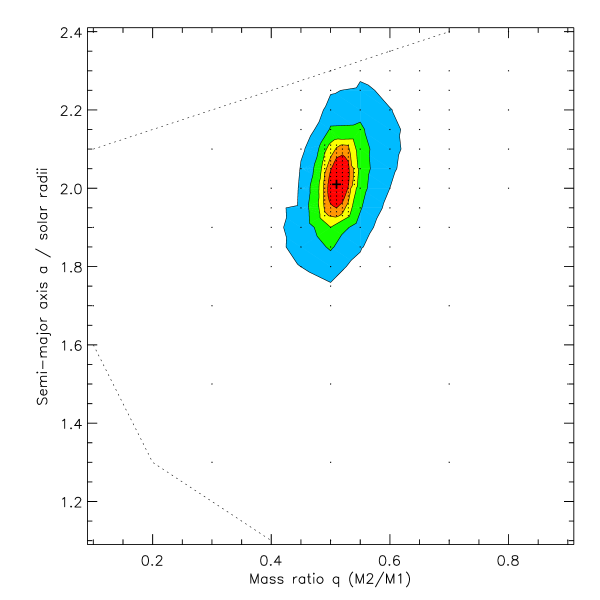
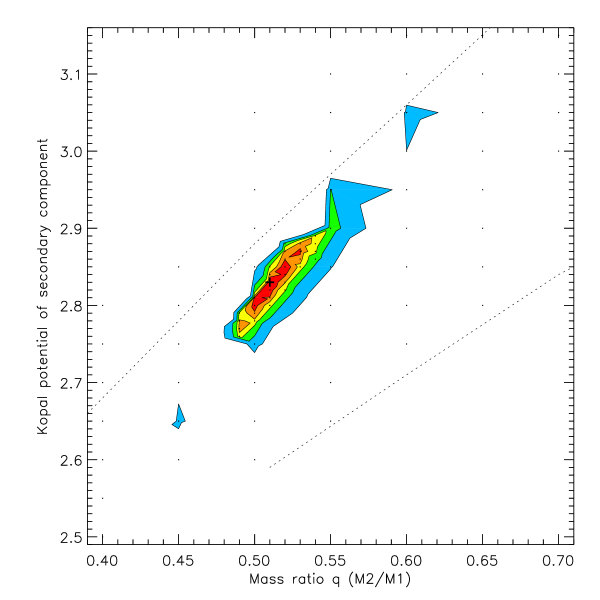
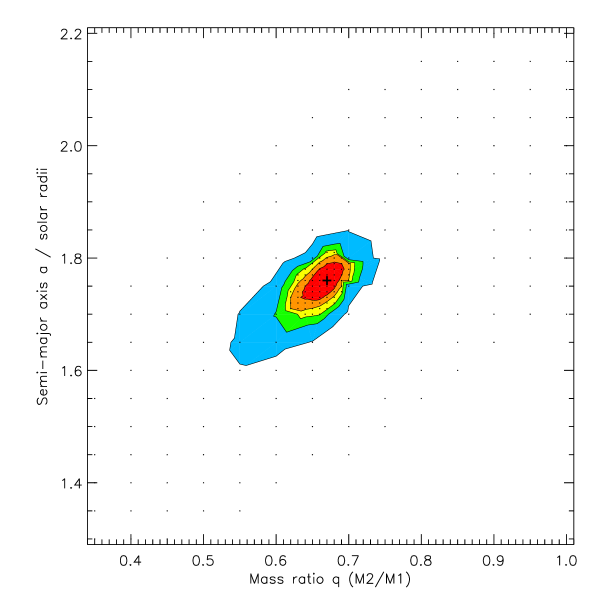
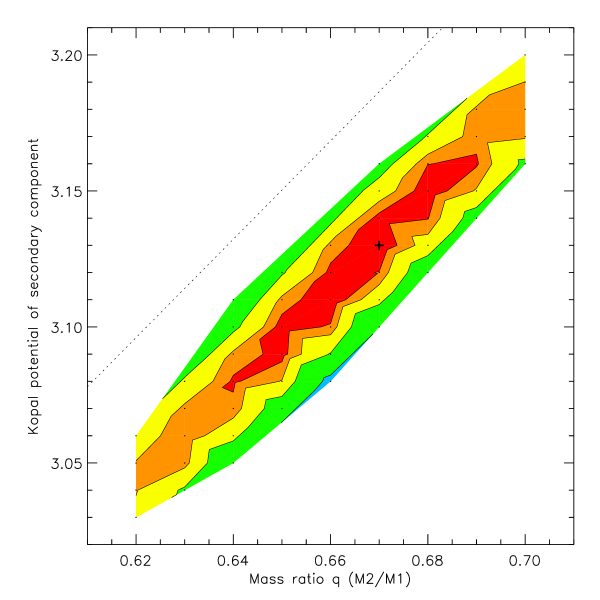
Using these guidelines, and following a similar approach to that of Chew (2010), an initial best-fit solution was found manually for each system, which minimized the combined values for the light curve and the two radial velocity curves. To ensure that these solutions corresponded to global rather than local minima, to explore the correlations between fitting parameters, and to determine realistic uncertainties for the best-fit parameter values, a series of heuristic scans of the five-dimensional parameter space (, , and ) were carried out using the PHOEBE scripter. Initially the entire physically-plausible parameter space was scanned with widely-spaced grids, to ensure that no regions of low values had been missed. The scans were then repeated with decreasing grid spacings, focusing on regions where the difference corresponded to an uncertainty below 3 (Press et al. 2007), until the position of the minimum was determined with accuracy.
The global optima found for the two systems via the scans were very close to those found manually; the combined minimum value for J150822 was 2.36 and for J160156 was 4.72. Since these values were far greater than 1, indicating poor model fits (for reasons explored below), the value at which to set the 1 uncertainty boundary was set with the assistance of a separate series of manually-determined optimal solutions for simulated data sets, with data points randomly perturbed according to their original individual uncertainties. The standard deviations of the parameters, estimated by this method, were comparable in size to the formal uncertainties given by the Wilson-Devinney covariance matrix.
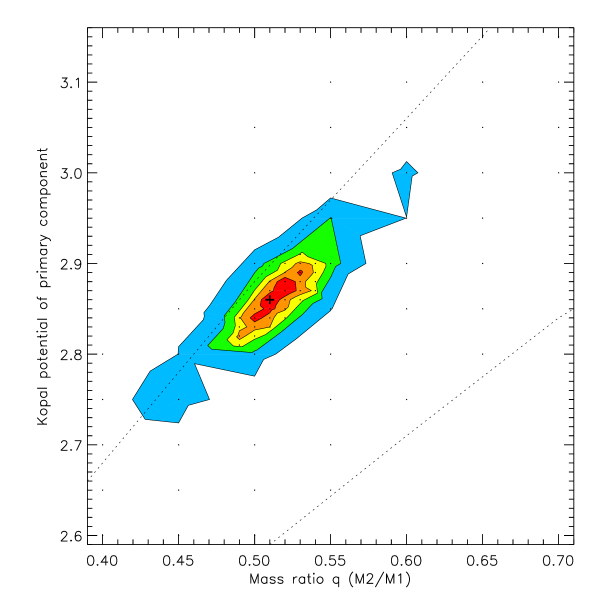
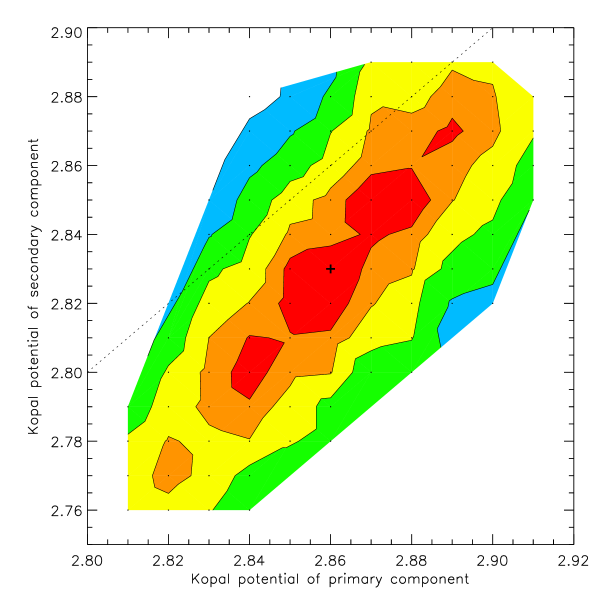
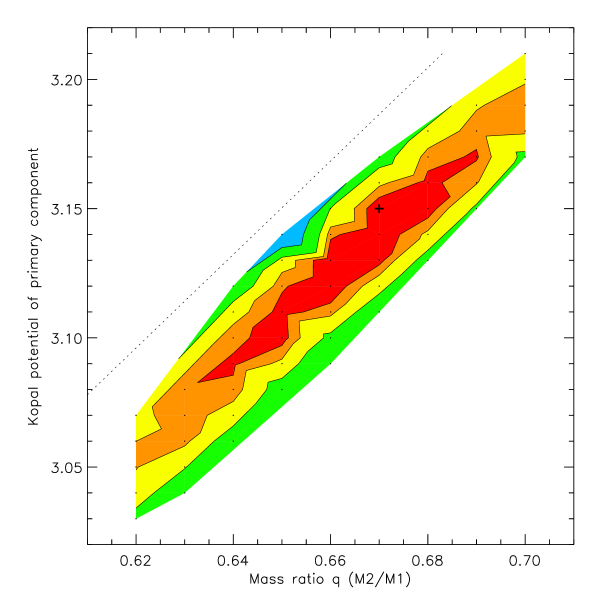
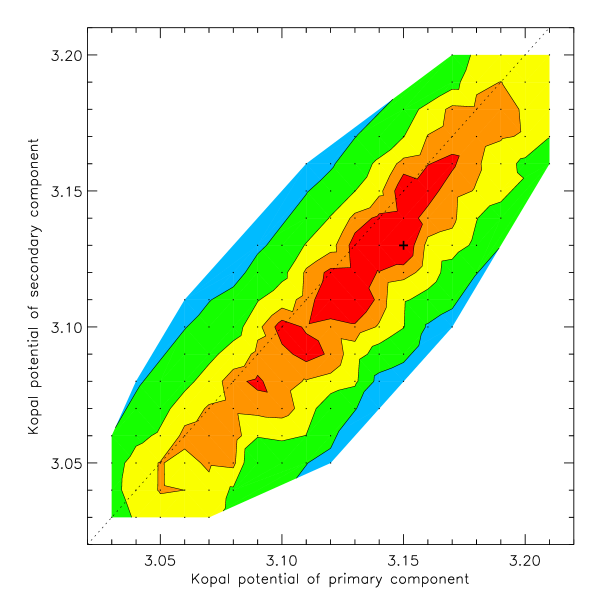
Figs. 9–16 illustrate some of the 10 two-dimensional parameter cross-sections obtained from the scans. The – planes are particularly revealing: both systems have best-fit solutions in which both components overfill their Roche lobes, and where the two potentials are strongly correlated with each other (Figs. 12 and 16), suggesting the components of each system share a common potential within the shared envelope of a contact binary.
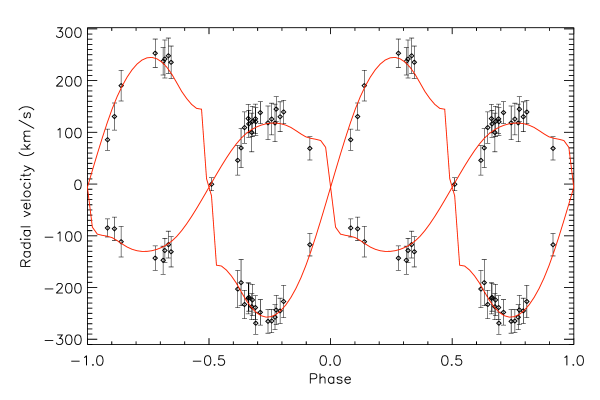
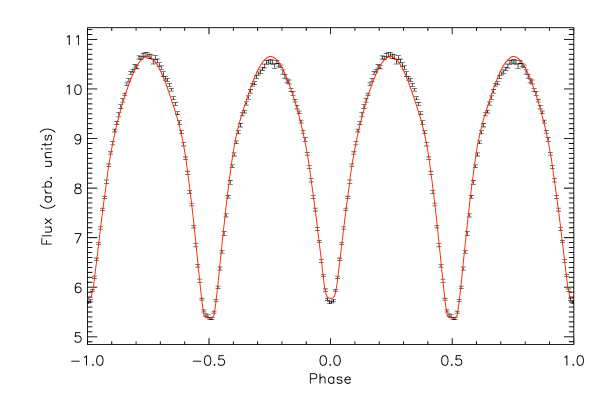
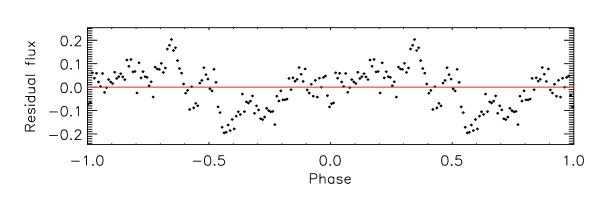
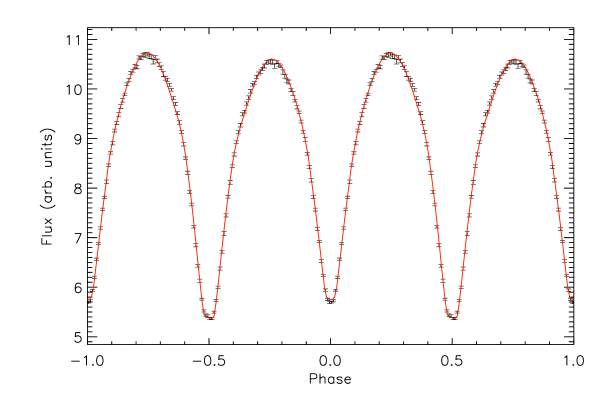
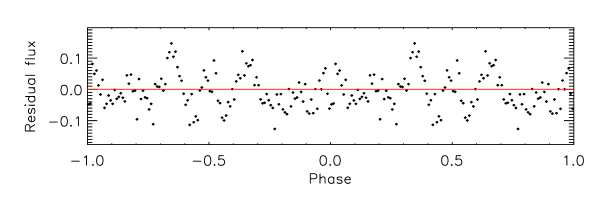
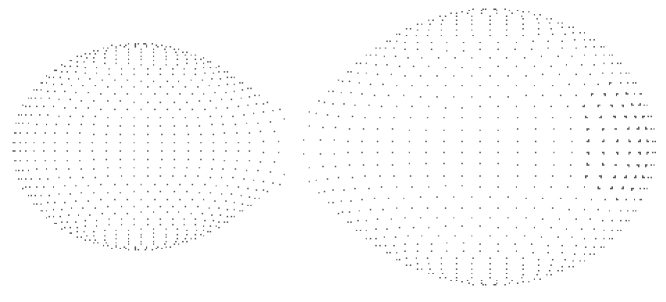
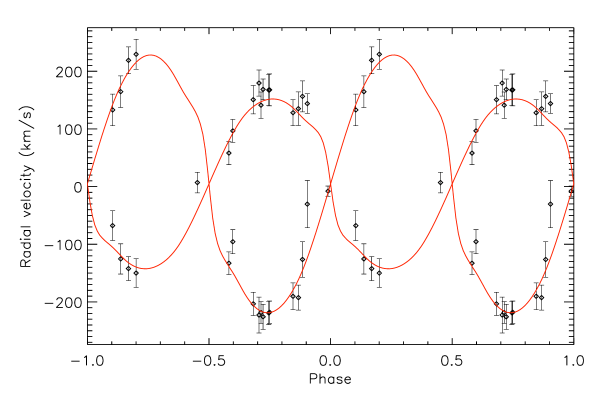
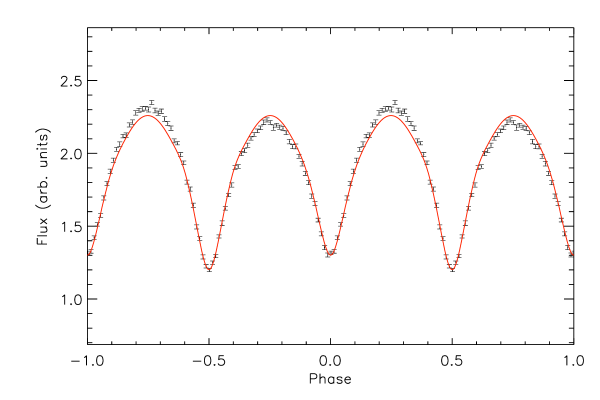

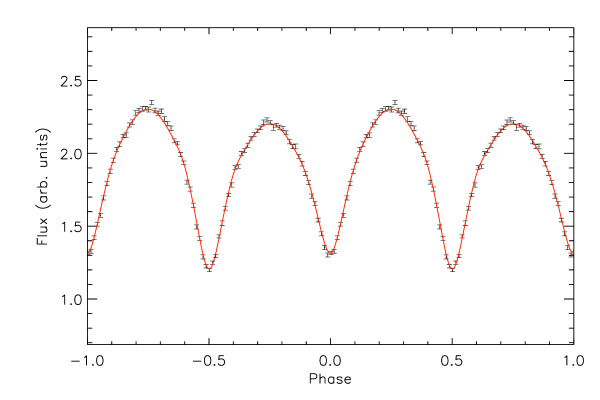
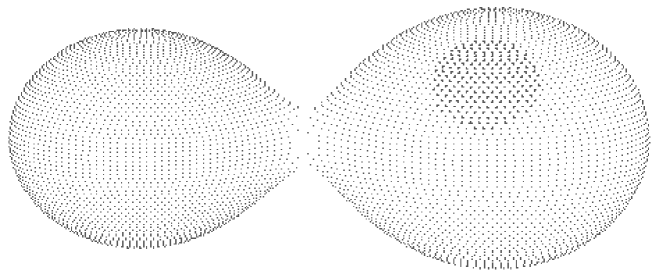
Figs. 17 to 28 show the best-fit PHOEBE models for the two systems. A small Rossiter-McLaughlin effect (Rossiter 1924; McLaughlin 1924) is seen in the model for J150822 in the asymmetry of the radial velocity curves (Fig. 17); this is a consequence of the high angle of inclination. The different heights of maxima visible in both light curves, but most notably in J160156, are most likely attributable to star spots i.e. the O’Connell effect (O’Connell 1951). However, since we lack any direct evidence for the number, size or location of spots (e.g. via Doppler tomography), and being mindful of the additional modelling latitude provided by inclusion of spots, we sought to determine the best-fit model for the light curves without including any spots, and our final stellar parameters result from this model. Figs. 20 and 26 indicate the improvement of fit resulting from adding a single cool spot to the primary component in each system, without altering any other input parameters. Figs. 22 and 28 show the appearance of the modelled spotted systems, which reproduce both the different heights of maxima and the different depths of minima better than the unspotted models can. Addition of further spots could doubtless produce a perfect match of models to light curves, but at the expense of the plausibility of the modelling.
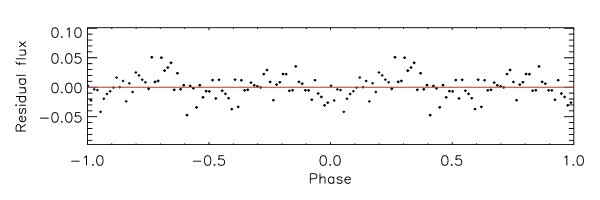
The residuals for the light curve fits reflect these assumed spots in their large-scale sinusoidal deviations (Figs. 19 and 25). However, there are additional clear sinusoidal variations at a smaller scale in the residuals for J150822 (Fig. 21): an oscillation with an amplitude of around 0.1 flux units and a frequency of six cycles per orbit. Presumably these correspond to pulsation of the primary (since they are obscured during primary eclipse), and are locked to the binary orbital period (since they are clearly visible in the folded light curve).
The final best-fit parameters for both systems are given in Table 3. We would emphasise that these parameters are not dependent on the inclusion of spots in the models. The uncertainties on , , and were obtained from the 1 contours in the relevant parameter cross-sections. The uncertainties on the output parameters (masses and radii) are the maximum/minimum values obtainable using parameter combinations falling within these 1 contours.
| J150822 | J160156 | ||
|---|---|---|---|
| Semi-major axis () | |||
| Mass ratio | |||
| COM velocity (km s-1) | |||
| Angle of incl. () | |||
| Kopal potentials | |||
| Filling factor | |||
| Masses () | |||
| Radii () | |||
4 Discussion
These results confirm J150822 and J160156, initially identified as candidate EBs on the basis of light curve shapes alone, as double-lined spectroscopic and eclipsing binaries. From modelling, both systems appear to be composed of late G–early M class dwarfs. J150822 is slightly more massive, with an approximately solar-mass primary and late K secondary; its masses have been determined with a precision of 10% and its radii within 4%. J160156’s components are of more similar mass: a late G or early K primary and a late K or early M secondary; its masses have been found with a precision of 5% and its radii within 2%. Both appear to be W-type systems, in the sense of Binnendijk (1970), in that the less massive component is eclipsed during the deeper minimum.

The contact configuration and likely mass exchange associated with the apparent period changes make it difficult to compare directly the mass-radius relationships of these systems with those collected and discussed in e.g. Torres et al. (2010) (Fig. 2) and Torres (2013) (Fig. 4) for detached binaries containing low-mass components. Fig. 29 therefore compares our results both with those of Torres et al. and of a selection of short-period contact systems collected by Stepień & Gazeas (2012). We may note that, like several other contact systems, the binaries studied here are somewhat discrepant with the Dartmouth model isochrones for solar metallicity (Dotter et al. 2008)222http://stellar.dartmouth.edu/models/. Specifically, the primaries have smaller radii than their masses might suggest, while the secondaries have larger radii than expected. Possibly the primaries’ less dense outer layers have been partially stripped and transferred to the secondaries, leaving denser “cores”. Higher resolution spectroscopy and/or Doppler tomography would be required for confirmation.
5 Conclusions
J150822 and J160156 are established to be spectroscopic double-lined and eclipsing binary systems in contact configuration, composed of low-mass dwarfs. J150822 has been modelled as consisting of 1.07 and 0.55 components (mass ratio 0.51), and J160156 as having 0.86 and 0.57 components (mass ratio 0.67). The primary of J150822 appears to be pulsating with a period 1/6 of the orbital period. Both systems are plausibly undergoing mass transfer; this may be related to the primaries’ radii being smaller, and the secondaries’ radii being larger, than would be typical for single stars with these masses.
The parameters obtained here should contribute to our understanding of low-mass stars and contact binary systems, since relatively few binaries are known with such short orbital periods. We hope to follow up further candidate short-period EBs listed in Lohr et al. (2013) with multi-colour photometry and spectroscopy, with a view to confirming their binary nature. Many of them should be good prospects for full solution, and capable of significantly extending our knowledge of this aspect of the field.
Acknowledgements.
The WASP project is funded and operated by Queen’s University Belfast, the Universities of Keele, St. Andrews and Leicester, the Open University, the Isaac Newton Group, the Instituto de Astrofisica de Canarias, the South African Astronomical Observatory and by STFC. The Isaac Newton Telescope is operated on the island of La Palma by the Isaac Newton Group in the Spanish Observatorio del Roque de los Muchachos of the Instituto de Astrofisica de Canarias. This work was supported by the Science and Technology Funding Council and the Open University. We would like to thank the referee for constructive comments and recommendations which have improved this paper.References
- Binnendijk (1970) Binnendijk, L. 1970, Vistas in Astronomy, 12, 217
- Chew (2010) Chew, Y. G. M. 2010, On the analysis of two low-mass, eclipsing binary systems in the young Orion Nebula cluster (unpublished PhD thesis: Vanderbilt University)
- Dotter et al. (2008) Dotter, A., Chaboyer, B., Jevremović, D., et al. 2008, ApJS, 178, 89
- Jiang et al. (2012) Jiang, D., Han, Z., Ge, H., Yang, L., & Li, L. 2012, MNRAS, 421, 2769
- Lohr et al. (2012) Lohr, M. E., Norton, A. J., Kolb, U. C., et al. 2012, A&A, 542, A124
- Lohr et al. (2013) Lohr, M. E., Norton, A. J., Kolb, U. C., et al. 2013, A&A, 549, A86
- Mazeh et al. (2006) Mazeh, T., Tamuz, O., Zucker, S., et al. 2006, in Tenth Anniversary of 51 Peg-b: Status of and prospects for hot Jupiter studies. Colloquium held at Observatoire de Haute Provence, France, August 22-25, 2005, ed. L. Arnold, F. Bouchy, & C. Moutou (Paris: Frontier Group), 165–172
- McLaughlin (1924) McLaughlin, D. B. 1924, ApJ, 60, 22
- Norton et al. (2011) Norton, A. J., Payne, S. G., Evans, T., et al. 2011, A&A, 528, A90
- O’Connell (1951) O’Connell, D. J. K. 1951, Publications of the Riverview College Observatory, 2, 85
- Paczyński et al. (2006) Paczyński, B., Szczygieł, D. M., Pilecki, B., & Pojmański, G. 2006, MNRAS, 368, 1311
- Pollacco et al. (2006) Pollacco, D. L., Skillen, I., Cameron, A. C., et al. 2006, PASP, 118, 1407
- Press et al. (2007) Press, W. H., Teukolsky, S. A., Vetterling, W. T., & Flannery, B. P. 2007, Numerical Recipes 3rd Edition: The Art of Scientific Computing, 3rd edn. (New York: Cambridge University Press)
- Prša & Zwitter (2005) Prša, A. & Zwitter, T. 2005, ApJ, 628, 426
- Rossiter (1924) Rossiter, R. A. 1924, ApJ, 60, 15
- Rucinski (1992) Rucinski, S. M. 1992, AJ, 103, 960
- Rucinski (2007) Rucinski, S. M. 2007, MNRAS, 382, 393
- Stepień (2006) Stepień, K. 2006, Acta Astron., 56, 347
- Stepień & Gazeas (2012) Stepień, K. & Gazeas, K. 2012, Acta Astron., 62, 153
- Szymański et al. (2001) Szymański, M., Kubiak, M., & Udalski, A. 2001, Acta Astron., 51, 259
- Tamuz et al. (2005) Tamuz, O., Mazeh, T., & Zucker, S. 2005, MNRAS, 356, 1466
- Torres (2013) Torres, G. 2013, Astron. Nachr., 334, 4
- Torres et al. (2010) Torres, G., Andersen, J., & Giménez, A. 2010, A&AR, 18, 67
- Wilson & Devinney (1971) Wilson, R. E. & Devinney, E. J. 1971, ApJ, 166, 605