Bulgeless Galaxies at Intermediate Redshift: Sample Selection, Colour Properties, and the Existence of Powerful AGN
Abstract
We present a catalogue of bulgeless galaxies, which includes 19 225 objects selected in four of the deepest, largest multi-wavelength datasets available – COSMOS, AEGIS, GEMS and GOODS – at intermediate redshift (). The morphological classification was provided by the Advanced Camera for Surveys General Catalogue (ACS-GC), which used publicly available data obtained with the ACS instrument on the Hubble Space Telescope. Rest-frame photometric quantities were derived using kcorrect. We analyse the properties of the sample and the evolution of pure-disc systems with redshift. Very massive [] bulgeless galaxies contribute to % of the total galaxy population number density at , but their number density drops substantially with decreasing redshift. We show that only a negligible fraction of pure discs appear to be quiescent systems, and red sequence bulgeless galaxies show indications of dust-obscured star formation. X-ray catalogues were used to search for X-ray emission within our sample. After visual inspection and detailed parametric morphological fitting we identify 30 AGN that reside in galaxies without a classical bulge. The finding of such peculiar objects at intermediate redshift shows that while AGN growth in merger-free systems is a rare event (0.2% AGN hosts in this sample of bulgeless galaxies), it can indeed happen relatively early in the Universe history.
1 Introduction
One of the cornerstones of modern cosmology is understanding the formation and evolution of galaxies and the relative importance of merger processes. According to Cold Dark Matter (CDM) structure formation models, galaxies form hierarchically: dark matter collapses into halos in the early Universe, which virialise and cluster hierarchically to form large-scale structures. Rotating discs start forming in slowly growing dark matter halos (Fall & Efstathiou 1980) and become the building blocks of galaxies (Cole et al. 2000). In this framework of a merger-dominated Universe, galaxies without a bulge are difficult to produce: the discs will thicken or warp due to interactions between low mass halos (Chambers et al. 2004) or be completely disrupted by major mergers (Koda et al. 2009), leaving behind a classical bulge. Halos that somehow escape or at least avoid major mergers since 3 could, in principle, form bulgeless galaxies, especially if some form of heuristic prescription for stellar feedback is included in the simulations (D’Onghia & Burkert 2004; Robertson et al. 2004), but the simulated disks end up being smaller, denser and having lower angular momentum than the observed ones. However, more recent hydrodynamical simulations of dwarf galaxies show that outflows can prevent the formation of classical merger-driven bulges in low mass systems by expelling most of the low angular momentum gas generated in such events (Brook et al. 2012; Dutton & van den Bosch 2009).
The observed correlations between black hole (BH) mass and host galaxy properties (such as, stellar velocity dispersion, circum-nuclear star formation, mass, and luminosity; see e.g., Kormendy & Richstone 1995; Magorrian et al. 1998; Tremaine et al. 2002; Häring & Rix 2004; Koda et al. 2009; Schawinski et al. 2010) are rarely observed in galaxies with no bulges (Kormendy et al. 2011, hereafter referred as K11), thus suggesting that the formation and evolution of galaxy bulges are linked to the formation and evolution of the host BHs, albeit perhaps differently in early- and late-type objects (Schawinski et al. 2010).
The growth of a BH in a bulgeless galaxy remains difficult to understand in the absence of merger processes. On the other hand, several observations of BHs and AGN in nearby bulgeless galaxies currently indicate that a classical bulge is not a requirement for an (active) nuclear BH: NGC 4395 (Filippenko & Ho 2003; Peterson et al. 2005) is a bulgeless Sm galaxy with a Seyfert 1 spectrum, Pox 52 (Thornton et al. 2008) is a dwarf Seyfert 1 galaxy, Henize 2-10 is the first ever (irregular) dwarf discovered to have a supermassive BH (Reines et al. 2011), whereas NGC 3621, NGC 4178, NGC 3367, NGC 4536, and NGC 4561 (Satyapal et al. 2007; Barth et al. 2009; Satyapal et al. 2009; Secrest et al. 2012; McAlpine et al. 2011; Araya Salvo et al. 2012), are late-type Sd galaxies with AGN activity from low mass black holes. Also, Desroches & Ho (2009) found a high incidence of AGN activity in a sample of late-type spirals observed with Chandra, indicating that BHs can evolve in galaxies with little or no evidence for bulges.
Kormendy et al. (K11) found no correlation between BH and disc masses in a sample of 11 galaxies. Mathur et al. (2012) analysed ten pseudo-bulge Narrow Line Seyfert 1 (NLS 1) galaxies and compared the BH mass to the pseudo-bulge luminosity, finding that the BHs were undermassive compared to the host galaxies. This supports the hypothesis that BHs in pseudo-bulges/disc galaxies are in the growth mode at the present epoch and that this growth is triggered by secular processes. In this context, BHs/AGN found in bulgeless galaxies are thought to be the smallest BHs grown by local processes and are the seeds of the larger merger-grown SMBHs found in massive galaxies (K11).
The Sloan Digital Sky Survey (SDSS) has been used to establish a benchmark for the local Universe (Kautsch et al. 2006) and to investigate the significance of AGN feedback in bulgeless galaxies, including quenching of star formation (Bell 2008; Coelho et al. 2013). Recently, a sample of 13 AGN in bulgeless galaxies with BH masses in the range was selected from the SDSS using visual classification from the Galaxy Zoo (Simmons et al. 2012). The authors showed that significant BH growth can take place in the absence of mergers or violent disc instabilities.
Given the importance of bulgeless galaxies to understand galaxy evolution, a study of these objects at higher redshifts is fundamental. The existence of a set of very deep and high-resolution observations with the Hubble Space Telescope (HST) allows to extend morphological local studies, as those performed with SDSS, to much higher redshifts, and start mapping the evolution of bulgeless galaxies. Here we present a catalogue and a first analysis of such systems at intermediate redshift (), using publicly available data from four of the largest, deepest multi-wavelength surveys: the Cosmological Evolutionary Survey111http://cosmos.astro.caltech.edu (COSMOS; Scoville et al. 2007), the All-wavelength Extended Groth Strip (EGS) International Survey222http://aegis.ucolick.org (AEGIS; Davis et al. 2007), the Galaxy Evolution from Morphology and SEDs (GEMS) survey333http://www.mpia.de/GEMS/gems.htm (Caldwell et al. 2008), and the Great Observatories Origins Deep Survey444http://www.stsci.edu/science/goods/ (GOODS; Dickinson et al. 2003; Giavalisco et al. 2004). The latter survey targets two separate fields, the Hubble Deep Field North (HDF-N, hereafter referred to as GOODS-N) and the Chandra Deep Field South (CDF-S, hereafter referred to as GOODS-S). The HST data for all these fields have been recently assembled by Griffith et al. (2012) into a single homogeneously analysed data-set.
Besides high-resolution optical imaging, these fields also possess very comprehensive multi-wavelength coverage, from X-rays to radio, as well as vast spectroscopic information. The synergy of such a panchromatic data-set offers us the opportunity to investigate the significance of bulgeless galaxies and bulgeless AGN hosts when the Universe was less than one-half of its current age (more than 7 Gyr in the past), an epoch much more active than the current one. This can provide valuable insight into the understanding of the evolutionary path of bulgeless systems within the overall galaxy formation and evolutionary scenario.
The paper is organised as follows: in § 2 and § 3 we describe the data-set and present the derivation of the relevant rest-frame quantities; in § 4 we present the final magnitude-limited () catalogue containing bulgeless galaxies at intermediate redshift (), and investigate the reliability of the adopted morphological classification, as well as the accuracy of the mass estimates. In § 5 an overview of the sample properties, focusing on bulgeless galaxy evolution and on peculiar subsamples, such as red and massive bulgeless galaxies, is provided. In § 6 we present the first systematic search for bulgeless AGN at intermediate redshift, based on X-ray emission, and presenting an accurate analysis of these objects’ morphology. Finally, a summary of this work is given in § 7.
Throughout the article we use H0=71 km s-1 Mpc-1, =0.27 and =0.73 (WMAP7; Larson et al. 2011). All magnitudes are (unless otherwise noted) expressed in the AB system.
2 Sample selection
The present study is based on the Advanced Camera for Surveys (ACS) HST public morphology catalogue, which has been recently assembled by Griffith et al. (2012), merging the largest HST imaging surveys. The catalogue contains a total of 469 501 sources in five sky fields: COSMOS (304 688 sources), AEGIS (70 142 sources), GEMS (59 447 sources), GOODS-S (10 999 sources), and GOODS-N (24 225 sources). This large ACS data-set has been homogeneously analysed using the code Galapagos (Barden et al. 2012), an application that combines object detection with SExtractor (Bertin & Arnouts 1996) and light profile modelling with Galfit (Peng et al. 2002). These data provide the basis to extract precise morphological parameters for the galaxies. A thorough description of the ACS general catalogue (henceforth referred to as the ACS-GC), its contents, additional data products, and details of its construction from HST/ACS images, are given in Griffith et al. (2012). A brief summary of the ACS-GC imaging data is also reported here in Table 1, giving central coordinates for the surveys, survey size, filters and pixel scales. In the following, we outline those details which are pertinent to the context of the present investigation.
2.1 Imaging and morphology data
The morphological classification was derived from the analysis of the surface brightness profiles, obtained at the reddest filter image available for each field, namely for the COSMOS and EGS fields, for the GEMS + GOODS-S fields, and for the GOODS-N field. The light distribution of the galaxies was analysed by fitting a single Sérsic profile (Sérsic 1968):
| (1) |
where the Sérsic index describes the shape of the light profile, is the effective radius of the galaxy, and is a positive parameter that is coupled to , such that half of the total flux is always within . An index corresponds to an exponential profile of a typical pure-disc galaxy, whereas corresponds to the de Vancouleurs’ profile of elliptical or spheroidal galaxies.
In order to improve the robustness of the morphology selection, we rejected the faintest galaxies by imposing a magnitude cut, , in the filter considered for each field (see above). To avoid sources with very little or no morphological information, we removed point sources from the sample in the following way. Pixel sizes in the adopted surveys range from 0.05 arcsec for COSMOS (ACS/Wide Field Channel), to 0.03 arcsec (ACS/High Resolution Channel) for AEGIS, GEMS and GOODS. For an average ACS PSF of 0.075 arcsec, point-like sources occupy just over one to two pixels. We thus discarded catalogue entries with a half-light radius smaller than 0.15 arcsec (two times the PSF). We further discarded all sources with a axis ratio less than 0.5 (equivalent to inclinations larger than 60 deg), in order to minimise the effects of dust extinction on galaxy colours. At this stage the galaxy sample contains 78 830 sources.
It should be considered that galaxy appearance may depend on the rest-frame wavelength at which it is observed, thus comparison of the morphology of galaxies observed at different redshift or through different filters should be treated with additional care. Given the redshift interval under study () and the filters adopted, we are sampling a rest-frame range of 3900–6100 Å, where the morphological -correction is found to be not significant for most galaxies. This has been pointed out in the detailed COSMOS morphological study of Scarlata et al. (2007) (see also, detailed discussions in Lotz et al. 2004; Cassata et al. 2005).
2.2 Redshift data
The ACS-GC contains spectroscopic and photometric redshifts from different sources, as summarised in the following (see Griffith et al. 2012, for details).
-
•
COSMOS: spectroscopic redshifts are provided from the VIMOS/VLT zCOSMOS survey555http://archive.eso.org/cms/eso-data/data-packages/zcosmos-data-release-dr2/ (Lilly et al. 2007). This data release provides a classification for the quality of the spectroscopic measurements: in the present work we considered classes 3 and 4 (very secure redshifts, ), class 2 (probable redshift, ), and class 9 (one identified line, high photo- consistency) as reliable, whereas other redshift classes were discarded. Photometric redshifts () are from the COSMOS public catalogue (Ilbert et al. 2009), and are based on 30-band photometry, which spans the wavelength range from the ultraviolet to the mid-infrared.
-
•
AEGIS: the ACS catalogue provides spectroscopic redshifts from the Deep Extragalactic Evolutionary probe, DEEP2666http://deep.berkeley.edu/DR3/dr3.primer.html, obtained with DEIMOS on Keck (Davis et al. 2003, 2007). Following DEEP2 team’s recommendations, only the entries with redshift quality () greater than or equal to 3 () were treated as having a reliable redshift measurement. Sources having lower redshift quality were discarded. The catalogue also contains photometric redshifts, obtained from the CFHT/MEGACAM deep multi-colour data comprising 11 bands (Ilbert et al. 2006).
-
•
GEMS + GOODS-S: spectroscopic redshifts are provided from various sources, mostly obtained with ESO facilities (see Table 1 of Griffith et al. 2012). We retained redshift entries labelled with the quality flags 4 and 3 (high and good quality, respectively). The photometric redshifts () for GEMS are from the COMBO-17 survey777http://www.mpia-hd.mpg.de/COMBO/combo_CDFSpublic.html (Wolf et al. 2004, 2008), whereas for the GOODS-S field we merged the relevant section of the COMBO-17 catalogue with that of the latest redshift release of Dahlen et al. (2010), which comprises photometric redshifts derived from the 12-band HST/ACS, VLT/VIMOS, VLT/ISAAC, and Spitzer photometry data.
-
•
GOODS-N: the ACS catalogue contains spectroscopic redshifts from Barger et al. (2008) and from the GOODS-N-ALL spectroscopic survey888http://tkserver.keck.hawaii.edu/tksurvey/data_products/goods_desc.html, which includes the Team Keck Treasury Redshift Survey (TKRS, Wirth et al. 2004), and the Cowie et al. (2004) survey. As spectroscopic redshift quality metrics are not available for these data, they are all considered as reliable. As for the photometric redshifts, we merged the catalogue entries from Bundy et al. (2009) (6 bands) with the source redshifts of Kajisawa et al. (2011) (11 bands), selected from the Subaru/MOIRCS near-infrared data.
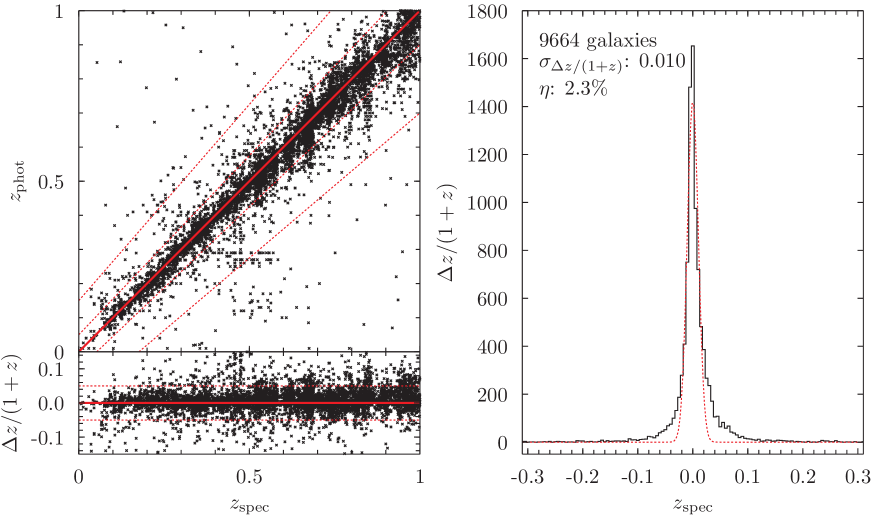
Given that we assembled redshift data from various sources, it is useful to review the overall photo- quality of the galaxies entering our sample through comparison with the available spec-. If , we can estimate the redshift accuracy from , using the normalized median absolute deviation (NMAD; Hoaglin et al. 1983), defined as . The NMAD is directly comparable to other works, which quote the quantity . This dispersion estimate is robust with respect to “catastrophic errors” (i.e., objects with ), whose percentage is denoted by . Figure 1 (left panel) shows the comparison between and for the 9 664 galaxies (all fields) with apparent magnitude and . We obtain an accuracy of for the photometric redshifts, with a percentage of “catastrophic” failures of 2.3%.
For each field, all the available redshift data-sets were merged together: whenever available, a “reliable” spectroscopic redshift value was used, while for the remainder of the sample, photometric redshifts were instead adopted.
3 Ancillary data-sets
In order to allow for a detailed characterisation of the selected galaxies, and in particular to obtain galaxy mass estimates from optical-to-NIR spectral energy distribution (SED) fits to the rest-frame -corrected magnitudes, several multi-wavelength data-sets were also assembled, as detailed below.
3.1 Optical, UV and Near-infrared surveys
3.1.1 COSMOS
The COSMOS photometric data were taken from the publicly available COSMOS Intermediate and Broad-Band Photometric catalogue999http://irsa.ipac.caltech.edu/data/COSMOS/gator_docs/cosmos_ib_colDescriptions.html, the UltraVISTA Survey Data Release 1 (McCracken et al. 2012)101010http://www.eso.org/sci/observing/phase3/data_releases/ultravista_dr1.html and Spitzer IRAC bands 1–2 (3.6 and 4.5 m) data from the S-COSMOS public catalogue111111http://irsa.ipac.caltech.edu/data/COSMOS/gator_docs/scosmos_irac_colDescriptions.html (Sanders et al. 2007).
The COSMOS catalogue comprises: ultraviolet data from GALEX and CFHT/-band imaging; in the optical, the ACS/-band data and the COSMOS-21 survey on Subaru (Taniguchi et al. 2007), including six broad-band ( , , , , , ), 12 medium-band (IA427, IA464, IA484, IA505, IA527, IA574, IA624, IA679, IA709, IA738, IA767, IA827) and two narrow-band (NB711, NB816) filters. Total magnitudes were obtained from the corresponding aperture values by applying the recommended aperture corrections. Only reliable photometric measurements were considered, i.e., data with bad pixel band mask flags different than zero were discarded. Recommended photometric offsets (Ilbert et al. 2009) and galactic extinction corrections (Capak et al. 2007) were also applied.
In the near-infrared, we used the VIRCAM/-, -, -, and -bands imaging data from the UltraVISTA survey and Spitzer IRAC bands 1–2 (3.6 and 4.5 m) data from the S-COSMOS. SExtractor “auto” (or Kron-like) magnitudes were used for near-infrared UltraVISTA data, whereas IRAC channels 1–2 total magnitudes were calculated from the aperture-corrected fluxes of the S-COSMOS data release. Unreliable flux entries (e.g., close to bright stars or close to the image margins) were discarded.
3.1.2 AEGIS
For the AEGIS field, the following data were considered: GALEX far-ultraviolet and near-ultraviolet data from the EGS multi-wavelength data-set121212http://www.galex.caltech.edu/researcher/techdoc-ch5a.html (Davis et al. 2007), HST/ACS - and -band photometry131313http://aegis.ucolick.org/acs_datasets.html (Lotz et al. 2008), CFH12K -, - and -band photometry141414http://deep.berkeley.edu/DR1/dr1.primer.html (Coil et al. 2004), CFHT Megacam -, -, -, - and -band photometry151515http://www3.cadc-ccda.hia-iha.nrc-cnrc.gc.ca/community/CFHTLS-SG/docs/cfhtls.html (Gwyn 2008), Palomar/WIRC - and -band data161616http://www.astro.caltech.edu/AEGIS/ (Bundy et al. 2006) and Spitzer IRAC bands 1–2 (3.6 and 4.5 m) data171717http://www.cfa.harvard.edu/irac/egs/ (Barmby et al. 2008). Together, these datasets provide up to 15 bands for spectral energy distribution analysis.
3.1.3 GEMS
GEMS sources were analysed using the optical multi-band photometry from the COMBO-17 survey (Wolf et al. 2004, 2008), which provides observations in 17 optical filters in the nm wavelength range, obtained with the Wide Field Imager at the MPG/ESO 2.2-m telescope181818See http://www.mpia.de/COMBO/combo_filters.html for a comprehensive description of the filter set. Aperture-corrected photon fluxes were considered in the analysis.
3.1.4 GOODS-S
For the GOODS-S sources we used a 12-band selection of the high quality multi-wavelength data of GOODS-MUSIC191919http://cdsarc.u-strasbg.fr/viz-bin/qcat?J/A+A/449/951 (Multi-wavelength Southern Infrared catalogue; Grazian et al. 2006). This includes -band data from the 2.2 ESO and VLT/VIMOS, HST/ACS , , , and filters, the VLT data, as well as the 3.6 and 4.5 m Spitzer data. MUSIC provides SExtractor “auto” (or Kron) magnitudes for the ACS images, whereas for ground-based and Spitzer data, reliable estimates of the total magnitudes were retrieved through PSF-matching.
3.1.5 GOODS-N
Optical photometric data for the GOODS-N field (Giavalisco et al. 2004) were taken from the GOODS r2.0z202020http://archive.stsci.edu/pub/hlsp/goods/v2/h_goods_v2.0_rdm.html ACS multi-band source catalogue and, at longer wavelengths, from the WIRCam ultra-deep catalogue of GOODS-N (Wang et al. 2010). We thus considered a 7-band catalogue, which comprises the -, -, -, and -filter data, plus - and IRAC 1–2 bands (3.6 and 4.5 m). SExtractor “best” and “auto” magnitudes were chosen for the visible bands and data, respectively. The 3.6 m and 4.5 m fluxes derived by Wang et al. (2010) were instead obtained by a deconvolution procedure based on a image prior, which is expected to deliver highly accurate near-infrared and mid-infrared colours.
3.2 Mid-IR surveys
Spitzer Space Telescope mid-infrared data were used to evaluate star-forming rates (SFRs). MIPS 24 m public catalogues are available for COSMOS (S-COSMOS GO2 and GO3 releases212121http://irsa.ipac.caltech.edu/data/COSMOS/gator_docs/scosmos_mips_24_go3_colDescriptions.html Frayer et al. 2009) and for AEGIS (Barro et al. 2011), while for GOODS-S/GEMS fields we used a catalogue of sources extracted from FIDEL 24 image (v0.5) of the Extended CDFS (6 arcsec PSF matched photometry, X.Z. Zheng, in preparation).
3.3 X-ray catalogues
X-ray surveys have targeted areas within the fields presented in our study. Given the relevance of those data for the detection of AGN, we have also assembled the available public data-sets existing in these regions, namely:
- •
- •
-
•
The catalogues of the 2 Ms Chandra Deep Field-North (CDF-N, Alexander et al. 2003), with a total of 503 detections, the 4 Ms Chandra Deep Field-South (CDF-S, Xue et al. 2011), which contains 776 sources, and also the wider coverage 1 Ms Extended Chandra Deep Field-South (E-CDF-S, Lehmer et al. 2005), with 795 sources.
4 The final catalogue of bulgeless galaxies
After having assembled the various data-sets, we have obtained a homogeneous sample of rest-frame ultraviolet to NIR magnitudes for all galaxies by using the publicly available kcorrect code (version v4_2)222222available at http://howdy.physics.nyu.edu/index.php/Kcorrect. described in Blanton & Roweis (2007). kcorrect is designed to extract the most physically realisable SED by using linear combinations of five SEDs that are characteristic of physical states of galaxies, from intense starburst to quiescent objects. Also, the implementation of the code makes it particularly suitable for modelling optical and near-infrared observations in the redshift range . The galaxy templates are based on the Bruzual & Charlot (2003) stellar evolution synthesis models and, together with rest-frame magnitudes, this tool also provides estimates of the stellar mass-to-light ratio (see § 4.2). kcorrect seeks the best fit to each source photometry using a linear combination of five spectral templates , which are, in turn, derived by non-negative matrix factorisation (NMF) of 485 basis templates spanning grids of metallicities () and ages (1 Myr 13.75 Gyr), with three choices of dust models (no extinction, Milky Way-, and Small Magellanic Cloud-type extinction). Thirty-five templates of line emission from the ionised gas (MAPPING-III, Kewley et al. 2001) are also included in the model. -corrections were calculated for all entries of our sample (irrespective of ), which have both and at least five photometric detections.
We thus obtained rest-frame absolute magnitudes for all objects in our sample. For the objects lacking one or more photometric data-points, rest-frame absolute quantities have been derived directly from the fitted SEDs. We have then generated a homogeneous 11-filter data-set comprising: GALEX far-ultraviolet, near-ultraviolet, Johnson’s , , , , SDSS , , , Vircam232323VIRCAM is a wide field imager for survey mounted on the VISTA telescope. See http://www.eso.org/sci/facilities/paranal/instruments/vircam/inst/ for more information on the filter set. and bands. The reduced of each SED fit is retained in the final catalogue.
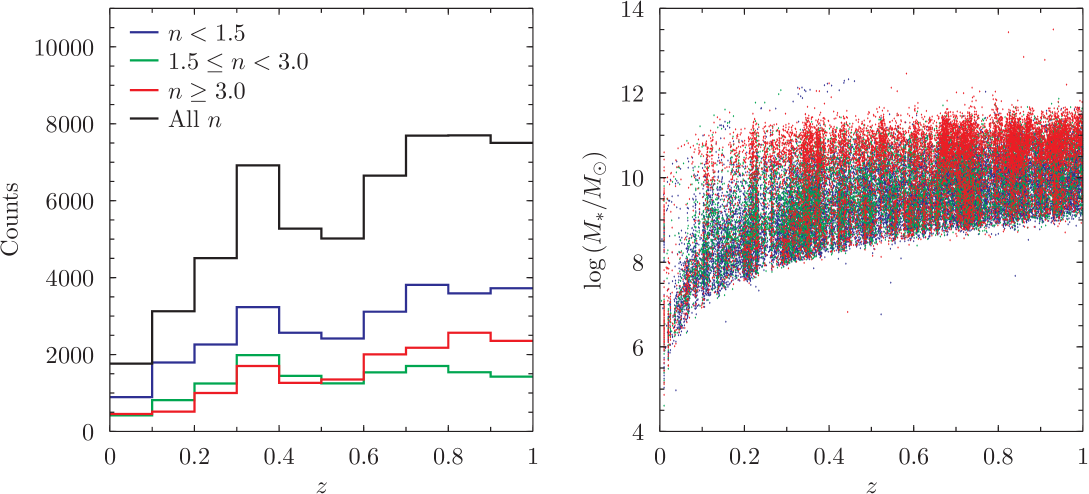
A definition of was applied to select galaxies with little or no contribution of the bulge to the light profile (bulgeless galaxies; Gadotti 2009). As control samples we also selected galaxies with different morphological properties, adopting the following criteria: corresponding to disc galaxies with an increasingly prominent bulge component, and for bulge-dominated galaxies. These samples were used to test the morphological evolutionary scenarios discussed in recent literature (e.g., Pannella et al. 2009; Oesch et al. 2010). A summary of the final sample composition is reported in Table 2. The redshift distribution of the galaxy sample including all the morphological types is shown in the left panel of Figure 2. In the right panel we show the distribution of galaxy stellar masses as a function of redshift.
In summary, we have created a magnitude-limited (, in the reddest available HST band, 7750 to 8500 Å), low-inclination, point-source free, -corrected galaxy catalogue for five fields (COSMOS, AEGIS, GOODS-S, GEMS, and GOODS-N) with robust intermediate () redshift measurements (photometric and spectroscopic) and reliable morphological data, containing a total of bulgeless galaxies out of sources. A conservative estimate for the mass completeness of this catalogue, considering the mass of the model SED used by kcorrect with the highest mass-to-light ratio, results in a minimum measurable stellar mass of at , and at .
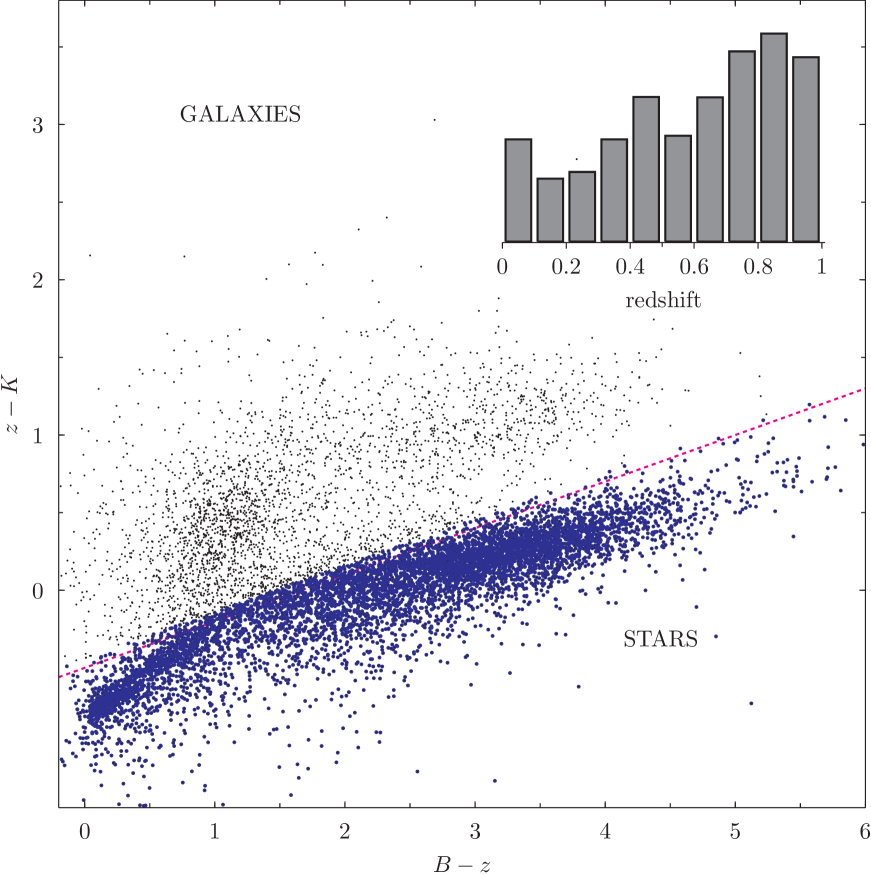
As mentioned in § 2.1, we adopted a filtering criterion to exclude point sources from the final galaxy sample in order to reduce the contamination produced by spurious morphological classification. This led us to reject 9 049 sources in the redshift interval , corresponding to 23% of the sample size. Due to the lack of reliable morphology, these missing objects might potentially alter the content of the catalogue in a not well predictable way. We thus inspected the point-source sample to asses its nature and to estimate the magnitude of the potential biases produced in the galaxy-type class analysis. Figure 3 shows the versus colour–colour plot of 9 979 compact source at . In the plot, stars are segregated in the region defined by the relation (e.g., Daddi et al. 2004) and can be efficiently separated from galaxies. Blue symbols in Figure 3 label the 7 015 stars that can be identified using this method, whereas the black dots located in the upper part of the plane (2 964 objects, 30%) are likely to be small size galaxies that we ultimately discarded from our morphological catalogue. This test indicates that the adopted point-source rejection criterion led at most to a 7% decrement of the magnitude-limited galaxy sample in the interval . The neglected population shows only a mild redshift dependence (see the inset of Figure 3), thus we are thus confident that the main results of this work are not significantly affected.
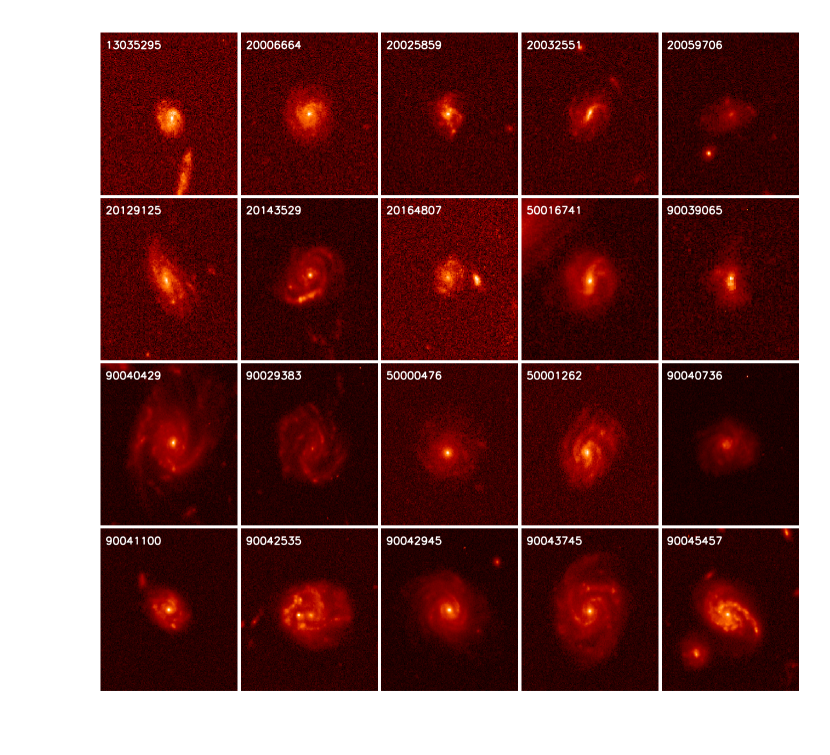
As an example of the catalogue content, we show in Figure 4 sample cutouts of selected bulgeless galaxies spanning the full redshift range and the stellar mass interval. The catalogue of the absolute magnitudes, including morphological information and stellar mass estimates analysed in this work is made publicly accessible at the following URL: http://www.oal.ul.pt/jafonso/Bulgeless
4.1 Reliability of the morphological classification
One of the goals of this work is the selection of a reliable sample of intermediate redshift galaxies having very little or no contribution from a bulge to their light profile. The sample was homogeneously assembled from the imaging data of four different HST/ACS fields, and the morphological classification relied entirely on an automated single-component parametric-fit method. Due to the large content of the sample (40 000 objects), no extensive visual confirmation of the estimated morphology is feasible. Nevertheless, it is important to assess the reliability of the bulgeless classification of our sample through comparison with some independent analysis and a careful consideration of the different sources of uncertainty.
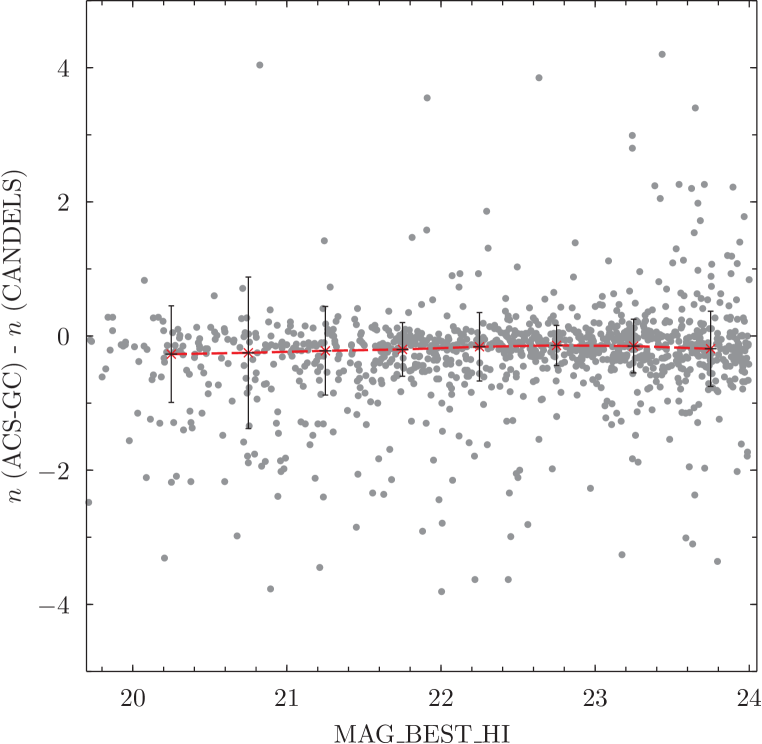
First of all, to assess the wavelength dependence of galaxy morphology, we cross-checked our ACS-GC Galfit classification with the results of a similar structural analysis performed by Wuyts et al. (2011) on GOODS-S sources spanning using CANDELS data. The results of comparison are shown in Figure 5. In spite of the large rest-frame wavelength difference probed by the two surveys, the comparison between the two sets of Sérsic index is fair, and the systematic discrepancies are limited to a few percent over the entire magnitude interval covered by our sample.
Secondly, we evaluated the overall reliability of our Galfit-based morphologies through the comparison to a method based on different classification criteria. In Scarlata et al. (2007), a sample of 56 000 galaxies in COSMOS was the subject of a detailed morphological study, adopting the Zurich Estimator of Structural Types (ZEST), a sofisticated algorithm that uses a combination of non-parametric and parametric quantification of galaxy structure. Its classification scheme comprises type 1 (spheroids with no visible disc), type 2 (disc galaxies), and type 3 (irregular) galaxies. A “bulgeness” index is also provided for type 2 disc galaxies, which coarsely correlates with bulge-to-disc ratio: it ranges from pure disk galaxies (type 2.3) to bulge-dominated discs (type 2.0). Since their analysis was also performed on the ACS COSMOS images, the comparison with our Sérsic-index based morphological classification presented here is straightforward.
We cross-matched the publicly available Zurich morphology catalogue242424http://irsa.ipac.caltech.edu/data/COSMOS/datasets.html with our COSMOS sub-sample, obtaining 30 104 galaxies with both a Galfit-derived Sérsic index and a ZEST classification. The numerical results of this comparison split by ZEST classes are shown in Table 3. We found that 13 073 out of 13 680 galaxies (96%) of our bulgeless () sample are classified as having little or no bulge contribution in ZEST (types 2.2, 2.3, and 3.0), 570 (4%) are classified as intermediate disc galaxies (type 2.1), whereas a mere 37 objects (0.2%) are considered as bulge-dominated in ZEST (type 1.0 and 2.0). This comparison indicates that our bulgeless sample might have a 5% contamination by misclassified bulge-dominated objects. This error should be summed in quadrature to the uncertainty due to the point-source rejection ( 7% see § 4) to yield a conservative overall uncertainty of 8% in the morphological classification of the bulgeless sample.
Not surprisingly, the agreement between our “bulgy” defined sample and the ZEST spheroidal-type classification is only moderate. ZEST type 1.0 and 2.0 collect 4 562 out of 9 494 objects corresponding to 48%, while 2 760 further galaxies (29%) are classifies as intermediate type 2.1 (disc with prominent bulges). It should be noted that the ZEST classes 1.0 and 2.0 mostly include classical spheroidal objects whose surface brightness is best reproduced by De Vaucouleurs’ profile with . On the other hand, the criterion we adopted to define the “bulgy” sample is broader and it is expected to include more objects having a significant disc component. Given that this study is focused on bulgeless object, this comparison provides a confirmation of the methodology used, i.e., that the Sérsic index criterion has a good reliability in selecting galaxies with little bulge contribution.
4.2 Accuracy of mass estimates
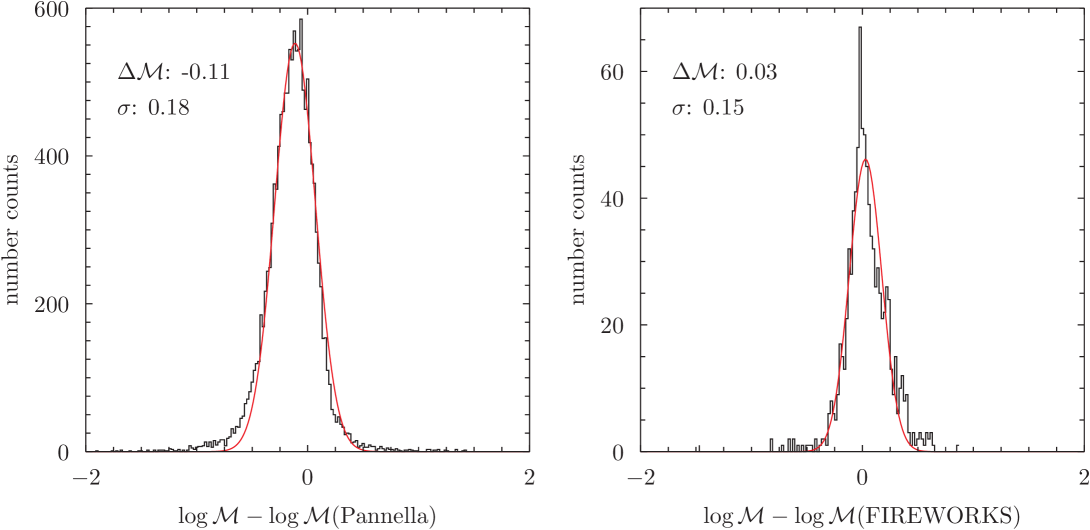
The overall view in the literature (e.g., Bell & de Jong 2001; Drory et al. 2004; Muzzin et al. 2009; Hainline et al. 2011) is that uncertainties in the various assumptions (i.e., redshift, initial mass function, stellar population synthesis model (SPS), star-formation history, dust extinction etc.) imply an overall conservative uncertainty of up to a 2–3 factor (0.2–0.5 dex) for each individual mass estimate. Therefore, we compared our kcorrect results with those independently presented by Pannella et al. (2009) for COSMOS and by the FIREWORKS team (Marchesini et al. 2009) for GOODS-S. The comparison of the stellar masses is shown in Figure 6. All three methods employ the Bruzual & Charlot (2003) SPS model. The FIREWORKS mass determinations closely match our kcorrect-derived values, whereas those of Pannella et al. (2009) are 0.11 dex larger, on average, which is within the range of uncertainties referred by these authors. In both cases, the scatter is less than 0.2 dex, still within the overall uncertainty referred above.
5 Bulgeless galaxy properties
5.1 Colour evolution at intermediate redshift
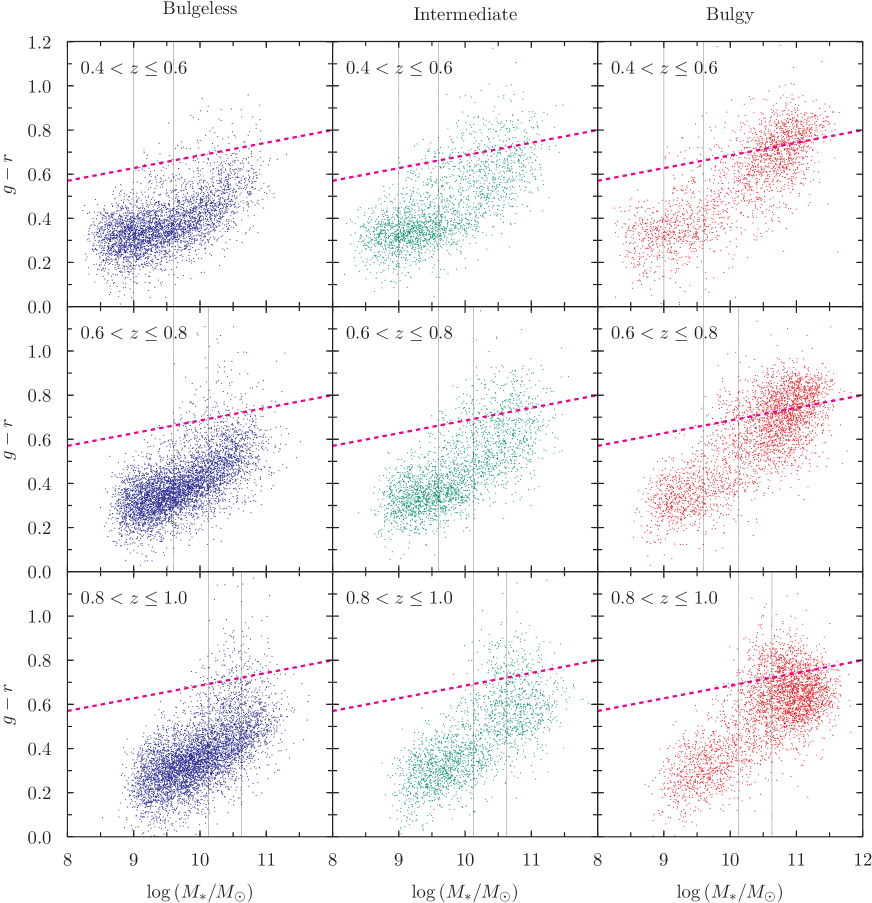
Figure 7 shows the rest-frame colour as a function of mass, redshift, and morphological classification. Three redshift ranges are considered (row-wise): , , and . The oblique dashed line represents the red sequence, defined as by Bell (2008) in the SDSS sample: .
The left-hand panels show the colour-mass properties of the bulgeless sample, which is the goal of the present investigation. The bulgeless population at all redshifts exhibits a striking segregation at bluer colours compared to the other morphological types, with few objects extending beyond the red sequence line. The properties of the bulgeless sample are discussed in more details in § 5.2 and § 5.3.
Bulge-dominated galaxies (, right panels of Figure 7), are mostly located in two regions in the colour–mass diagram, with a clear segregation in mass. Massive objects () are located on the red sequence at all redshifts. They do not show an appreciable evolution in mass (the fraction of galaxies with remains approximately constant at irrespective of redshift bin) and move slightly towards redder colours with cosmic time, an effect of the ageing of the stellar population. On the lower mass end of the distribution (), there exists a less numerous, but still appreciable, population of bulge-dominated galaxies, reaching the blue cloud. These could be low-mass bulge-dominated galaxies hosted in low-density groups, where they are able to sustain appreciable star formation, possibly via “wet merger” events. Indeed, early-type galaxies with young stellar populations at low- are predominantly low-velocity dispersion systems and tend to live in lower density regions (Suh et al. 2010; Thomas et al. 2010). Moreover, some Blue Compact Dwarfs (BCDs), particularly those classified as nE types in Loose & Thuan (1986a), also show surface brightness profiles fitted by a de Vaucouleurs profile (Loose & Thuan 1986b; Kunth et al. 1988; Cairós et al. 2001). Assessing the proper nature of these objects is beyond the scope of this study, however we refer to Pannella et al. (2009) for a more detailed analysis of the environment of blue early-type galaxies at intermediate redshift.
The intermediate–type population (with , central panels of Figure 7) is mainly composed of disc or spiral galaxies having a prominent bulge. In the high-redshift end of the diagram they extend from the red sequence to the blue cloud region, whereas at lower- they are more concentrated in the blue/low-mass region. This agrees with the conclusions of previous studies on galaxy evolution (Pannella et al. 2009; Oesch et al. 2010), although these authors have used a different morphological classification scheme.
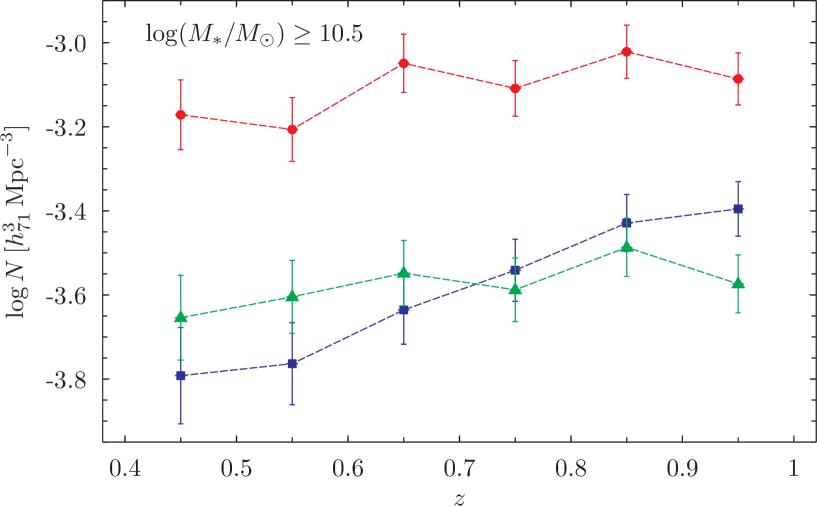
Concerning the bulgeless galaxies, if we focus on the high-mass end (e.g., for , where our sample is complete at all ), one can see a decreasing number of objects from to the lowest redshift bin. To take properly into account the survey volume effects, we evaluated the number density evolution of each morphological type for stellar masses . The result is illustrated in Figure 8, where it is clear that for the high-mass range considered, bulge-dominated systems constitute the majority of the galaxy population in the redshift range .
Looking at the evolution of the different morphological types, one can indeed see that, contrary to the number densities of massive bulgy and intermediate galaxies, which do not evolve significantly between and , the bulgeless galaxy population shows a significant decrease in their number density as cosmic time increases. The fact that early-type objects, in the selected mass range, show little or no evolution is in agreement with the most massive E/S0 galaxies being already in place at and evolve only weakly since then (Collins et al. 2009). On the other hand, the observed disappearance of massive bulgeless galaxies at later cosmic times necessarily implies a process that accompanies the growth of their stellar masses and tends to displace them to an early-type morphological bin through the formation of a classical bulges.
Oesch et al. (2010) attempted to quantify this observed trend assuming the morphological transformation of galaxies as due exclusively to merger events. Their simulations were unable to reasonably fit the observed data for all morphological types simultaneously, even including small accretion events in the model. Most notably, all the models over-predict the mass fraction of bulgeless disc galaxies as cosmic time proceeds. Thus, it is likely that these objects undergo a bulge-building process driven by disc dynamical instability, possibly triggered by secular accretion activity (Kormendy & Kennicutt 2004).
5.2 Red bulgeless galaxies: quiescent or dusty?
Recent studies (Bell 2008; Bell et al. 2012) demonstrated that the Sérsic index, among other galaxy quantities, correlates best with the lack of star-formation activity. At , large Sersíc indices correlate extremely well with quiescence, as shown by Bell (2008) using a SDSS sample. It is argued that “genuine” bulgeless quiescent galaxies could be either () satellite galaxies in high-mass halos, whose gas is stripped in a deep potential well, or () possibly a result of incorrect morphological classification, given that many of them show a hint of a bulge once visual examination is performed. Quenched bulgeless galaxies are rather rare up to high redshift (, Bell et al. 2012), and only a few pure disc, quiescent systems are reported in the literature at (e.g., McGrath et al. 2008; van der Wel et al. 2011; Bundy et al. 2010).
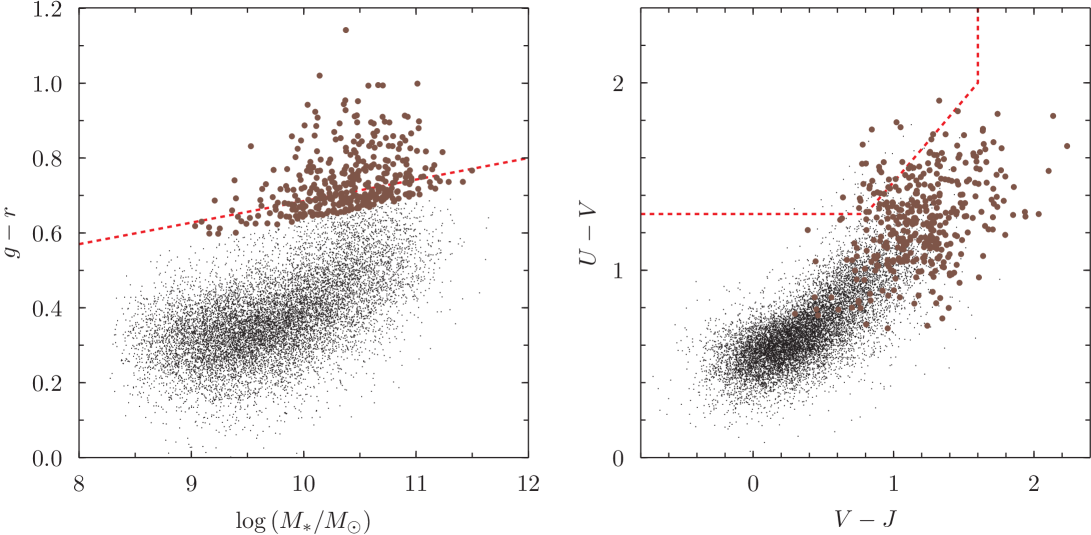
As discussed in § 5.1, it is known that the red sequence is mostly composed of galaxies with elliptical morphology and prominent bulges (e.g., Cassata et al. 2007). Nonetheless, it also hosts a small fraction of dusty, late-type, reddened star-forming objects (Williams et al. 2009) and Spi/Irr galaxies, with quenched star-formation (see e.g., Bell et al. 2012, and references therein). Indeed, figure 9 (left panel) shows that a significant fraction of the bulgeless population is located in the red sequence region of the colour–mass diagram. Finding red bulgeless galaxies gives evidence for an intriguing population of late-type objects – their optically red nature may result from substantial dust obscuration but it could also indicate that they have ceased forming stars, thus revealing a mechanism that induces quiescence without significantly altering the morphology.
A way to break the degeneracy between dusty star-forming and red quiescent galaxies is the use of rest-frame near-infrared–optical colours (Wuyts et al. 2007; Williams et al. 2009). Essentially, the colour provides a proxy for unobscured star-formation activity, whereas helps in highlighting dust-free quiescent galaxies that exhibit a bluer colour than dusty objects, and thus occupy a different locus in the plane. The relevant plot is shown in the right panel of Figure 9. The superimposed dashed lines are the redshift-dependent selection criteria for quiescent galaxies, described by Williams et al. (2009). To discriminate between quiescency and dust obscuration, we highlighted in the plane the sub-sample of red bulgeless lying down to 0.05 mag below the red sequence definition line indicated in § 5.1. The plot indicates that most of the bulgeless galaxies that are red in the /mass diagram owe their optical colour to dust instead of an old stellar population, with only a few objects located in the region of the diagram corresponding to quiescent galaxies.
5.3 Massive bulgeless galaxies
Figures 7 and 8 show that our sample includes a non-negligible fraction of massive [] bulgeless galaxies which contribute to 30% of the total galaxy population number density at . Overall, we find 2 339 out of 19 233 bulgeless galaxies (12%) with , and 1.5% of the sample consists of very massive systems with .
The existence of such massive bulgeless galaxies challenges the current picture of galaxy formation, because, in principle, they require a hierarchical growth to reach such large masses. It is not entirely clear how they can increase their masses through mergers without destroying their stellar discs and forming a classical bulge (Toth & Ostriker 1992). However, it was shown that gas-rich mergers can produce a large disc instead of a spheroidal system (Springel & Hernquist 2005; Robertson et al. 2006). Discs can survive or rapidly regrow after a merging event provided that the gas fraction in the discs of the progenitors is high (Robertson et al. 2006; Robertson & Bullock 2008; Hopkins et al. 2009). At massive bulgeless galaxies are less numerous compared to early-type galaxies, but are more abundant than intermediate-type at similar mass range (Figure 8). Their number density decreases with redshift, reducing by a factor of 2 from to 0.4, and they are rare in the local Universe (Silk & Mamon 2012). This trend is also found in similar studies of galactic morphological evolution within the same redshift range (Pannella et al. 2009; Oesch et al. 2010). The gradual disappearance of very massive bulgeless galaxies at recent times might imply a process that accompanies the growth of their stellar masses and tends to transform them into an earlier type morphology through the formation of a classical bulge.
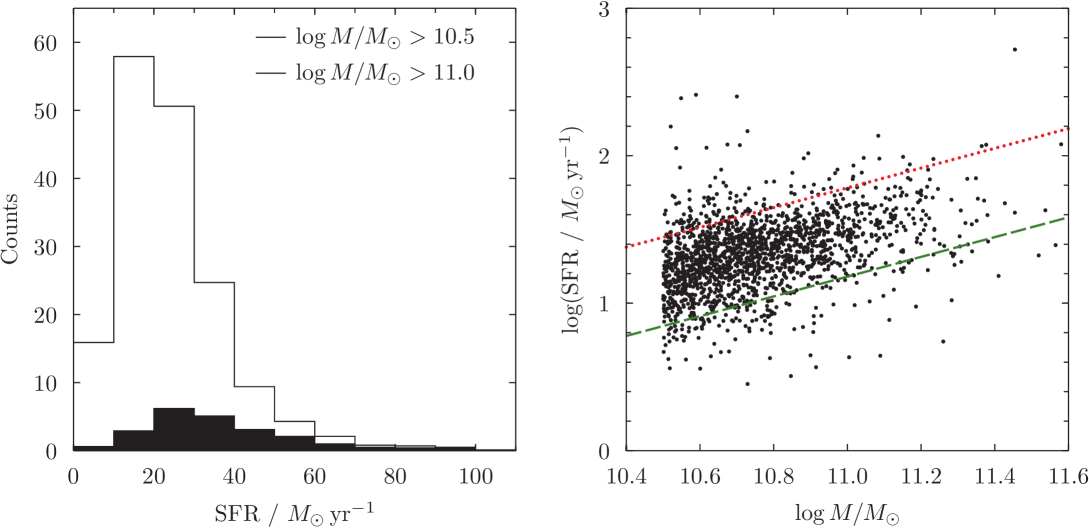
To explore this possibility we have used Spitzer and Galex data to derive both ultraviolet and infrared star forming rates (SFRs), to investigate the star-forming properties of the most massive galaxies in our sample. As mentioned in section § 3.2, Spitzer Space Telescope observations are available for the COSMOS, AEGIS and GEMS/GOODS-S fields. Overall, 5 574 sources (29%) out of the entire bulgeless galaxy sample have a good photometric measurement at 24 m. Interestingly, 80% (228/296) of the very massive () bulgeless sample has a 24 m measurement. The total infrared luminosity, (8-1000 m), is determined following the procedure described in Caputi et al. (2008). Starting from the 24m flux densities, we used the SED templates of NGC 3351 to reproduce the corresponding rest-frame luminosity and to derive the integrated of that template. Infrared and ultraviolet SFRs were determined from and rest-frame luminosities, and added together to obtain an estimate of the total SFR for each galaxy.
The SFRs range between 10 and 100 yr-1 and the distribution peaks at roughly 20-30 yr-1 (Figure 10; left panel). For comparison, we plotted the relation found by Noeske et al. (2007) for galaxies with masses at (SF main sequence), and the corresponding line defining a four time higher SFR. Despite the scatter it appears that massive bulgeless have a higher (roughly twice) specific SFR than same mass galaxies located along the SF main sequence, but they do not show evidence of starburst activity which would imply SFR ten time higher than the trend defined by the SF main sequence.
The most massive galaxies in our sample () have an average SFR of about 50 yr-1, implying that they can nearly double their stellar mass due to their star-formation activity over Gyr. This is less than the look-back time spanned by our redshift range, corresponding to Gyr. These galaxies are clearly different in nature to a fairly massive spiral like the Milky Way. Their SFR is more than 30 times higher than the Galactic one, while not reaching the extreme nature of Ultra-luminous Infrared Galaxies (ULIRGs). If their intense star-formation activity, as suggested by their high far-infrared luminosities , is concentrated in the centre, it is plausible that a fraction of the additional mass formed from their star-formation activity may lead to the formation of a bulge, contributing to the morphological transformation necessary to evolve into a massive disc galaxy with a bulge. This might explain why massive bulgeless galaxies are relatively rare in the local Universe. The presence of a bar may also be related to the morphological transformation of bulgeless galaxies. In the disc-instability scenario, low angular momentum material in the centre of a disc is assumed to form a bar due to a global instability (Shen & Sellwood 2003). Galactic bars induce inflow of interstellar gas towards the centre, and the gas accumulated at the galactic centre provides raw material for the bulge component (Friedli & Benz 1993).
Finally, one cannot exclude that the disappearance of massive bulgeless galaxies is related to mergers producing bulge-dominated discs or spheroidals. Thus, it is important to analyse the local environment where these systems reside in order to investigate this possibility in more detail. The study of the environmental properties of massive bulgeless galaxies, as well as a more detailed analysis of the multi-colour HST images of these systems to search for centrally enhanced star-formation activity or the presence of bars, will be the focus of future papers.
6 Systematic search of bulgeless AGN hosts in X-ray surveys
Having assembled a statistically significant sample of bulgeless galaxies at intermediate redshift, we carried out a sistematic search for Active Galactic Nuclei (AGN) candidates to verify their existence in pure disc systems. X-ray emission is generally recognised as a robust indicator of AGN activity since it does not suffer from heavy dust or gas extinction and contamination from star-formation in the host galaxy is relatively weak.
X-rays from AGN are produced in the inner and hottest nuclear region of the galaxy, where accretion onto the black hole (BH) occurs, and their penetrating power (especially for hard X-rays, 2–10 keV) allows them to carry information from the central engine without being substantially affected by absorption. Since detection in the soft band (0.5–2 keV) only could miss obscured AGN (Comastri & Fiore 2004), we assembled a dataset including objects detected in either hard or soft X-ray bands. However, even the deepest of the current X-ray surveys are likely to miss the most heavily obscured “Compton thick” AGN (Gilli et al. 2007).
6.1 Identification of AGN
In order to find X-ray emitting bulgeless, we matched the X-ray catalogues described in § 3.3 with our optical database — including all the morphological types — using an adaptation of the likelihood-ratio method (Sutherland & Saunders 1992). This method assigns to every matching pair a probability of being a non-false match; then we chose only the pairs for which the method gave high probability values (), and selected only the bulgeless objects in the redshift range of interest ( and ).
We also visually inspected the optical images to spot any obvious mis-identification due to a failure of the matching algorithm (e.g., because of a nearby very bright source). We excluded from our sample extended X-ray sources, which are usually related to galaxy clusters rather than AGN (Finoguenov et al. 2007), and objects which have large cross-band positional offsets ( 2.5 arcsec, Alexander et al. 2003) to obtain a reliable final sample.
The rest-frame X-ray luminosity was calculated using photometric (or spectroscopic, when available) redshifts using the formula:
| (2) |
where is the luminosity distance in cm, and is the observed full X-ray flux in units of erg cm-2 s-1. The photon index, , is assumed to be equal to 1.8 for all sources, as the use of individual indices results in only minor differences in the rest-frame luminosities (Barger et al. 2002, 2007).
Following Szokoly et al. (2004) the criteria adopted to identify and classify an AGN are the following:
-
•
AGN-1: erg s-1 and , which show narrow and broad lines in the optical bands;
-
•
AGN-2: erg s-1 and , for which only narrow lines are observed in the optical bands.
where HR is the hardness ratio defined as ; is the number of photon counts in the hard band and is the number of counts in the soft band. The HR can be used to roughly estimate the obscuration affecting the sources, as the most efficient and reddening independent method to select obscured type 2 AGN is the presence of luminous X-ray emission and hard X-ray colours. Where a source has only upper limits in the soft or hard bands, the HR is assumed as +1 and -1, respectively.
Though widely used, this method suffers from some uncertainties. It is worth noting that some high redshift absorbed/type 2 sources can be identified as type 1 when adopting a X-ray classification based on the HR. In fact, increasing absorption makes the sources harder, while a high redshift makes them softer. Nevertheless, there is evidence that the method is robust as it gives results that are in good agreement with those obtained through optical indicators, such as BPT diagrams (see for instance, El Bouchefry 2009). This classification yielded 43 AGN candidates.
Typically, hard X-ray detections with luminosity higher that 1041 erg s-1 are evident tracers of AGN activity; nonetheless, for sources in which only soft X-rays were detected (21 in our sample), we tested whether the X-ray luminosities could be produced by star-formation activity instead of an AGN. SFRs derived in § 5.3 for most of the AGN candidates give values in the range 4–50 yr-1, with just one outlier showing 167 yr-1. Applying the relation (Mineo et al. 2012):
| (3) |
that holds at , we can conclude that the X-ray luminosities of our sample are one to three orders of magnitude higher than the ones calculated with Eq. (3).
6.2 Morphological analysis of AGN candidates
The morphological classification of the sample extracted from the ACS-GC, as described in Griffith et al. (2012) and in § 2.1, relied on galfit results; the reliability of such a classification was assessed in § 4.1, and it proved to be appropriate for statistical purposes. However, since the AGN host candidates represent a very small fraction of our sample, we double checked the morphology of each object with an X-ray counterpart to exclude possible mis-classifications due to the automatic procedure. Given that bulgeless AGN are extremely rare, any morphological mis-classification would likely be clearly revealed in this sample.
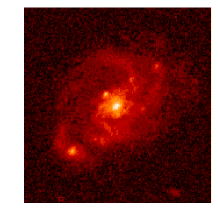
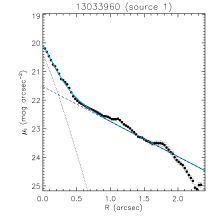
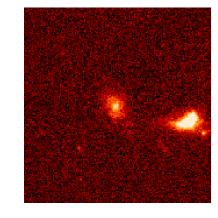
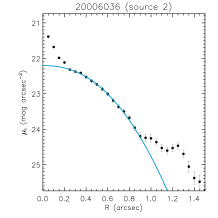
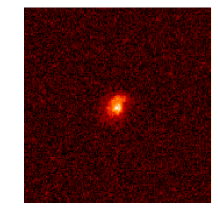
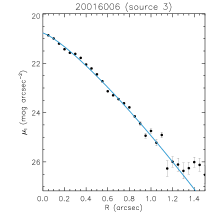
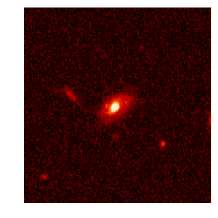
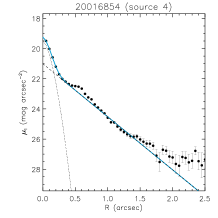
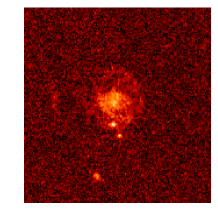
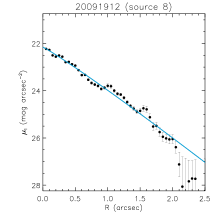
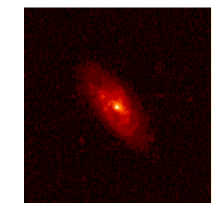
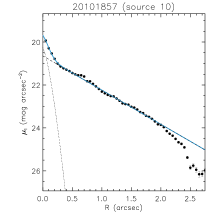
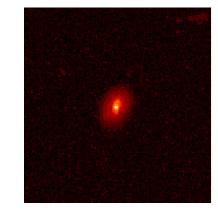
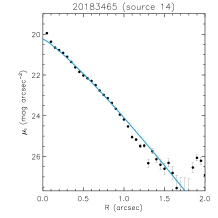
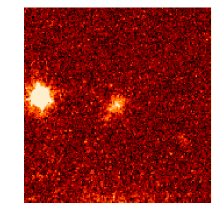
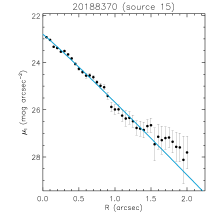
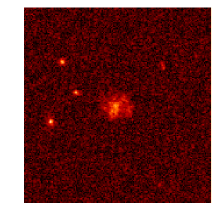
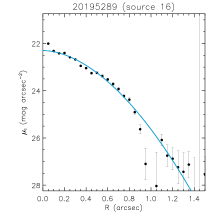
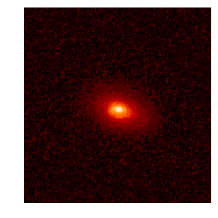
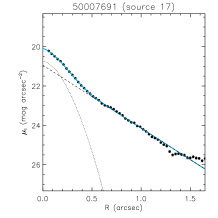
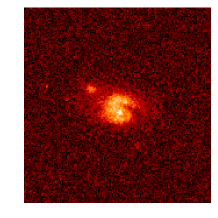
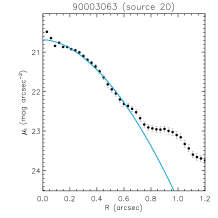
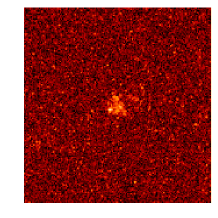
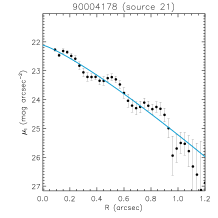
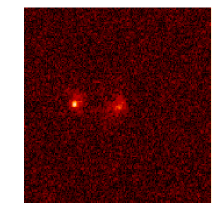
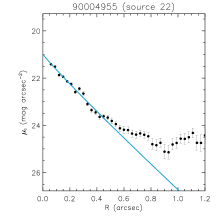
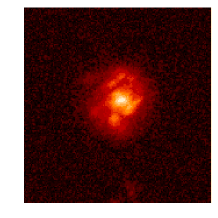
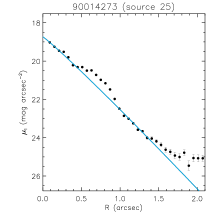
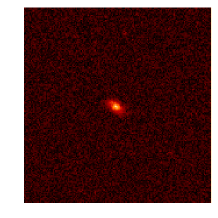
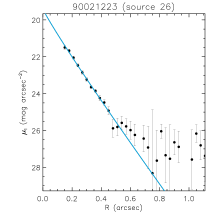
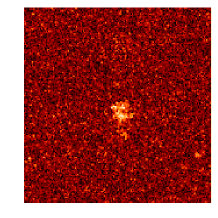
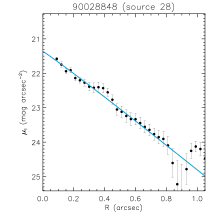
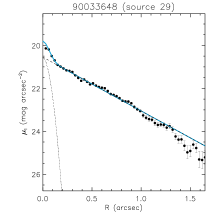
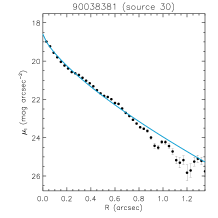
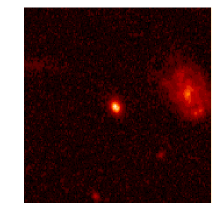
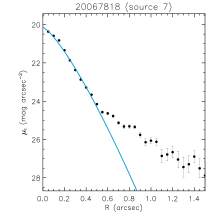
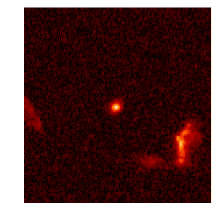
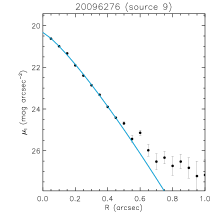
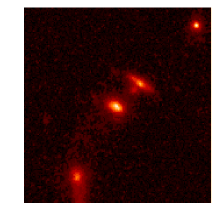
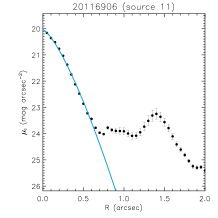
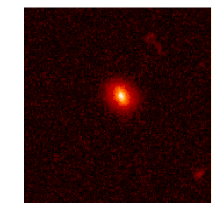
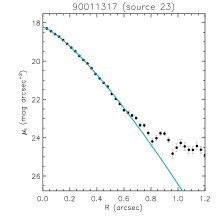
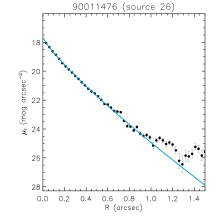
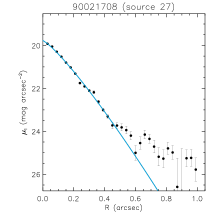
For each target we retrieved a 256256 pixel cut-out from the HST/ACS archive. We visually inspected the 43 cut-out images and identified 4 sources which we classified as mergers and rejected from the sample without attempting any further analysis. One additional source showed an extended dust lane feature and was also discarded. The morphology of the remaining sources was tested with a detailed analysis of the surface brightness (SB) profiles. We measured the surface photometry in IRAF, using the task ellipse in STSDAS. We then determined the best fit Sérsic profiles for each AGN host candidate galaxy. If a single Sérsic model did not provide an adequate fit to the data, we tried a combination of a Sérsic plus an exponential disc profile. According to Kormendy & Kennicutt (2004) late-type galaxies can host pseudo-bulges in the central regions which are described by low Sérsic indices (), and have central light distribution similar to that of the outer disc. From this analysis we rejected three candidates showing a bulge component with . Finally, five additional objects were rejected because they had an ambiguous match between the optical and the X-ray source position.
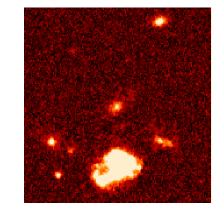
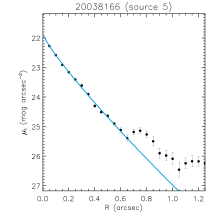
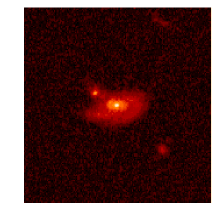
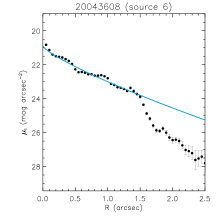
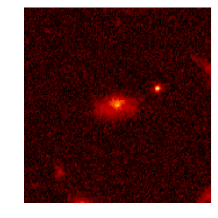
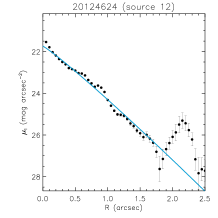
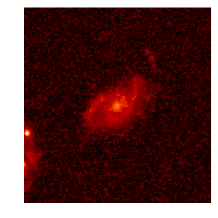
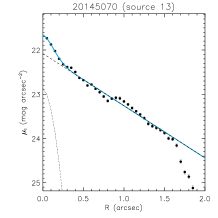
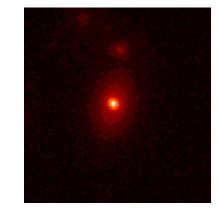
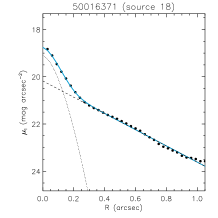
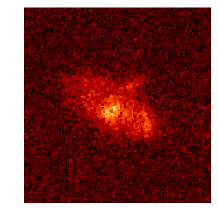
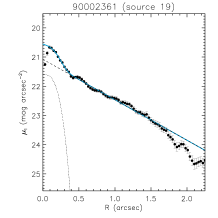
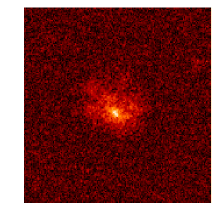
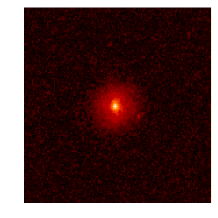
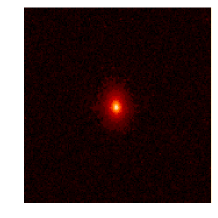
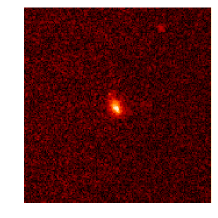
The final sample is formed by thirty objects, eleven of them are classified as type I, the remaining nineteen are type II AGN. Their X-ray properties are displayed in Table 4. Their brightness surface profiles are described by either a single Sérsic profile with (22 out of 30; 74%), or a combination of a central “pseudo-bulge” Sérsic profile with plus an extended disc (8 out of 30; 26%). The best-fit parameters are collected in Table 5. Figures 11 and 12 show the HST images of the 30 AGN host galaxy candidates and the SB profiles with the corresponding best fits. Substructures in the discs are visible in some cases affecting the goodness of the fit.
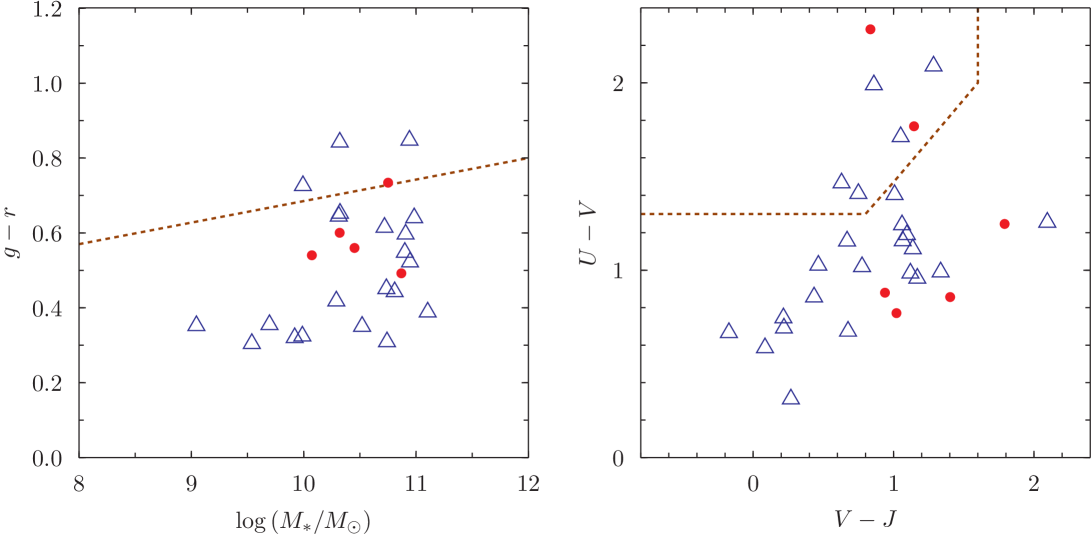
Visual inspection of the images shows that among the sample there are six targets which, despite the low index, show a compact/spheroidal morphology (Figure 12). Colour-mass and colour-colour plots of these galaxies show that they are at the edge of the red sequence (red dots, Figure 13, left panel). However, only two objects fall in the region of red quiescent galaxies. The remaining ones appear to be star-forming systems with a substantial amount of dust (red dots, Figure 13, right panel). Although these galaxies should be treated with additional care, we show that they do have low Sérsic indices and most of them have evidence of star-formation activity, thus suggesting that they can be considered as reliable bulgeless AGN host candidates.
A more detailed analysis of the X-ray properties of the AGN candidates, including an estimate of the BH masses, will be presented in a forthcoming paper (Leonardo et al., 2013, in preparation).
7 Summary and conclusion
In this paper we presented a magnitude-limited (), low-inclination, point-source free, -corrected sample of 19 233 bulgeless galaxies at intermediate redshift () based on the ACS-GC public morphology catalogue. It includes a photometric and morphological database derived from the COSMOS, AEGIS, GEMS, GOODS-N and GOODS-S surveys. We assembled all the ancillary data available for these five fields and generated a homogeneous data-set, including photometric measurements from the far-ultraviolet to mid-infrared wavelength range. The catalogue is made publicly available to the scientific community and it contains morphological classifications, photometric and/or spectroscopic redshifts, rest-frame magnitudes and stellar masses which have been estimated by fitting the multi-colour photometry to a grid of composite stellar population models using the kcorrect code. Comparison with existing catalogues of COSMOS and GOODS-S fields (Pannella et al. 2009; Marchesini et al. 2009) shows that our results are in agreement with both the morphological classification and mass estimates already available in the literature. The applied magnitude limit in the band corresponds to a minimum detectable mass of 109 and at and , respectively.
We analysed the properties of the sample and the evolution of pure-disc systems with redshift. As expected, the bulk of bulgeless galaxies occupies the low-mass end region of the colour-mass diagram () and is predominantly blue, indicating recent star-formation activity, as opposed to the early-type objects, which dominate the red, high-mass end of the diagram.
Within the bulgeless sample, we found a non-negligible population of very massive galaxies with , which contributes to % of the total galaxy population number density at . Analysis of the evolution of the number density of the different morphological types with redshift, above our completeness mass limit ( ), shows a decrease of the bulgeless number density with time compared to the “bulgy”/early-type systems. This implies that internal bulge growth through either star-formation activity or mergers, and interactions with nearby companions make massive pure-disc systems evolve to earlier type morphologies through time.
The most massive galaxies among our sample are indeed characterized by SFRs ranging between 10 and 100 yr-1, suggesting that a prolongued star-formation activity ( yr) at such rate might contribute to the build-up of nuclear mass and formation of a classical bulge. The disappearance of very massive bulgeless galaxies is confirmed by low redshift studies. Pure disc/pseudo-bulge galaxies are the most common morphological types within the local volume ( Mpc) at stellar masses below 1010 , while more massive pure-disc galaxies are rare (Fisher & Drory 2010).
Since bulges and AGN are thought to co-evolve in galaxies, we searched for possible AGN counterparts to bulgeless systems, in order to investigate the formation of massive nuclear BHs in galaxies with an apparently uneventful merger history. Because X-ray emission provides one of the most effective and reliable tools to confirm the existence of an AGN compared to the radio continuum or mid-infrared observations, we combined the optical database with X-ray catalogues to search for X-ray sources within our sample. We found only 30 X-ray detections with a reliable bulgeless optical counterpart, after having visually inspected the corresponding HST images and re-analysed the -band surface brightness profiles. These AGN host candidates are well-fit by either a single Sérsic model with index or by a combination of a pseudo-bulge (with ) and a disc component.
The 30 detections represent 0.2% of the bulgeless sample; this fraction must be considered as a stringent lower limit. Comparing with the other morphological classes, we found that this detection ratio is only marginally smaller than the one of the intermediate-type population (0.3%) and 6 times smaller than that of the bulge-dominated sample (1.2%).
Acknowledgments
We thank the anonymous referee for the useful comments and suggestions. This work is based on (GO-10134, GO-09822, GO-09425.01, GO-09583.01, GO-9500) program observations with the NASA/ESA Hubble Space Telescope, obtained at the Space Telescope Science Institute, which is operated by the Association of Universities for Research in Astronomy, Inc., under NASA contract NAS 5-26555. This research has made use of the NASA/ IPAC Infrared Science Archive, which is operated by the Jet Propulsion Laboratory, California Institute of Technology, under contract with the National Aeronautics and Space Administration. This work is also based on zCOSMOS observations carried out using the Very Large Telescope at the ESO Paranal Observatory under Program ID: LP175.A-0839. This study makes use of data from AEGIS, a multiwavelength sky survey conducted with the Chandra, GALEX, Hubble, Keck, CFHT, MMT, Subaru, Palomar, Spitzer, VLA, and other telescopes and supported in part by the NSF, NASA, and the STFC. Funding for the DEEP2 survey has been provided by NSF grants AST95-09298, AST-0071048, AST-0071198, AST-0507428, and AST-0507483 as well as NASA LTSA grant NNG04GC89G. Some of the data were obtained at the W. M. Keck Observatory, which is operated as a scientific partnership among the California Institute of Technology, the University of California and the National Aeronautics and Space Administration. The Observatory was made possible by the generous financial support of the W. M. Keck Foundation. Work on this paper is based on observations obtained with MegaPrime/MegaCam, a joint project of CFHT and CEA/DAPNIA, at the Canada-France-Hawaii Telescope (CFHT), which is operated by the National Research Council (NRC) of Canada, the Institut National des Science de l’Univers of the Centre National de la Recherche Scientifique (CNRS) of France, and the University of Hawaii. We gratefully acknowledge the GOODS Team (http://cosmos.astro.caltech.edu) for providing all the imaging material available worldwide. We are also indebted to the COMBO-17 (Wolf et al. 2004) and MUSIC teams (Grazian et al. 2006) for the catalogues publicly supplied. The authors gratefully acknowledge financial support from the Science and Technology Foundation (FCT, Portugal) through the research grants PTDC/CTE-AST/105287/2008, PTDC/FIS-AST/2194/2012, PEst-OE/FIS/UI2751/2011, and PEst-OE/FIS/UI2751/2014. L.B., E.L. and M.E.F. gratefully acknowledge support from the Science and Technology Foundation (FCT, Portugal) through the Fellowships SFRH/BPD/62966/2009, SFRH/BPD /71278/2010 and SFRH/BPD/36141/2007.
References
- Alexander et al. (2003) Alexander, D. M., Bauer, F. E., Brandt, W. N., et al. 2003, AJ, 126, 539
- Araya Salvo et al. (2012) Araya Salvo, C., Mathur, S., Ghosh, H., Fiore, F., & Ferrarese, L. 2012, ApJ, 757, 179
- Barden et al. (2012) Barden, M., Häußler, B., Peng, C. Y., McIntosh, D. H., & Guo, Y. 2012, MNRAS, 422, 449
- Barger et al. (2002) Barger, A. J., Cowie, L. L., Brandt, W. N., et al. 2002, AJ, 124, 1839
- Barger et al. (2007) Barger, A. J., Cowie, L. L., & Wang, W.-H. 2007, ApJ, 654, 764
- Barger et al. (2008) Barger, A. J., Cowie, L. L., & Wang, W.-H. 2008, ApJ, 689, 687
- Barmby et al. (2008) Barmby, P., Huang, J.-S., Ashby, M. L. N., et al. 2008, ApJS, 177, 431
- Barro et al. (2011) Barro, G., Pérez-González, P. G., Gallego, J., et al. 2011, ApJS, 193, 13
- Barth et al. (2009) Barth, A. J., Strigari, L. E., Bentz, M. C., Greene, J. E., & Ho, L. C. 2009, ApJ, 690, 1031
- Bell (2008) Bell, E. F. 2008, ApJ, 682, 355
- Bell & de Jong (2001) Bell, E. F. & de Jong, R. S. 2001, ApJ, 550, 212
- Bell et al. (2012) Bell, E. F., van der Wel, A., Papovich, C., et al. 2012, ApJ, 753, 167
- Bertin & Arnouts (1996) Bertin, E. & Arnouts, S. 1996, A&AS, 117, 393
- Blanton & Roweis (2007) Blanton, M. R. & Roweis, S. 2007, AJ, 133, 734
- Brook et al. (2012) Brook, C. B., Stinson, G., Gibson, B. K., et al. 2012, MNRAS, 419, 771
- Brusa et al. (2010) Brusa, M., Civano, F., Comastri, A., et al. 2010, ApJ, 716, 348
- Bruzual & Charlot (2003) Bruzual, G. & Charlot, S. 2003, MNRAS, 344, 1000
- Bundy et al. (2006) Bundy, K., Ellis, R. S., Conselice, C. J., et al. 2006, ApJ, 651, 120
- Bundy et al. (2009) Bundy, K., Fukugita, M., Ellis, R. S., et al. 2009, ApJ, 697, 1369
- Bundy et al. (2010) Bundy, K., Scarlata, C., Carollo, C. M., et al. 2010, ApJ, 719, 1969
- Cairós et al. (2001) Cairós, L. M., Vílchez, J. M., González Pérez, J. N., Iglesias-Páramo, J., & Caon, N. 2001, ApJS, 133, 321
- Caldwell et al. (2008) Caldwell, J. A. R., McIntosh, D. H., Rix, H.-W., et al. 2008, ApJS, 174, 136
- Capak et al. (2007) Capak, P., Aussel, H., Ajiki, M., et al. 2007, ApJS, 172, 99
- Cappelluti et al. (2009) Cappelluti, N., Brusa, M., Hasinger, G., et al. 2009, A&A, 497, 635
- Caputi et al. (2008) Caputi, K. I., Lilly, S. J., Aussel, H., et al. 2008, ApJ, 680, 939
- Cassata et al. (2005) Cassata, P., Cimatti, A., Franceschini, A., et al. 2005, MNRAS, 357, 903
- Cassata et al. (2007) Cassata, P., Guzzo, L., Franceschini, A., et al. 2007, ApJS, 172, 270
- Chambers et al. (2004) Chambers, K. C., Miley, G. K., van Breugel, W. J. M., & Huang, J.-S. 2004, MNRAS, 351, 1215
- Coelho et al. (2013) Coelho, B., Antón, S., Lobo, C., & Ribeiro, B. 2013, MNRAS
- Coil et al. (2004) Coil, A. L., Newman, J. A., Kaiser, N., et al. 2004, ApJ, 617, 765
- Cole et al. (2000) Cole, S., Lacey, C. G., Baugh, C. M., & Frenk, C. S. 2000, MNRAS, 319, 168
- Collins et al. (2009) Collins, C. A., Stott, J. P., Hilton, M., et al. 2009, Nature, 458, 603
- Comastri & Fiore (2004) Comastri, A. & Fiore, F. 2004, ApJS, 294, 63
- Cowie et al. (2004) Cowie, L. L., Barger, A. J., Hu, E. M., Capak, P., & Songaila, A. 2004, AJ, 127, 3137
- Daddi et al. (2004) Daddi, E., Cimatti, A., Renzini, A., et al. 2004, ApJ, 617, 746
- Dahlen et al. (2010) Dahlen, T., Mobasher, B., Dickinson, M., et al. 2010, ApJ, 724, 425
- Davis et al. (2003) Davis, M., Faber, S. M., Newman, J., et al. 2003, in Society of Photo-Optical Instrumentation Engineers (SPIE) Conference Series, ed. P. Guhathakurta, Vol. 4834, 161
- Davis et al. (2007) Davis, M., Guhathakurta, P., Konidaris, N. P., et al. 2007, ApJ, 660, L1
- Desroches & Ho (2009) Desroches, L. B. & Ho, L. C. 2009, ApJ, 690, 267
- Dickinson et al. (2003) Dickinson, M., Giavalisco, M., & GOODS Team. 2003, in The Mass of Galaxies at Low and High Redshift, 324
- D’Onghia & Burkert (2004) D’Onghia, E. & Burkert, A. 2004, ApJ, 612, L13
- Drory et al. (2004) Drory, N., Bender, R., & Hopp, U. 2004, ApJ, 616, L103
- Dutton & van den Bosch (2009) Dutton, A. A. & van den Bosch, F. C. 2009, MNRAS, 396, 141
- El Bouchefry (2009) El Bouchefry, K. 2009, MNRAS, 396, 2011
- Elvis et al. (2009) Elvis, M., Civano, F., Vignali, C., et al. 2009, ApJS, 184, 158
- Fall & Efstathiou (1980) Fall, S. M. & Efstathiou, G. 1980, MNRAS, 193, 189
- Filippenko & Ho (2003) Filippenko, A. V. & Ho, L. C. 2003, ApJ, 588, L13
- Finoguenov et al. (2007) Finoguenov, A., Guzzo, L., Hasinger, G., et al. 2007, ApJS, 172, 182
- Fisher & Drory (2010) Fisher, D. B. & Drory, N. 2010, ApJ, 716, 942
- Frayer et al. (2009) Frayer, D. T., Sanders, D. B., Surace, J. A., et al. 2009, AJ, 138, 1261
- Friedli & Benz (1993) Friedli, D. & Benz, W. 1993, A&A, 268, 65
- Gadotti (2009) Gadotti, D. A. 2009, MNRAS, 393, 1531
- Giavalisco et al. (2004) Giavalisco, M., Ferguson, H. C., Koekemoer, A. M., et al. 2004, ApJ, 600, L93
- Gilli et al. (2007) Gilli, R., Comastri, A., & Hasinger, G. 2007, A&A, 463, 79
- Grazian et al. (2006) Grazian, A., Fontana, A., de Santis, C., et al. 2006, A&A, 449, 951
- Griffith et al. (2012) Griffith, R. L., Cooper, M. C., Newman, J. A., et al. 2012, ApJS, 200, 9
- Gwyn (2008) Gwyn, S. D. J. 2008, PASP, 120, 212
- Hainline et al. (2011) Hainline, L. J., Blain, A. W., Smail, I., et al. 2011, ApJ, 740, 96
- Häring & Rix (2004) Häring, N. & Rix, H. W. 2004, ApJ, 604, L89
- Hoaglin et al. (1983) Hoaglin, D. C., Mosteller, F., & Tukey, J. W. 1983, Understanding robust and exploratory data anlysis (New York: Wiley)
- Hopkins et al. (2009) Hopkins, P. F., Cox, T. J., Younger, J. D., & Hernquist, L. 2009, ApJ, 691, 1168
- Ilbert et al. (2006) Ilbert, O., Arnouts, S., McCracken, H. J., et al. 2006, A&A, 457, 841
- Ilbert et al. (2009) Ilbert, O., Capak, P., Salvato, M., et al. 2009, ApJ, 690, 1236
- Kajisawa et al. (2011) Kajisawa, M., Ichikawa, T., Tanaka, I., et al. 2011, PASJ, 63, 379
- Kautsch et al. (2006) Kautsch, S. J., Grebel, E. K., Barazza, F. D., & Gallagher, III, J. S. 2006, A&A, 445, 765
- Kewley et al. (2001) Kewley, L. J., Dopita, M. A., Sutherland, R. S., Heisler, C. A., & Trevena, J. 2001, ApJ, 556, 121
- Koda et al. (2009) Koda, J., Milosavljević, M., & Shapiro, P. R. 2009, ApJ, 696, 254
- Kormendy et al. (2011) Kormendy, J., Bender, R., & Cornell, M. E. 2011, Nature, 469, 374
- Kormendy & Kennicutt (2004) Kormendy, J. & Kennicutt, Jr., R. C. 2004, ARA&A, 42, 603
- Kormendy & Richstone (1995) Kormendy, J. & Richstone, D. 1995, ARA&A, 33, 581
- Kunth et al. (1988) Kunth, D., Maurogordato, S., & Vigroux, L. 1988, A&A, 10, 204
- Laird et al. (2009) Laird, E. S., Nandra, K., Georgakakis, A., et al. 2009, ApJ, 180, 102
- Larson et al. (2011) Larson, D., Dunkley, J., Hinshaw, G., et al. 2011, ApJS, 192, 16
- Lehmer et al. (2005) Lehmer, B. D., Brandt, W. N., Alexander, D. M., et al. 2005, ApJS, 161, 21
- Lilly et al. (2007) Lilly, S. J., Le Fèvre, O., Renzini, A., et al. 2007, ApJS, 172, 70
- Loose & Thuan (1986a) Loose, H.-H. & Thuan, F. X. 1986a, Mitteilungen der Astronomischen Gesellschaft Hamburg, 65, 231
- Loose & Thuan (1986b) Loose, H.-H. & Thuan, T. X. 1986b, ApJ, 309, 59
- Lotz et al. (2008) Lotz, J. M., Davis, M., Faber, S. M., et al. 2008, ApJ, 672, 177
- Lotz et al. (2004) Lotz, J. M., Primack, J., & Madau, P. 2004, AJ, 128, 163
- Magorrian et al. (1998) Magorrian, J., Tremaine, S., Richstone, D., et al. 1998, AJ, 115, 2285
- Marchesini et al. (2009) Marchesini, D., van Dokkum, P. G., Förster Schreiber, N. M., et al. 2009, ApJ, 701, 1765
- Mathur et al. (2012) Mathur, S., Fields, D., Peterson, B. M., & Grupe, D. 2012, ApJ, 754, 146
- McAlpine et al. (2011) McAlpine, W., Satyapal, S., Gliozzi, M., et al. 2011, ApJ, 728, 25
- McCracken et al. (2012) McCracken, H. J., Milvang-Jensen, B., Dunlop, J., et al. 2012, A&A, 544, A156
- McGrath et al. (2008) McGrath, E. J., Stockton, A., Canalizo, G., Iye, M., & Maihara, T. 2008, ApJ, 682, 303
- Mineo et al. (2012) Mineo, S., Gilfanov, M., Lehmer, B. D., Morrison, G. E., & Sunyaev, R. 2012, ArXiv e-prints
- Moster et al. (2011) Moster, B. P., Somerville, R. S., Newman, J. A., & Rix, H.-W. 2011, ApJ, 731, 113
- Muzzin et al. (2009) Muzzin, A., Marchesini, D., van Dokkum, P. G., et al. 2009, ApJ, 701, 1839
- Noeske et al. (2007) Noeske, K. G., Weiner, B. J., Faber, S. M., et al. 2007, ApJ, 660, L43
- Oesch et al. (2010) Oesch, P. A., Carollo, C. M., Feldmann, R., et al. 2010, ApJ, 714, L47
- Pannella et al. (2009) Pannella, M., Gabasch, A., Goranova, Y., et al. 2009, ApJ, 701, 787
- Peng et al. (2002) Peng, C. Y., Ho, L. C., Impey, C. D., & Rix, H.-W. 2002, AJ, 124, 266
- Peterson et al. (2005) Peterson, B. M., Bentz, M. C., Desroches, L.-B., et al. 2005, ApJ, 632, 799
- Reines et al. (2011) Reines, A. E., Sivakoff, G. R., Johnson, K. E., & Brogan, C. L. 2011, Nature, 470, 6
- Robertson et al. (2006) Robertson, B., Bullock, J. S., Cox, T. J., et al. 2006, ApJ, 645, 986
- Robertson et al. (2004) Robertson, B., Yoshida, N., Springel, V., & Hernquist, L. 2004, ApJ, 606, 32
- Robertson & Bullock (2008) Robertson, B. E. & Bullock, J. S. 2008, ApJ, 685, L27
- Sanders et al. (2007) Sanders, D. B., Salvato, M., Aussel, H., et al. 2007, ApJS, 172, 86
- Satyapal et al. (2009) Satyapal, S., Böker, T., Mcalpine, W., et al. 2009, ApJ, 704, 439
- Satyapal et al. (2007) Satyapal, S., Vega, D., Heckman, T., O’Halloran, B., & Dudik, R. 2007, ApJ, 663, L9
- Scarlata et al. (2007) Scarlata, C., Carollo, C. M., Lilly, S., et al. 2007, ApJS, 172, 406
- Schawinski et al. (2010) Schawinski, K., Urry, C. M., Virani, S., et al. 2010, ApJ, 711, 284
- Scoville et al. (2007) Scoville, N., Abraham, R. G., Aussel, H., et al. 2007, ApJS, 172, 38
- Secrest et al. (2012) Secrest, N. J., Satyapal, S., Gliozzi, M., et al. 2012, ApJ, 753, 38
- Sérsic (1968) Sérsic, J. L. 1968, Atlas de galaxias australes (Cordoba, Argentina: Observatorio Astronomico)
- Shen & Sellwood (2003) Shen, J. & Sellwood, J. A. 2003, in American Astronomical Society Meeting Abstracts, 1353
- Silk & Mamon (2012) Silk, J. & Mamon, G. A. 2012, Research in Astronomy and Astrophysics, 12, 917
- Simmons et al. (2012) Simmons, B. D., Lintott, C., Schawinski, K., et al. 2012, MNRAS, 429, 2199
- Springel & Hernquist (2005) Springel, V. & Hernquist, L. 2005, ApJ, 622, L9
- Suh et al. (2010) Suh, H., Jeong, H., Oh, K., et al. 2010, ApJS, 187, 374
- Sutherland & Saunders (1992) Sutherland, W. & Saunders, W. 1992, MNRAS, 259, 413
- Szokoly et al. (2004) Szokoly, G. P., Bergeron, J., Hasinger, G., et al. 2004, ApJS, 155, 271
- Taniguchi et al. (2007) Taniguchi, Y., Scoville, N., Murayama, T., et al. 2007, ApJS, 172, 9
- Thomas et al. (2010) Thomas, D., Maraston, C., Schawinski, K., Sarzi, M., & Silk, J. 2010, MNRAS, 404, 1775
- Thornton et al. (2008) Thornton, C. E., Barth, A. J., Ho, L. C., Rutledge, R. E., & Greene, J. E. 2008, ApJ, 686, 892
- Toth & Ostriker (1992) Toth, G. & Ostriker, J. P. 1992, ApJ, 389, 5
- Tremaine et al. (2002) Tremaine, S., Gebhardt, K., Bender, R., et al. 2002, ApJ, 574, 740
- van der Wel et al. (2011) van der Wel, A., Rix, H.-W., Wuyts, S., et al. 2011, ApJ, 730, 38
- Wang et al. (2010) Wang, W.-H., Cowie, L. L., Barger, A. J., Keenan, R. C., & Ting, H.-C. 2010, ApJS, 187, 251
- Williams et al. (2009) Williams, R. J., Quadri, R. F., Franx, M., van Dokkum, P., & Labbé, I. 2009, ApJ, 691, 1879
- Wirth et al. (2004) Wirth, G. D., Willmer, C. N. A., Amico, P., et al. 2004, AJ, 127, 3121
- Wolf et al. (2008) Wolf, C., Hildebrandt, H., Taylor, E. N., & Meisenheimer, K. 2008, A&A, 492, 933
- Wolf et al. (2004) Wolf, C., Meisenheimer, K., Kleinheinrich, M., et al. 2004, A&A, 421, 913
- Wuyts et al. (2011) Wuyts, S., Förster Schreiber, N. M., van der Wel, A., et al. 2011, ApJ, 742, 96
- Wuyts et al. (2007) Wuyts, S., Labbé, I., Franx, M., et al. 2007, ApJ, 655, 51
- Xue et al. (2011) Xue, Y. Q., Luo, B., Brandt, W. N., et al. 2011, ApJS, 195, 10
| Survey | RA | Dec | area | filters | pixel scale |
|---|---|---|---|---|---|
| J2000 | J2000 | deg2 | arcsec pix-1 | ||
| COSMOS | 10:00:28 | +02:12:21 | 1.8 | F814W | 0.05 |
| AEGIS | 14:17:00 | +52:30:00 | 0.197 | F606W & F814W | 0.03 |
| GEMS | 03:32:25 | -27:48:50 | 0.21 | F606W & F850LP | 0.03 |
| GOODS-S | 03:32:30 | -27:48:20 | 0.07 | F606W & F850LP | 0.03 |
| GOODS-N | 12:36:55 | +62:14:15 | 0.07 | F606W & F775W | 0.03 |
| Field | total | spec- | |||
|---|---|---|---|---|---|
| COSMOS | 31 714 | 3 116 | 14 139 | 7 259 | 10 316 |
| AEGIS | 2 848 | 1 451 | 1 588 | 576 | 684 |
| GEMS | 3 595 | 1 382 | 2 267 | 793 | 535 |
| GOODS-S | 852 | 524 | 482 | 199 | 171 |
| GOODS-N | 843 | 648 | 749 | 74 | 20 |
| total | 39 852 | 7 121 | 19 225 | 8 901 | 11 726 |
| ZEST type | |||
|---|---|---|---|
| 1.0 | 13 | 130 | 2 596 |
| 2.0 | 24 | 158 | 1 966 |
| 2.1 | 570 | 2 892 | 2 760 |
| 2.2 | 4 162 | 2 530 | 1 082 |
| 2.3 | 7 115 | 723 | 698 |
| 3.0 | 1 796 | 497 | 392 |
| total | 13 680 | 6 930 | 9 494 |
| ID | Morph ID | Survey | HR | AGN Type | |||
|---|---|---|---|---|---|---|---|
| 1 | 13033960 | AEGIS-X | 0.763 | 5.352 | -0.36 | I | |
| 2 | 20006036 | XMM-COSMOS | 0.661 | 0.6978 | 5.448 | 0.47 | II |
| 3 | 20016006 | C-COSMOS | 0.932 | 1.181 | 0.23 | I | |
| 4 | 20016854 | C-COSMOS | 0.853 | 1.152 | 1.0 | I | |
| 5 | 20038166 | C-COSMOS | 0.654 | 2.157 | -1.0 | II | |
| 6 | 20043608 | C-COSMOS | 0.497 | 0.474 | 1.248 | 1.0 | I |
| 7 | 20067818 | C-COSMOS | 0.689 | 3.044 | 1.0 | I | |
| 8 | 20091912 | C-COSMOS | 0.984 | 7.940 | -1.0 | II | |
| 9 | 20096276 | C-COSMOS | 0.847 | 9.176 | -0.29 | II | |
| 10 | 20101857 | C-COSMOS | 0.651 | 0.6328 | 5.340 | -0.17 | I |
| 11 | 20116906 | C-COSMOS | 0.717 | 2.955 | 1.0 | I | |
| 12 | 20124624 | C-COSMOS | 0.934 | 6.306 | 1.0 | I | |
| 13 | 20145070 | XMM-COSMOS | 0.804 | 5.517 | -0.52 | I | |
| 14 | 20183465 | C-COSMOS | 0.728 | 7.158 | -1.0 | II | |
| 15 | 20188370 | XMM-COSMOS | 0.406 | 2.053 | -0.27 | I | |
| 16 | 20195289 | XMM-COSMOS | 0.968 | 2.762 | -0.42 | I(II spec) | |
| 17 | 50007691 | CDF-N | 0.77 | 0.7517 | 3.416 | -0.078 | II |
| 18 | 50016371 | CDF-N | 0.56 | 0.6645 | 7.635 | -0.052 | II |
| 19 | 90002361 | E-CDF-S | 0.673 | 5.615 | 0.162 | II | |
| 20 | 90003063 | E-CDF-S | 0.755 | 6.739 | -0.26 | I | |
| 21 | 90004178 | E-CDF-S | 0.960 | 6.621 | 0.050 | II | |
| 22 | 90004955 | E-CDF-S | 0.633 | 1.605 | -0.049 | II | |
| 23 | 90011317 | CDF-S | 0.622 | 6.281 | 0.550 | II | |
| 24 | 90011476 | E-CDF-S | 0.572 | 2.262 | -0.059 | II | |
| 25 | 90014273 | CDF-S | 0.750 | 5.598 | 0.386 | II | |
| 26 | 90021223 | CDF-S | 0.507 | 1.943 | 0.299 | II | |
| 27 | 90021708 | CDF-S | 0.628 | 2.865 | 0.089 | II | |
| 28 | 90028848 | E-CDF-S | 0.686 | 0.72 | 8.066 | 0.039 | II |
| 29 | 90033648 | CDF-S | 0.789 | 0.784 | 2.821 | -0.104 | II |
| 30 | 90038381 | E-CDF-S | 0.554 | 2.090 | 0.423 | II |
Note. — Column (1) indicates the catalogue object ID. Column (2) lists the original X-ray catalogue of each source. Columns (3)–(4) refer to the spectroscopic and photometric redshift. Column (5) is the rest-frame luminosity expressed in erg s-1. Column (6) is the hardness ratio. Column (7) indicates the AGN type.
| ID | ID MORPH | |||||
|---|---|---|---|---|---|---|
| (mag/arcsec2) | (arcsec) | (mag/arcsec2) | (arcsec) | |||
| 1 | 13033960 | |||||
| 2 | 20006036 | |||||
| 3 | 20016006 | |||||
| 4 | 20016854 | |||||
| 5 | 20038166 | |||||
| 6 | 20043608 | |||||
| 7 | 20067818 | |||||
| 8 | 20091912 | |||||
| 9 | 20096276 | |||||
| 10 | 20101857 | |||||
| 11 | 20116906 | |||||
| 12 | 20124624 | |||||
| 13 | 20145070 | |||||
| 14 | 20183465 | |||||
| 15 | 20188370 | |||||
| 16 | 20195289 | |||||
| 17 | 50007691 | |||||
| 18 | 50016371 | |||||
| 19 | 90002361 | |||||
| 20 | 90003063 | |||||
| 21 | 90004178 | |||||
| 22 | 90004955 | |||||
| 23 | 90011317 | |||||
| 24 | 90011476 | |||||
| 25 | 90014273 | |||||
| 26 | 90021223 | |||||
| 27 | 90021708 | |||||
| 28 | 90028848 | |||||
| 29 | 90033648 | |||||
| 30 | 90038381 |
Note. — Column (1) indicates the catalogue object ID. Columns (2)–(4) refer to the Sérsic profile parameters: sufrace britghness, , scale length, , and the Sérsic index . Columns (5)–(6) are the corresponding disc profile coefficients.
.