redMaPPer III: A Detailed Comparison of the Planck 2013 and SDSS DR8 RedMaPPer Cluster Catalogs
Abstract
We compare the Planck Sunyaev-Zeldovich (SZ) cluster sample (PSZ1) to the Sloan Digital Sky Survey (SDSS) redMaPPer catalog, finding that all Planck clusters within the redMaPPer mask and within the redshift range probed by redMaPPer are contained in the redMaPPer cluster catalog. These common clusters define a tight scaling relation in the richness-SZ mass (–) plane, with an intrinsic scatter in richness of . The corresponding intrinsic scatter in true cluster halo mass at fixed richness is . The regularity of this scaling relation is used to identify failures in both the redMaPPer and Planck cluster catalogs. Of the 245 galaxy clusters in common, we identify three failures in redMaPPer and 36 failures in the PSZ1. Of these, at least 12 are due to clusters whose optical counterpart was correctly identified in the PSZ1, but where the quoted redshift for the optical counterpart in the external data base used in the PSZ1 was incorrect. The failure rates for redMaPPer and the PSZ1 are and respectively, or 9.8% in the PSZ1 after subtracting the external data base errors. We have further identified 5 PSZ1 sources that suffer from projection effects (multiple rich systems along the line-of-sight of the SZ detection) and 17 new high redshift () cluster candidates of varying degrees of confidence. Should all of the high-redshift cluster candidates identified here be confirmed, we will have tripled the number of high redshift Planck clusters in the SDSS region. Our results highlight the power of multi-wavelength observations to identify and characterize systematic errors in galaxy cluster data sets, and clearly establish photometric data both as a robust cluster finding method, and as an important part of defining clean galaxy cluster samples.
keywords:
cosmology: clusters1 Introduction
The abundance of galaxy clusters as a function of mass is a well known cosmological probe (Henry et al., 2009; Oukbir & Blanchard, 1992; Bartlett & Silk, 1993; Eke et al., 1996; Viana & Liddle, 1996; Vikhlinin et al., 2009; Rozo et al., 2010; Mantz et al., 2010, and many others). As such, it is of critical importance for galaxy cluster surveys to control the level of systematic failures in the cluster selection and redshift assignment, lest the corresponding cosmological inferences be biased.
One way to test a particular cluster selection algorithm is to utilize multi-wavelength data to establish the scaling relations of galaxy clusters: gross deviations from the mean behavior can be used to flag systems that may be subject to otherwise unsuspected systematic effects. In Rozo & Rykoff (2013, hereafter Paper II) we performed an extended analysis of this type in order to characterize the failure rate in the recently published Sloan Digital Sky Survey (SDSS) redMaPPer cluster catalog (Rykoff et al., 2013, hereafter Paper I). In this context, “failure” refers to either false cluster identifications or incorrect cluster property assignments, e.g., redshifts and/or richness. In that work, we estimated the redMaPPer failure rate at .
Paper II was limited partly by the availability of X-ray data at higher redshifts, partly by the large statistical noise in how X-ray luminosity traces cluster mass, and mostly by the lack of high-resolution X-ray data for complete optical samples. Consequently, Planck data on a large number of galaxy clusters provides additional critical consistency tests to help better characterize failures in the redMaPPer cluster finding algorithm. We note that while in Paper II we did in fact consider Planck Sunyaev-Zeldovich (SZ) data in our analysis, at the time only the early Planck SZ results had been published, which did not allow for the significantly more detailed analysis performed in the present work. Here, we extend the analysis of Paper II to include the newly released Planck SZ cluster sample (PSZ1, Planck Collaboration XXIX, 2013, hereafter PXXIX).
Our analysis also tests the robustness of the PSZ1 cluster selection algorithm, complementing the validation presented in PXXIX with the well-characterized redMaPPer optical catalog. While PXXIX encountered difficulty in using their selected optical samples to uniquely identify PSZ1 sources, we demonstrate that this difficulty is not endemic to photometric cluster catalogs. Specifically, the redMaPPer galaxy cluster richness produces a well defined, tight scaling relation with SZ mass proxies, and outliers of this relation always signal a systematic error in either the redMaPPer or the PSZ1 cluster catalogs. Our results firmly establish optical data as a critical component of multi-wavelength efforts aimed at defining well controlled, fully characterized galaxy cluster samples.
2 Data
2.1 The Planck XXIX Cluster Catalog
The Planck satellite (Tauber et al., 2010) was launched on May 14, 2009, as the third generation space mission dedicated to cosmic microwave background observations. The Planck payload consists of two instruments, the Low Frequency Instrument covering 30, 44 and 70 GHz (Bersanelli et al., 2010; Mennella et al., 2011), and the High Frequency Instrument with bands centered at 100, 143, 217, 353, 545, and 857 GHz (Lamarre et al., 2010; Planck HFI Core Team, 2011), with angular resolution varying from 33′to 5′. A series of early results were published in 2011 (Planck Collaboration I, 2011), and the first cosmology results were published in 2013 along with 15.5 months of science data (Planck Collaboration I, 2013).
The PSZ1 is based on the first 15.5 months of Planck observations (Planck Collaboration XXIX, 2013). The SZ detection uses the six highest Planck frequency channels, spanning 100 GHz to 857 GHz. Prior to detecting SZ sources, a Galactic mask and a point source mask based on the Planck Catalogue of Compact Sources (Planck Collaboration XXVIII, 2013) are applied. The resulting holes in the maps are filled in prior to searching for SZ sources, and the catalog is trimmed around the mask. SZ sources are detected using three different types of algorithms: 2 matched filter algorithms (MMF1, MMF3, Melin et al., 2006) and a Bayesian finder called Powell–Snakes (PwS, Carvalho et al., 2012). All three algorithms place priors on the cluster spectral and spatial characteristics, which are in turn employed to distinguish SZ sources from random noise fluctuations. A comparison of various SZ cluster selection algorithms is presented in Melin et al. (2012).
After running each of the three cluster finders, all sources are collated into a master catalog, which is cleaned for obvious contamination based on the Planck high frequency spectral information. The SZ signal strength, measured by the integrated Compton- parameter , of the remaining sources is typically strongly degenerate with the cluster size, a problem that is resolved by the use of informative priors on the relation between and cluster size. Since cluster radii are typically defined in terms of matter overdensity criteria, such a prior takes the form of a fiducial – relation, so that a by-product of the measurement is a cluster mass estimate for each system. PXXIX utilizes the – relation of Arnaud et al. (2010) for these purposes, and a full description of the algorithm will appear in a future publication (Arnaud et al., in preparation, see also Gruen et al., 2013).
In a detailed study, Rozo et al. (2012a, b, c) noted significant differences in published cluster X-ray mass calibrations and argued that the mass calibration adopted in Arnaud et al. (2010) would lead to tension between observed cluster abundance and the cosmological constraints from the cosmic microwave background (Rozo et al., 2013). This was borne out in the first results from Planck. Consequently, we do not take the “SZ-mass” () reported in PXXIX as an accurate determination of cluster total mass. However, the reported SZ mass is a well defined SZ observable — indeed, it is mathematically equivalent to — and thus it can be used to define scaling relations and to study the regularity of the Planck and redMaPPer cluster samples.
Finally, we note that in order to estimate and the corresponding SZ mass , a cluster redshift is needed for each detection. In the PSZ1, these redshifts are obtained either by cross matching with various catalogs, or through extensive photometric and spectroscopic follow-up of Planck SZ sources. When matching to external catalogs, PXXIX follows a rank-ordered priority list. The top priority is the MCXC catalog (Piffaretti et al., 2011), followed by NED and SIMBAD, followed by redshifts from the Wen et al. (2012) SDSS photometric cluster catalog. A few remaining clusters get their redshifts either from additional external photometric catalogs, or from an internal analysis of SDSS data within the Planck team. Many clusters (more than 200) were also subjects of both photometric and spectroscopic follow-up. The final PXXIX SZ cluster catalog is a compilation of all this data.
Throughout, we only consider the list of galaxy clusters labelled in PXXIX as confirmed systems. We restrict ourselves to systems with reported redshifts in the ranges since is the maximum redshift at which redMaPPer can detect massive clusters in the SDSS with reliable redshift estimates. When considering scaling relations, we exclude clusters with since clusters above this redshift have very large measurement errors in their richness.
2.2 The SDSS DR8 redMaPPer Cluster Catalog
redMaPPer is a new red-sequence photometric cluster finding algorithm which was recently applied to the SDSS Data Release 8 (Aihara et al., 2011). The algorithm and SDSS DR8 catalog is described in detail in Paper I. A detailed comparison of redMaPPer to other photometric cluster finding algorithms is presented in Paper II, which also includes a multi-wavelength study of the performance of redMaPPer in the SDSS.
Briefly, redMaPPer iteratively self-trains a model of red-sequence galaxies calibrated by exploiting an initial seed spectroscopic galaxy sample. The associated spectroscopic requirements are minimal, and easily satisfied by existing SDSS spectroscopy. Once the red-sequence model has been trained, the algorithm attempts to grow a galaxy cluster centered about every SDSS photometric galaxy. The galaxies are first rank-ordered according to their likelihood of being a central galaxy. Once a rich galaxy cluster has been identified (, where is the number of red-sequence galaxies hosted by the cluster), the algorithm iteratively determines a photometric redshift based on the calibrated red-sequence model, and recenters the clusters about the best cluster center, as gauged from the photometric data. The final published cluster catalog is then further trimmed to a richness limit of for . Above this redshift, the catalog becomes “flux” limited due to the SDSS survey depth, and the richness limit increases rapidly with redshift. Roughly speaking, richness measurements are reliable out to . For , clusters can be detected, but their richness measurements become very noisy. When run on SDSS data, automated cluster finding is not really feasible with the redMaPPer algorithm above redshift .
In what follows, we will match the Planck cluster catalog to the redMaPPer cluster catalog. One obvious concern of this type of exercise is that a Planck cluster may go unmatched if the system falls below the redMaPPer detection threshold. In order to minimize this possibility, we always match the Planck catalog to our own private redMaPPer catalog, which lowers the detection threshold from to . Doing so increases the redMaPPer cluster sample by almost a factor of 16, from clusters to systems. As it turns out, however, all good Planck–redMaPPer cluster matches result in pairs of richness .
2.3 The MCXC Cluster Catalog
The Meta-Catalogue of X-ray Clusters (MCXC: Piffaretti et al., 2011) is a compilation of galaxy clusters based on publicly available X-ray data from both the ROSAT All Sky Survey (RASS: Voges et al., 1999) and serendipitous searches in ROSAT pointed observations. The RASS contributing catalogs are NORAS (Böhringer et al., 2000), REFLEX (Böhringer et al., 2004), BCS (Ebeling et al., 1998), SGP (Cruddace et al., 2002), NEP (Henry et al., 2006), MACS (Ebeling et al., 2001), and CIZA (Ebeling et al., 2002; Kocevski et al., 2007), while the contributing serendipitous catalogs are 160D (Mullis et al., 2003), 400D (Burenin et al., 2007), SHARC (Romer et al., 2000), WARPS (Horner et al., 2008), and EMSS (Gioia et al., 1990). The data from each of the individual galaxy catalogs was collected and homogenized, deleting duplicate entries, and enforcing a consistent X-ray luminosity definition. In the catalog, is defined to be the X-ray luminosity in the 0.1–2.4 keV band within an aperture. We will use this catalog as a baseline for understanding the centering offset distribution between the Planck and redMaPPer cluster centers.
3 Analysis of PSZ1 Clusters
3.1 Cluster Matching
We match the PSZ1 to the SDSS DR8 redMaPPer catalog using a simple angular matching algorithm. To match the two catalogs, we rank order the PSZ1 clusters by signal-to-noise (S/N). Starting from the top (largest S/N) cluster, we define its match as the richest redMaPPer system within of the reported Planck detection. If a match is found, the corresponding redMaPPer system is removed from the list of candidate redMaPPer matches, and we move on to the next PSZ1 cluster. We emphasize that our matching criteria does not impose any restrictions on the redshifts of matched cluster pairs. This is purposely so, as we wish to compare the redshifts reported in the two cluster catalogs. Of course, this also implies that all Planck–redMaPPer cluster pairs should only be considered tentative associations, pending the results of our full analysis, summarized in Section 3.5.
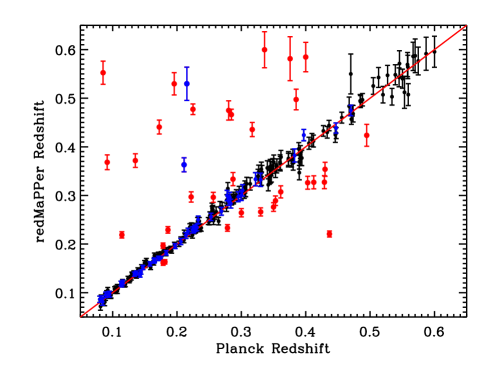
Figure 1 compares the PSZ1 cluster redshifts to those of the matched redMaPPer clusters. We restrict ourselves to the redshift range , where the redMaPPer redshifts are expected to be accurate. There are 245 PSZ1 systems in this redshift range within our angular mask, 35 of which show up as redshift outliers. These outliers will be discussed in Section 3.4. For now, we will focus on the sub-sample of galaxy clusters where the two redshift estimates agree. This way, by characterizing the relation between optical and SZ data first using our well matched clusters, we can later on use this information to resolve the redshift conflicts shown in Figure 1.
3.2 The – Scaling Relation:
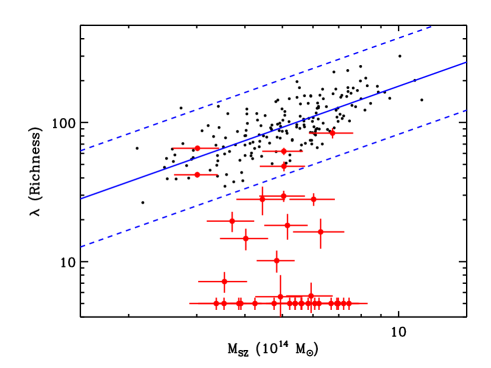
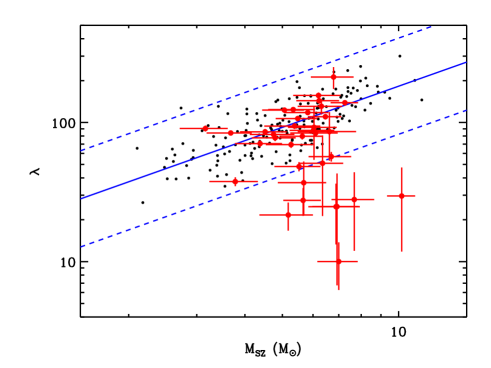
We consider the – relation of the galaxy clusters for which the PSZ1 and redMaPPer redshifts agree. Since the richness errors become very large at , we further restrict our analysis to systems with redMaPPer redshift (this is the redshift assigned by redMaPPer photometry). This results in a sample of 191 galaxy clusters, shown in Figure 2. We see that there is a tight relation between the redMaPPer cluster richness and the SZ-mass , though the existence of a small outlier population with low richness and high SZ mass is immediately apparent.
We have fit this data using the Bayesian fitter employed in Rozo et al. (2012d), with an automated outlier rejection of outliers. We find
| (1) | |||||
| (2) | |||||
| (3) | |||||
| (4) |
If we assume no intrinsic covariance between cluster richness and SZ signal at fixed mass, and an intrinsic scatter of the SZ-based mass estimates of (20%), the corresponding estimate of the intrinsic scatter in true halo mass at fixed richness is (17%) (see Rozo et al., 2012b, for how the observed scatter is related to the desired scatter ). These values are broadly consistent with those derived in Paper II based on . Our results are also robust to lowering the maximum cluster redshift .
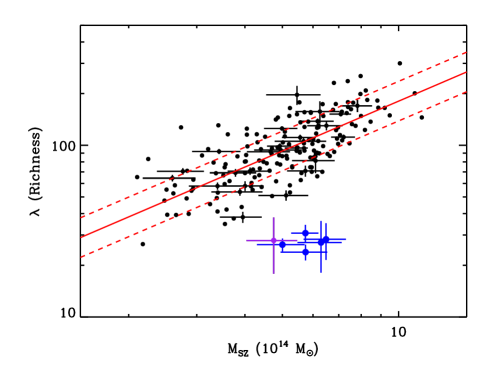
Our algorithm identifies five outliers. The first of these is Abell 963 (Planck 617), which was identified in Paper II as having a systematically low richness because of a small region of bad photometry around a bright star in SDSS. For the remaining four outliers, we find no similar redMaPPer failures, suggesting that the SZ detection by Planck is not sourced by the redMaPPer cluster, and therefore that the assigned PSZ1 cluster redshift is incorrect. In all four cases, visual inspection of the corresponding SDSS and WISE fields revealed galaxy overdensities with faint, very red optical counterparts, suggesting all four are good high redshift () cluster candidates. These clusters are Planck 1093, 719, 729, and 441. The RA and DEC of the corresponding candidate galaxy overdensities are reported in Table 3, which includes DR8 photometric or spectroscopic redshifts where available.
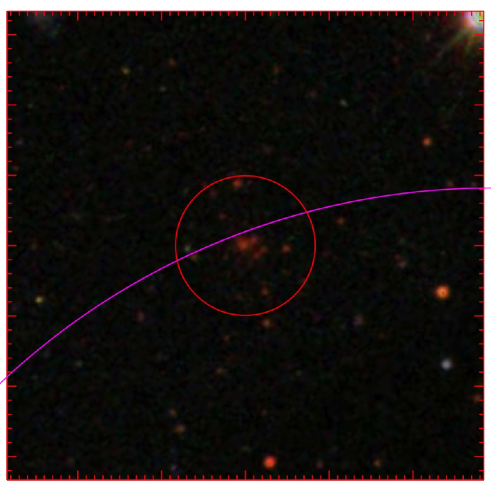
We note that there is one additional system that appears to be an outlier by eye, Planck 299. The cluster is not flagged as an outlier by our automated algorithm because of its large richness error bar. The redMaPPer match is located away from the reported PSZ1 location. Visual inspection of the SDSS field reveals a very obvious high redshift () cluster match away, located at , , shown here in Figure 3. Thus, we consider our automated redMaPPer association (and therefore the PSZ1 redshift) incorrect. Of course, a definitive statement would require confirmation of our proposed cluster match, and for said cluster to obey either X-ray–SZ or optical–SZ scaling relations.
Before we move on, we emphasize that this analysis does not properly account for selection effects, so we caution against relying on the above scaling relation for precision work. Our only goals in this work are to demonstrate the existence of a tight scaling relation, to highlight the regularity of optical richnesses as a mass tracer, and to demonstrate the utility of optical data in understanding and improving the Planck SZ cluster catalog.
In short, of the 210 non-redshift outliers in Section 3.1, only 191 have . These define a tight scaling relation, from which we estimate a scatter in mass at fixed richness of . There are, however, 6 outliers. One outlier is due to bad photometry in SDSS, while the remaining five systems were incorrectly associated by our matching algorithm and thus have incorrect redshifts in PSZ1. Visual inspection reveals possible high redshift () counterparts for all five of these systems. Interestingly, all 6 of these systems were SZ sources matched to low richness clusters in the Wen et al. (2012), Hao et al. (2010), or Szabo et al. (2011) catalogs.
3.3 Cluster Centering
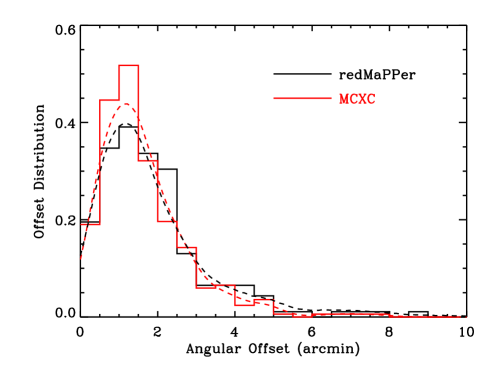
Figure 4 shows the distribution of angular offsets of the PSZ1 clusters relative to the redMaPPer centers. As in the previous section, we restrict our analysis to galaxy clusters where the redMaPPer and PSZ1 redshifts agree. Moreover, we remove from the sample the six galaxy clusters identified as erroneous cluster matches in Section 3.2. For comparison, we also show the corresponding distribution for Planck–MCXC cluster matches (red histogram). The two offset distributions (Planck–redMaPPer and Planck-MCXC) are not consistent with each other, as determined via a KS test. We attribute this difference to miscentering in the optical. To test this hypothesis, we first use a Kernel Density Estimator (red dashed line) to obtain a smooth model of the Planck–MCXC centering distribution. This model is then convolved with a simple miscentering model for redMaPPer systems, in which 85% of the clusters are correctly centered, and the remaining 15% have a centering offset that is uniformly distributed out to . The resulting distribution of angular offsets is the black dashed line. A KS test reveals that the model is consistent with the observed distribution for Planck–redMaPPer matches. We note that the difference between the black and red dashed curves in Figure 4 is relatively minor: optical miscentering acts to transfer a small but non-negligible amount of probability from the peak at separation to a tail at separation.
We have visually inspected all galaxy clusters where the offset relative to redMaPPer is larger than . There are ten such clusters. Of these, two clusters, Planck 278 and 445, appear to be simple statistical fluctuations in the centering offsets, which are and respectively. That is, the Planck–redMaPPer matches appear to be reasonable, and we do not find other structures within the field of view; the clusters simply appear to populate the large centering offset tail of the distribution. Four clusters (Planck 728, 249, 472, and 587) are systems with two obvious galaxy clumps, which not surprisingly can lead to large offsets when the SZ center falls closer to the opposite component from that selected by redMaPPer, but it is not entirely clear which component is dominant. In this context, we do not rely heavily on the Planck centering since Planck centers are themselves highly uncertain, and in some cases our visual inspection suggests that the main cluster component is the one that is further from the Planck position (Planck Collaboration XXIX, 2013). A more definitive statement about these clusters will require high resolution X-ray data. One cluster (Planck 113) is an obvious case of optical miscentering based on visual inspection of the field.
One cluster (Planck 280) is matched to a rich redMaPPer cluster (, ), but the match is () away. We were able to identify a galaxy overdensity in SDSS and WISE that may be a better match to this Planck detection, at , , . The quoted photoz is that of the putative central galaxy. We expect our original tentative association is incorrect, and that the Planck detection corresponds to a high redshift galaxy cluster. We note the angular distance to Planck 280 is , so it is also possible that the system is suffering from projection effects.
Of the remaining two clusters, cluster Planck 77 may or may not be a statistical fluctuation. The centering offset to its redMaPPer match is very large, , and the optical center is obviously correct upon visual inspection. However, Planck 77 is a low redshift cluster (), so the observed offset is in fact less than the assigned angular radius. We are also unable to identify galaxy overdensities in WISE that suggest a high redshift cluster. Finally, we note, however that Planck 77 is a low S/N system that is only detected by one of the three algorithms used to construct the PSZ1 sample (Planck Collaboration XXIX, 2013). Because of the large angular offset and the fact that the cluster is only detected by one of the three cluster finding algorithms, we consider Planck 77 a possible false detection.
The remaining large centering offset cluster is Planck 52, which PXXIX notes forms a complicated triple system with Planck 51 and Planck 53. With redMaPPer we are able to shed considerable light on the region. The entire field containing clusters Planck 51 through 53 is shown in Figure 5. The southernmost rich redMaPPer cluster is RM 1195 (, , member galaxies in red), which is matched to Planck 51. Note, however, that Planck 51 sits directly on top of RM 11143 (, , member galaxies in cyan). This suggests that Planck 51 is picking up the SZ signal of the richer redMaPPer cluster RM 1195, but that the Planck detection is miscentered due to a projection effect in the SZ between RM 1195 and RM 11143, pulling the SZ detection towards the latter system.
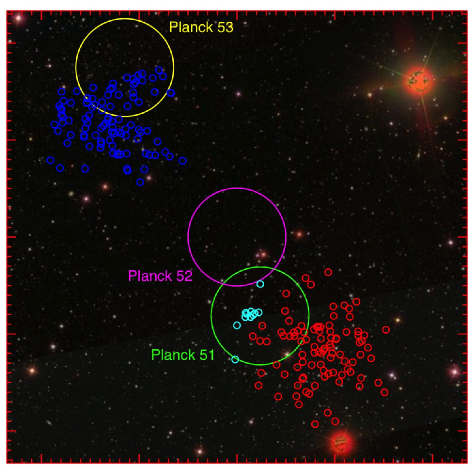
The northernmost Planck cluster is Planck 53, which is a good match to RM 689 (, , member galaxies in blue). Note that the spectroscopic redshifts of Planck 51 and Planck 53 are significantly different ( vs ), corresponding to a line of sight distance of , or nearly , suggesting these structures are not correlated.
This leaves us with Planck 52, which sits on an essentially empty piece of sky, roughly halfway between Planck 51 and Planck 53. It has three candidate matches with richness , two of which are better associated with Planck 51 (RM 1995 and RM 11143 discussed above), and one of which is clearly associated with Planck 53. We have inspected both the SDSS and WISE images for a possible high redshift cluster counter part, but were unable to find one.
To explain the origin of Planck 52, we recall that the PSZ1 is the union of three distinct cluster finding algorithms, two matched filter methods (MMF1 and MMF3) and a Baysian source detector called Powell–Snakes (PwS). Clusters Planck 51 and 53 were only detected by the PwS method, while Planck 52 was only detected by the MMF3 method (Planck Collaboration XXIX, 2013). This strongly suggests that the MMF3 detection is a blend of the Planck 51 and Planck 53 clusters, explaining why it sits in between the two systems and has no good redMaPPer association. This is consistent with the large positional error assigned by MMF3 to this detection. In short, we consider Planck 51 as affected by projection effects in the SZ, Planck 52 we flag as a false detection (really, a blend of Planck 51 and 52), and Planck 53 is robustly associated with RM 689.
In short, of the ten clusters with large angular separations, two we consider good matches, four are double clusters, one is an obvious case of optical miscentering, one is a high redshift cluster candidate, and two are labeled as false detections.
3.4 Redshift Outliers
We now turn our attention to the 35 redshift outliers in Figure 1. These outliers could arise in one of three ways. If the Planck and redMaPPer clusters have been properly matched, then either the PXXIX redshift is incorrect, or the redMaPPer redshift is incorrect. Alternatively, the matching algorithm may have failed. We now determine the origin of each of the redshift conflicts identified in Figure 1.
3.4.1 Visual Inspection
To begin with, we check our cluster matching by visually inspecting the SDSS and WISE images for each of the PSZ1 clusters that resulted in a redshift conflict in Section 3.1. Our goal is to ensure that every PSZ1 cluster is matched to the best possible redMaPPer match. We emphasize that “best possible” does not mean correct; we sometimes find Planck sources that have no convincing redMaPPer match. In such cases, we let the original match stand, with the expectation that subsequent analysis will confirm those clusters as poor matches. It should also be noted that “unconvincing” is a qualitative decision made by us based on the visual inspection. Quantitative tests will be presented in subsequent sections. Our visual inspection also revealed several Planck detections where the SZ signal is likely to be affected by projection effects, i.e., there are multiple rich galaxy clusters along the line-of-sight of the Planck detection. These clusters are flagged as such.
| Cluster | PSZ1- | Comment | |
|---|---|---|---|
| 513 | 0.211 | 0.363 0.014 | . |
| 1216 | 0.215 | — | Matching procedure failure due to redMaPPer incompleteness. |
| 391 | 0.350 | 0.275 0.009 | DR8 photo-: . |
| 732 | 0.225 | — | . SZ-projection with cluster at . |
| 1128 | 0.085 | — | . SZ-projection with cluster at . |
| 660 | 0.222 | 0.293 0.010 | . |
| 622 | 0.495 | — | Unconvincing. Possible high match, , . |
| 484 | 0.317 | — | Unconvincing. Possible high match, , , . |
| 316 | 0.430 | 0.352 0.014 | |
| 537 | 0.353 | 0.287 0.010 | |
| 73 | 0.0916 | — | SZ-projection of clusters at and . |
| 888 | 0.412 | 0.330 0.014 | |
| 500 | 0.280 | 0.514 0.039 | Bad SDSS photometry. |
| 222 | 0.181 | 0.162 0.005 | |
| 865 | 0.278 | 0.234 0.007 | |
| 303 | 0.300 | 0.274 0.009 | |
| 97 | 0.361 | 0.310 | Possible projection, but one candidate ruled out by scaling relation. |
| 668 | 0.287 | 0.329 0.013 | |
| 574 | 0.196 | — | Unconvincing. Possible high match, and , . |
| 510 | 0.330 | — | Projection of two clusters with no obvious best match. |
| 443 | 0.437 | 0.221 | Possible projection, but one candidate ruled out by scaling relation. |
| 764 | 0.285 | 0.454 0.011 | |
| 216 | 0.336 | 0.359 0.016 | . Original match incorrect, see Appendix. |
| 1123 | 0.114 | 0.219 0.006 | . See text for discussion. |
| 308 | 0.178 | 0.196 0.005 | DR8 photo-: . |
| 768 | 0.403 | — | Unconvincing. Possible high match, , , . |
| 779 | 0.256 | 0.294 0.010 | . |
| 292 | 0.186 | 0.229 0.007 | . |
| 234 | 0.400 | — | DR8 photo-: . SZ-projection with cluster at . |
| 678 | 0.376 | — | Unconvincing. Possible high match, , , . |
| 376 | 0.178 | — | Unconvincing. Possible SZ projection of clusters at and . |
| 505 | 0.172 | — | Unconvincing. Possible high match, , , . |
| 416 | 0.135 | 0.373 0.014 | DR8 photo-: . |
| 527 | 0.385 | — | Unconvincing. Possible high match, , , . |
| 13 | 0.429 | 0.325 0.013 |
Our results are summarized in Table 1. The table includes both the PSZ1 redshift, and the redMaPPer photometric redshift of the best redMaPPer match as determined from visual inspection. When a match is ambiguous, we do not report a redMaPPer redshift. In the cases where a correct cluster redshift can be unambiguously identified, the corresponding redshift is written in bold. In brief, we find
-
•
3 clusters where we confirm that the PSZ1 redshift is correct (Planck 1216, 500, and 216). The original redshift conflicts were due to two incorrect cluster associations (including one incorrect match due to redMaPPer incompleteness), and one incorrect redMaPPer redshift due to bad SDSS photometry.
-
•
19 clusters where we confirm that the original association with redMaPPer clusters is correct, and the redMaPPer redshift is correct.
-
•
8 unconvincing cluster matches. For these clusters, we expect the PSZ1 redshift to be incorrect, and for our best redMaPPer match to prove unsatisfactory as well. In 7/8 cases, our visual inspection reveals a candidate high redshift match for the Planck detection, with varying degrees of confidence.
-
•
5 clusters where the SZ signal appears to be sourced by an SZ-projection effect. These are Planck 732, 1128, 73, 510, and 376.
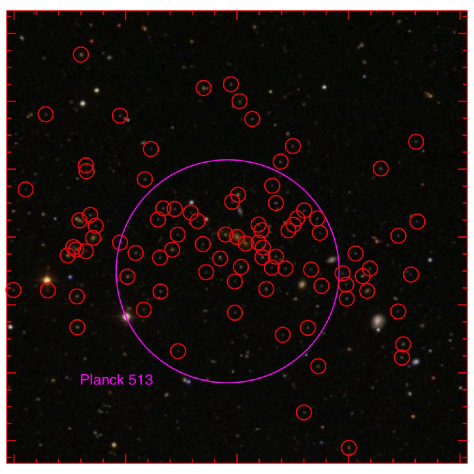
Comments on individual systems can be found in Appendix A. Here, we showcase only two systems. The first is cluster Planck 513, which is the only PSZ1 cluster in the SDSS region that belongs to the Planck cosmology sample in Planck Collaboration XX (2013) and has been assigned an incorrect redshift. The SDSS image of this SZ source is shown in Figure 6. There is an obvious cluster in the image (RM 87), which itself has an obvious central galaxy. The central galaxy has a spectroscopic redshift available, from which we see . There are also multiple spectroscopic members that confirm this redshift. By contrast, the assigned redshift in PXXIX is . This redshift was matched to Abell 1430, and the association is correct, but the cluster redshift taken from SIMBAD is clearly erroneous. We have chosen to highlight this cluster because it formed part of the cosmology sample in Planck Collaboration XX (2013), not because it is a particularly egregious example of an incorrect redshift: there were multiple cluster for which the correct cluster redshift was equally obvious.
The second system we would like to highlight is Planck 510, which is a spectacular example of an SZ projection. The SDSS image centered on the Planck detection is shown in Figure 7. The purple circle is in radius, and is centered at the Planck location. There are two nearby rich redMaPPer clusters, RM 128 and RM 141. We have circled all cluster members with membership probability and luminosity for each of these clusters in red and cyan, respectively. Here, is the probability threshold accounting for 80% of the membership probability of the clusters, i.e.,
| (5) |
We use this criterion for showing cluster galaxies to ensure comparable membership selection between the low and high redshift clusters.111Had we used a fixed probability cut (say ), we would have selected more members for the low redshift cluster than for the high redshift cluster because membership assignment is less secure at high redshifts. By applying a probability threshold that is based on a fixed fraction of the cluster richness, we ensure that comparable fractions of cluster members are selected.
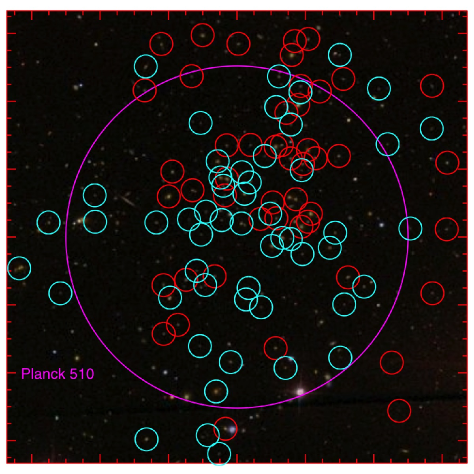
We see from Figure 7 that the two redMaPPer clusters are obviously collocated in the sky, and both coincide with the Planck SZ detection. Both systems have 5 members with spectroscopic redshifts, from which we derive cluster redshifts and . These compare well with the redMaPPer photometric redshift estimates and . In short, there is no doubt that these clusters are two separate systems projected along the line of sight, and that the deprojection by redMaPPer via photometric data was successful. The richnesses of the two clusters are and respectively, which demonstrates that neither system is obviously dominant. It is difficult to imagine a more spectacular example of an SZ projection effect.
3.4.2 Validation Tests for the PSZ1 Redshifts
We use the – relation from Section 3.2 as a validation test of the PSZ1 cluster redshifts. Specifically, let us assume that for each of our redshift conflicts, the PSZ1 redshifts are correct. Papers I and II demonstrated that the failure rate of the redMaPPer photometric redshifts is below 1%. Consequently, if the PSZ1 redshifts are correct, we ought to be able to find good redMaPPer matches to the PSZ1 systems by redoing our rank-ordered circular matching while adding the additional constraint that the redMaPPer matches must be consistent () with the PSZ1 cluster redshifts. In addition, based on our results in Section 3.3, we only look for cluster matches within of the Planck sources.
Our visual inspection indicates that for the majority of the 35 redshift outliers identified in Section 3.1, the PSZ1 redshifts are incorrect. To test this, we perform the above matching — including the redshift consistency requirement — and compare how these 35 galaxy clusters populate the – plane relative to the 185 galaxy clusters that defined – relation in Section 3.2. Any PSZ1 clusters that go unmatched are arbitrarily assigned a richness , the minimum richness of the galaxy clusters in our full redMaPPer catalog.
Our results are shown in Figure 8. The solid blue line is the mean – relation (see Fig. 2), while the dashed lines mark the band. Of our 35 original outliers, only 5 clusters can plausibly be matched assuming the PSZ1 redshift. In decreasing order of S/N, these are Planck 732, 1128, 73, 510, and 216. Turning to the results from our visual inspection (Section 3.4.1 and Table 1), we see that the first 4 systems were identified as SZ-projections of multiple clusters, while the last system is one for which our original matching was incorrect. The IDs of the projection clusters are given in Table 3. The remaining 30 outliers break into 28 incorrect redshifts in PSZ1 and two redMaPPer failures (1 incompleteness, 1 bad photometry, Planck 1216 and 500 respectively).
We note that despite the fact that four of the five clusters we flagged as SZ projection are non-outliers in the – plane, we should not consider this as evidence that the PSZ1 redshift is appropriate. Indeed, in the following section, we find that these systems do not appear as outliers when we remeasure using the assigned redMaPPer redshift either. In other words, the fundamental problem for these systems is that these projection effects cannot be assigned a single, unambiguous redshift: the SZ detection is fundamentally a combination of more than one structure along the line-of-sight.
3.4.3 Validation Tests for the redMaPPer Redshifts
We now perform the converse analysis to that of Section 3.4.2, that is, we take the 35 redshift conflicts from Figure 1 and assume that the automatically assigned redMaPPer match is correct. We then remeasure for each of these 35 systems, holding the Planck location fixed, but adopting the redshift of the assigned redMaPPer cluster as the correct redshift.
Our visual inspection of the redshift outliers suggests that we will be able to confirm 19 cluster redshifts as correct. In addition, it is possible for the five systems labeled as SZ-projections to appear to be acceptable cluster matches, for a total of 24 expected non-outliers. The remaining 11 systems (8 unconvincing clusters, 3 clusters where the PSZ1 redshift is correct) we expect will be outliers in the – plane.
As shown in Figure 9, this is almost exactly what we find. The solid blue line in the Figure is the mean – relation, while the dashed lines mark the band. Of the original 35 redshift outliers, nine fall below the intrinsic scatter line. These are the three clusters with correct PSZ1 redshifts, and six of the eight unconvincing cluster matches. However, two of the unconvincing matches are not obvious outliers in the – plane, and therefore remain as plausible cluster matches. These are cluster Planck 376 and 768. Note that Planck 376 is an unconvincing match in part because it may be an SZ projection.
Turning to the remaining clusters labelled as projection effects, we see that these systems do not show up as outliers in the – plane, so the scaling relation test is not able to rule out either the PSZ1 or the redMaPPer redshifts. Thus, the redshift association for these systems is ambiguous. Importantly, the fact that these clusters are not outliers is not due to covariance of the type studied, e.g. in Cohn & White (2009), Noh & Cohn (2012), Angulo et al. (2012), or Rozo et al. (2012b). These clusters are clear projections in the SZ, but they are not optical blends; the clusters are very well separated along the line-of-sight in the optical.
Table 2 below includes the 21 PSZ1 clusters with revised redshifts that result in and values consistent with the cluster scaling relations. These are the 35-9=26 objects, minus the latter five labeled as projection effects. In conjunction with the 185 galaxy clusters that originally defined the – scaling relation, these redshift-corrected systems brings the total number of galaxy clusters establishing the – relation to over 200 clusters.
3.5 Summary of Results
There are 245 Planck SZ-detections in PSZ1 labeled as confirmed that fall within the SDSS redMaPPer footprint with an assigned redshift in the range . These have allowed us to identify three failures in the redMaPPer cluster catalog. One (Planck 1216) is a low () redshift cluster missing from the redMaPPer catalog because of a combination of miscentering and angular masking, reflecting incompleteness in redMaPPer. One (Planck 500) is a redshift failure because of bad photometry in the SDSS, and one (Planck 617, Section 3.2) has an unusually low richness because of bad SDSS photometry. Our estimate of the catastrophic failure rate for the SDSS redMaPPer catalog from this analysis is therefore . In addition, we identified 4 redMaPPer clusters as having two obvious galaxy concentrations, which can lead to large centering uncertainties (Planck 728, 249, 472, and 587, Section 3.3), and one obvious centering failure in redMaPPer (Planck 113, Section 3.3). Note that the centering failure rate of redMaPPer is, in fact, higher, as evidenced by utilizing high resolution X-ray data (Rozo & Rykoff, 2013). The low rate of miscentering identifications from this analysis reflects the fact that Planck cluster centering is noisy.
Our analysis has also allowed us to flag 36 clusters that were assigned an incorrect redshift in PSZ1: five in section 3.2, three in section 3.3, and 28 in sections 3.4.2. For each of the clusters with incorrectly assigned redshifts in the PSZ1, we have assigned the correct cluster redshift where possible, and remeasured at the newly assigned redshift. This is larger than the number of outliers in Figure 1 because some of the clusters that do not show up as outliers in that Figure have incorrect redshifts, as found in Sections 3.2 and 3.3. The corresponding redshift failure rate in the PSZ1 over the SDSS region is . These results are collected in Table 2.
We caution that the PSZ1 failure rate is not easily extrapolated outside the SDSS region, since some of the PSZ1 failures occur because of the reliance on existing optical catalogs in the SDSS region. For instance, the 5 failures from section 3.2 were matched to existing SDSS catalogs, and would have remained as cluster candidates (rather than confirmed clusters) had they fallen outside the SDSS footprint. We have investigated each of the failures identified in this work, and have found that roughly a third of them tracked back to errors in either NED, SIMBAD, or the REFLEX cluster catalog. Another third of the failures are systems in which the association made in the construction of the PSZ1 cluster catalog was incorrect. The remaining third are systems where the origin of the failure is unusual and/or not easily understood. We collect notes on each of the failures we identified in Appendix A.
| Cluster | Redshift | ||
|---|---|---|---|
| 513 | 0.363 0.014 | 7.26 0.59 | 138.8 6.1 |
| 391 | 0.276 0.009 | 6.46 0.64 | 110.1 4.8 |
| 660 | 0.297 0.011 | 5.48 0.67 | 106.8 4.4 |
| 316 | 0.354 0.014 | 6.22 0.79 | 143.4 6.4 |
| 537 | 0.289 0.010 | 5.06 0.63 | 122.9 4.7 |
| 888 | 0.327 0.013 | 5.63 0.71 | 79.7 4.2 |
| 222 | 0.163 0.004 | 3.67 0.49 | 84.1 3.4 |
| 865 | 0.233 0.007 | 4.74 0.63 | 82.0 4.0 |
| 303 | 0.264 0.008 | 4.79 0.62 | 77.6 4.2 |
| 97 | 0.307 0.013 | 5.52 0.75 | 48.2 3.6 |
| 668 | 0.334 0.014 | 5.82 0.76 | 117.9 5.0 |
| 443 | 0.221 0.006 | 3.16 0.45 | 90.6 4.4 |
| 764 | 0.466 0.011 | 6.31 0.83 | 130.8 16.5 |
| 1123 | 0.219 0.006 | 5.27 0.74 | 69.3 3.7 |
| 308 | 0.197 0.005 | 4.51 0.62 | 85.7 3.9 |
| 0.326 0.013 | 5.38 0.89 | 94.3 4.3 | |
| 779 | 0.296 0.010 | 5.33 0.74 | 123.9 4.8 |
| 292 | 0.229 0.007 | 4.38 0.61 | 70.6 3.7 |
| 0.161 0.005 | 3.78 0.54 | 37.6 2.8 | |
| 416 | 0.372 0.014 | 6.20 0.87 | 156.5 7.6 |
| 13 | 0.327 0.013 | 6.10 0.85 | 84.1 4.3 |
It is important to note, however, that some clusters remain with uncertain redshifts, as we were neither able to confirm the PSZ1 redshift as correct, nor to assign a new redshift to the Planck SZ source. In some cases, this is because the Planck SZ detection is associated with two comparably rich clusters that are projected along the line of sight, making a unique association impossible. In other cases, the Planck sources have no acceptable redMaPPer counterpart. In the latter case, we have classified these systems as either high redshift cluster candidates or false detections based on visual inspection of SDSS and WISE data. The set of clusters for which we do not assign a robust redshift is collected in Table 3.
| Cluster | SZ Projection | Non-Detection | Confidence | RA | DEC | |
|---|---|---|---|---|---|---|
| High- Candidate | ||||||
| 299 | — | — | 5 | 231.6383 | 54.1520 | |
| 795 | — | — | 5 | 170.4636 | 15.8030 | |
| 441 | — | — | 5 | 10.7735 | 18.3686 | |
| 400 | — | — | 4 | 3.0807 | 16.4621 | |
| 574 | — | — | 3 | 170.9893 | 43.0600 | |
| 280 | — | — | 3 | 340.6030 | 17.5214 | |
| 650 | — | — | 3 | 176.5397 | 30.8911 | |
| 664 | — | — | 3 | 143.4653 | 28.0855 | |
| 505 | — | — | 2 | 172.23425 | 59.94395 | |
| 527 | — | — | 2 | 21.71503 | -7.20770 | |
| 719 | — | — | 2 | 158.6913 | 20.5628 | — |
| 768 | — | — | 2 | 158.28934, | 13.79361 | |
| 622 | — | — | 1 | 42.8736 | -7.9581 | — |
| 484 | — | — | 1 | 178.1366 | 61.3629 | |
| 678 | — | — | 1 | 147.0918 | 24.7901 | |
| 1093 | — | — | 1 | 193.8617 | 21.1175 | — |
| 729 | — | — | 1 | 140.6389 | 11.6842 | — |
| 732 | — | — | — | — | — | |
| 1128 | — | — | — | — | — | |
| 73 | — | — | — | — | — | |
| 510 | — | — | — | — | — | |
| 234 | — | — | — | — | — | |
| 376 | ? | ? | — | — | — | — |
| 77 | — | ? | — | — | — | — |
| 52 | — | — | — | — | — |
4 Discussion
We have performed a detailed comparison of the SDSS DR8 redMaPPer and PSZ1 cluster catalogs that has enabled us to characterize systematic failures in both. The resulting failure rates are for redMaPPer and for the PSZ1 over the SDSS area. A summary of the various failure modes is presented in Section 3.5.
These results firmly demonstrated that robust photometric cluster finding is possible, and that state-of-the-art photometric cluster finding algorithms like redMaPPer can deliver the necessary cluster samples to exploit near future photometric surveys. Moreover, we have confirmed optical cluster richness as a relatively low-scatter mass proxy ), a result that has now been independently established with three different mass proxies: , , and . We note that this scatter in mass at fixed observable for cluster richness is comparable to that which can be attained using X-ray or SZ survey-quality data. Of course, pointed follow-up X-ray observations with high resolution instruments such as Chandra and XMM remains valuable, and the corresponding mass proxies exhibit lower scatter.
Our findings do not affect the Planck cluster cosmology analysis presented in Planck Collaboration XX (2013). We found only one object over the SDSS area from the cosmology cluster sample with an incorrect redshift; the vast majority of the redshift failures in the PSZ1 are lower S/N systems that have not yet been included as part of the cosmological analysis. In addition, it is not clear to what extent the PSZ1 failure rate can be extended outside the SDSS region. The Northern extragalactic sky, and in particular the SDSS area, has been extensively studied, and many of the PSZ1 redshift failures originate in identifications with catalogs not available elsewhere on the sky. In short, the failure rate in the PSZ1 calculated in this work is at least in part due to failures in existing data bases and/or optical cluster catalogs, or failures due to the difficulty of performing unambiguous associations between the Planck SZ detections and other optical catalogs.
Indeed, this is one of more significant aspects of our results. PXXIX found it difficult to capitalize on available optical/IR cluster samples for validation of the PSZ1 because of the large scatter in the richness– relation. Our results unambiguously demonstrate that the difficulties encountered by PXXIX are not due to a generic feature of photometric cluster catalogs; one can construct high-quality photometric catalogs for which scaling relations may be used to unambiguously pair optical and SZ cluster samples. Our success with redMaPPer is of particular importance given that we are about to usher in a new era of large photometric surveys, which include the Dark Energy Survey (DES, The DES Collaboration, 2005), the Hyper-Suprime Camera (HSC) survey, the Large Synoptic Survey Telescope (LSST, LSST Science Collaboration., 2009), the Euclid mission and WFIRST.
Our results also highlight the importance of multi-wavelength data for cluster cosmology. As in PXXIX and Paper II, we have found that comparing clusters catalogs selected in different wavelengths can help identify previously unaccounted for systematics. Just as importantly, we find that optical survey data can inform X-ray/SZ cluster catalogs just as much as X-ray/SZ data can help inform optical cluster catalogs. Thus, our success with redMaPPer is important not only from the point of view of utilizing future photometric surveys for cluster cosmology, it also highlights the important role that these surveys will have on future SZ and X-ray clusters samples. In short, our results clearly demonstrate that there is good reason to believe that surveys like DES, HSC, LSST, Euclid and WFIRST will play an important role in the development of cluster science together with X-ray and SZ surveys such as eRosita, Planck, the Atacama Cosmology Telescope (ACT), and the South Pole Telescope (SPT).
Our results also highlight the importance of multi- wavelength data for cluster cosmology. As in PXXIX and Paper II, we have found that comparing clusters catalogs selected in different wavelengths can help identify previously unaccounted for systematics. The improved understanding of cluster selection and characterization gained by combining redMaPPer and Planck analyses demonstrates the intrinsic value to cluster science in combining next generation optical-IR (DES, HSC, LSST, Euclid and WFIRST) surveys with X-ray (XCS, XMM-XXL, eRosita) and SZ (Planck, Atacama Cosmology Telescope, South Pole Telescope) surveys.
Acknowledgments
We thank August Evrard for comments on an early draft of this manuscript. This work was supported in part by the U.S. Department of Energy contract to SLAC no. DE-AC02-76SF00515. JGB gratefully acknowledges support from the Institut Universitaire de France. A portion of the research described in this paper was carried out at the Jet Propulsion Laboratory, California Institute of Technology, under a contract with the National Aeronautics and Space Administration.
References
- Aihara et al. (2011) Aihara H., et al., 2011, ApJ Supplement, 193, 29
- Angulo et al. (2012) Angulo R. E., et al., 2012, ArXiv:1203.3216
- Arnaud et al. (2010) Arnaud M., et al., 2010, A & A, 517, A92+
- Bartlett & Silk (1993) Bartlett J. G., Silk J., 1993, ApJ Letters, 407, L45
- Bersanelli et al. (2010) Bersanelli M., Mandolesi N., Butler R. C., Mennella A., Villa F., Aja B., Artal E. e. a., 2010, A & A, 520, A4
- Böhringer et al. (2000) Böhringer H., et al., 2000, ApJ Supplement, 129, 435
- Böhringer et al. (2004) Böhringer H., et al., 2004, A & A, 425, 367
- Burenin et al. (2007) Burenin R. A., et al., 2007, ApJ Supplement, 172, 561
- Carvalho et al. (2012) Carvalho P., Rocha G., Hobson M. P., Lasenby A., 2012, MNRAS, 427, 1384
- Cohn & White (2009) Cohn J. D., White M., 2009, MNRAS, 393, 393
- Cruddace et al. (2002) Cruddace R., et al., 2002, ApJ Supplement, 140, 239
- Ebeling et al. (1998) Ebeling H., et al., 1998, MNRAS, 301, 881
- Ebeling et al. (2001) Ebeling H., et al., 2001, ApJ, 553, 668
- Ebeling et al. (2002) Ebeling H., et al., 2002, ApJ, 580, 774
- Eke et al. (1996) Eke V. R., Cole S., Frenk C. S., 1996, MNRAS, 282, 263
- Gioia et al. (1990) Gioia I. M., et al., 1990, ApJ Supplement, 72, 567
- Gruen et al. (2013) Gruen D., Seitz S., Kosyra R., Brimioulle F., Koppenhoefer J., Lee C.-H., Bender R., Riffeser A., Eichner T., Weidinger T., Bierschenk M., 2013, ArXiv: 1310.6744
- Hao et al. (2010) Hao J., et al., 2010, ApJ Supplement, 191, 254
- Henry et al. (2006) Henry J. P., et al., 2006, ApJ Supplement, 162, 304
- Henry et al. (2009) Henry J. P., et al., 2009, ApJ, 691, 1307
- Horner et al. (2008) Horner D. J., et al., 2008, ApJ Supplement, 176, 374
- Kocevski et al. (2007) Kocevski D. D., et al., 2007, ApJ, 662, 224
- Lamarre et al. (2010) Lamarre J.-M., Puget J.-L., Ade P. A. R., Bouchet F., Guyot G., Lange A. E., Pajot F. e. a., 2010, A & A, 520, A9
- LSST Science Collaboration. (2009) LSST Science Collaboration. 2009, ArXiv: 0912.0201
- Mantz et al. (2010) Mantz A., et al., 2010, MNRAS, 406, 1759
- Melin et al. (2006) Melin J.-B., Bartlett J. G., Delabrouille J., 2006, A & A, 459, 341
- Melin et al. (2012) Melin J.-B., et al., 2012, A & A, 548, A51
- Mennella et al. (2011) Mennella A., Butler R. C., Curto A., Cuttaia F., Davis R. J., Dick J., Frailis M., Galeotta S. e. a., 2011, A & A, 536, A3
- Mullis et al. (2003) Mullis C. R., et al., 2003, ApJ, 594, 154
- Noh & Cohn (2012) Noh Y., Cohn J. D., 2012, MNRAS, 426, 1829
- Oukbir & Blanchard (1992) Oukbir J., Blanchard A., 1992, A & A, 262, L21
- Piffaretti et al. (2011) Piffaretti R., et al., 2011, A & A, 534, A109
- Planck Collaboration I (2011) Planck Collaboration I 2011, A & A, 536, A1
- Planck Collaboration I (2013) Planck Collaboration I 2013, ArXiv e-prints
- Planck Collaboration XX (2013) Planck Collaboration XX 2013, ArXiv:1303.5080
- Planck Collaboration XXIX (2013) Planck Collaboration XXIX 2013, ArXiv:1303.5089
- Planck Collaboration XXVIII (2013) Planck Collaboration XXVIII 2013, ArXiv e-prints
- Planck HFI Core Team (2011) Planck HFI Core Team 2011, A & A, 536, A4
- Romer et al. (2000) Romer A. K., et al., 2000, ApJ Supplement, 126, 209
- Rozo et al. (2010) Rozo E., et al., 2010, ApJ, 708, 645
- Rozo et al. (2012a) Rozo E., et al., 2012a, MNRAS accepted.
- Rozo et al. (2012b) Rozo E., et al., 2012b, MNRAS accepted.
- Rozo et al. (2012c) Rozo E., et al., 2012c, MNRAS accepted.
- Rozo et al. (2012d) Rozo E., et al., 2012d, ArXiv:1202.2150
- Rozo et al. (2013) Rozo E., et al., 2013, ArXiv: 1302.5086
- Rozo & Rykoff (2013) Rozo E., Rykoff E. S., 2013, ArXiv:1303.3373
- Rykoff et al. (2013) Rykoff E. S., et al., 2013, ArXiv: 1303.3562
- Szabo et al. (2011) Szabo T., Pierpaoli E., Dong F., Pipino A., Gunn J., 2011, ApJ, 736, 21
- Tauber et al. (2010) Tauber J. A., Mandolesi N., Puget J.-L., Banos T., Bersanelli M., Bouchet F. R., Butler R. C., Charra J., Crone G., Dodsworth J., et al. 2010, A & A, 520, A1
- The DES Collaboration (2005) The DES Collaboration 2005, ArXiv: 0510346
- Viana & Liddle (1996) Viana P. T. P., Liddle A. R., 1996, MNRAS, 281, 323
- Vikhlinin et al. (2009) Vikhlinin A., et al., 2009, ApJ, 692, 1060
- Voges et al. (1999) Voges W., et al., 1999, A & A, 349, 389
- Wen et al. (2012) Wen Z. L., Han J. L., Liu F. S., 2012, ApJ Supplement, 199, 34
Appendix A Comments on Individual Clusters
Planck 13: This is a redshift outlier. The SZ source is associated with ZwCl 1454.5+0656 at 2′ from the Planck position. The redshift is associated with NSC J145659+064610 at 2.3′, and these two clusters appear to be one and the same. Thus, the association in the PSZ1 is correct, but the NED photometric redshift is incorrect, as can be confirmed with SDSS spectroscopy (). There is a Wen et al. (2012) object close to the redMaPPer object, at 2.3′, with the same redshift.
Planck 73: The Planck location is roughly half way between two modestly rich redMaPPer clusters, RM 1130 (, , ) and RM 4408 (, , ). As such, it appears to be a clear case of an SZ projection. The cluster is not an outlier in the – plane when adopting either redshift, demonstrating that there is no unique redshift that can be associated with this detection.
Planck 77: PXXIX associated this cluster with RXC J1453.1+2153 and A1986 in the PSZ1, at z=0.1186 and 7.8′ from the Planck position (Section 3.3). There is no good redMaPPer counterpart. The Planck detection is made by a single algorithm at a . The positional shift between Planck and A1986 corresponds to a separation of , a significant shift, but one that has been seen before for low-redshift clusters with large images on the sky. We tentatively consider this a false detection, though this classification is insecure.
Planck 97: This is a redshift outlier. The Planck location is roughly half way between two rich redMaPPer clusters, RM 19525 (, , ) and RM 4470 (, , ). PXXIX assigned this SZ source the redshift of the closer, less massive clusters, which results in an outlier in the – plane. The source is not an outlier when adopting RM 4470 as the correct cluster match, so we adopt this match as correct.
Planck 216: Our automated matching algorithm matched this Planck cluster to RM 96829 (, , ). A second, obviously correct candidate is RM 5279 (, , ). This latter choice corresponds to the redshift assigned by PXXIX, so this cluster is one of the redshift outliers introduced by a failure of the matching algorithm.
Planck 222: This is a redshift outlier. The SZ source is associated with RXC J1421.6+3717 in the PSZ1 and the redshift taken from the MCXC. The position also matches A1902 and an object from the Wen et al. (2012) catalog. The latter two objects have redshifts compatible with the redMaPPer value of . The Planck association is correct, but the redshift from the MCXC is incorrect.
Planck 234: The Planck source sits almost directly in between two redMaPPer clusters, RM 24517 (, , ) and RM 24933 (, , ). Note the richness values are highly uncertain because of the high redshift. Given that the SZ detection is nearly in the middle of the two systems, and that the redshift values are unreliable, we consider this an SZ-projection effect. It is notable that a third system with at and is also present in the field.
Planck 280: This cluster was associated with RXC J2241.8+1732 and A2472 in the PSZ1, at z=0.3137 and 7.2′ from the Planck position (Section 3.3). This is also the closest candidate redMaPPer match. This corresponds to a rather large shift of . There is a possible match to an over-density in SDSS and WISE at and (2.2′ separation) and . May be a projection of two SZ sources.
Planck 292: This is a redshift outlier. The SZ source is associated with ZwCl 1341.2+4022 in the PSZ1 at 2.9′ from the Planck position, which has no redshift in NED. The redshift given in the PSZ1 is is that of GMBCG J205.85324+40.09379 at 1.5′.
Planck 299: Outlier in the relation (Section 3.2). The SZ source is associated with AMF J231.538+54.1303 in the PSZ1, at z=0.4735 and 2.9′ from the Planck position. It is also identified with the low-richness clusters WHL () and GMBCG . It has a redMaPPer counterpart at the same redshift, but of too low richness to be an acceptable match. There is an SDSS over-density at 3′ from the Planck position, at and , with a spectroscopic redshift (Fig. 3, and Table 3). This is a candidate high-z cluster that appears to have been incorrectly associated with a low-mass system in the foreground.
Planck 303: This is a redshift outlier. The SZ source is associated with ZwCl 2341.1+0000 in the PSZ1 at 2.5′ from the Planck position. This object is also known as SDSS CE J355.930756+00.303606 and NSCS J234339+001747 with redshift compatible with the redMaPPer value of . The redshift given in the PSZ1 comes from SIMBAD. The Planck association appears correct, but the SIMBAD redshift inaccurate.
Planck 308: This is a redshift outlier. The SZ source is associated with ACO 2623 in the PSZ1 at 2.2′ from the Planck position. The ACO cluster lies between the Planck SZ source and the redMaPPer cluster at 2.6′ from the Planck position. The redshift given in NED for ACO 2623 is based on a single galaxy redshift.
Planck 316: This is a redshift outlier. The SZ source is associated with ZwCl 2341.8+0251 at 4.1′ separation, but the redshift reported in the PSZ1 () corresponds to NSCS J234433+030506 at a separation of 1.5′ from the Planck position. The redMaPPer counterpart lies at 1.2′ from the Planck position and also from the NSCS object, which is also clearly the same system as the redMaPPer object. The redshift from NED is photometric, and incorrect, as confirmed with SDSS spectroscopy ().
Planck 376: The Planck source sits almost directly in between two redMaPPer clusters, RM 4427 (, , ) and RM 27136 (, , ). The second system is the one that PXXIX associated with Planck 376, and is an outlier in the – relation. Given the modest richness of the two clusters, and the relatively large angular offsets, neither cluster match is particularly convincing. This appears to be either a false detection, or an SZ-projection effect.
Planck 391: This is a redshift outlier. The SZ source is associated with ZwCl 0017.0+0320 in the PSZ1, at 0.2′ separation, which also corresponds to the correct redMaPPer match. The quoted photometric redshift in NED utilized by PXXIX is incorrect.
Planck 400: This cluster has no acceptable redMaPPer match. Visual inspection of SDSS and WISE reveals a rich high redshift cluster candidate at , , .
Planck 416: This is a redshift outlier. The SZ source is associated with RXC J0019.6+2517 with taken from the NED database. The RXC and redMaPPer counterpart, at , are separated by only 0.8′. There is another redMaPPer system close to the RXC with the redshift given by NED, but it has a low richness, , which is to be compared with for the higher redshift system. It is possible that the association between the X-ray source and the Planck SZ detection is correct, and that the X-ray source was incorrectly associated with the foreground group rather than the background cluster that we identify as the proper counterpart to the Planck SZ source.
Planck 441: Outlier in the relation (Section 3.2). The SZ source is associated with the low-richness cluster WHL J10.6526+18.4259 () in the PSZ1, at and 6.5′ from the Planck position. It has a redMaPPer counterpart at the same redshift, but of too low richness. There is a WISE over-density with faint optical counterpart located 1.4′ from the Planck position, at and , with estimated (Table 3). This is a candidate high-z cluster that has been incorrectly associated with a low-mass system in the foreground.
Planck 443: Our automated matching algorithm matched this cluster to RM 319 (, , ). A second candidate is RM 49592 (, , ). This is the association made by PXXIX. Neither candidate is obviously correct based on our visual inspection. The cluster is an outlier in – when paired with RM 49592, but is not an outlier when paired with RM 319. We make this association, noting the cluster likely suffers from SZ projection.
Planck 484: This is a redshift outlier. The SZ source is associated with WHL J178.058+61.33, with at 1.8′. This is a low-richness system () that is unlikely to be the Planck counterpart. There is no good redMaPPer counterpart, but we were able to identify a possible high-z match at and with (see Table 1).
Planck 505: This is a redshift outlier. The SZ source is detected by only one (MMF3) of the three Planck methods, at . The redshift comes from dedicated follow-up observations. The cluster has no good redMaPPer counterpart, but we were able to identify a candidate high redshift galaxy overdensity.
Planck 510: This cluster sits directly on top of 2 rich ( and ) galaxy clusters at redshifts and respectively. The corresponding angular separations relative to the Planck location are and . This is a spectacular example of an SZ-projection effect.
Planck 513: This is a redshfit outlier. The SZ source is associated with RXC J1159.2+4947, also A1430, in the PSZ1. The redshift for the counterpart was taken from NED and SIMBAD, both of which incorrectly give . The PSZ1 association is correct, but the redshift incorrect. This cluster is part of the Planck cluster cosmology sample.
Planck 527: This is a redshift outlier. The SZ source is detected by only one (MMF1) of the three Planck detection methods, at . It’s redshift comes from dedicated follow-up observations. The cluster has no good redMaPPer counterpart, but we were able to identify a candidate high redshift galaxy overdensity.
Planck 537: This is a redshift outlier. The SZ source is associated with RXC J1017.5+5934, also A0959. The redshift assigned in the PSZ1 () is given by SIMBAD. The redshift for the same object in NED is , in agreement with the redMaPPer match. The Planck association appears correct, but with an incorrect redshift from SIMBAD.
Planck 574: The Planck cluster was originally matched to RM 97769 (, , ). The cluster is clearly properly centered in the optical, so the large angular separation suggests this is not a good match. A second candidate is RM 4112 (, , ). This is the association made by PXXIX, but we note this cluster is less rich than all 185 good cluster matches shown in Figure 2, and that this association results in an outlier in the – plane. This suggests the cluster is not rich enough to lead to a Planck detection. SDSS and WISE images both reveal a candidate high redshift system at within , making this a good high redshift cluster candidate.
Planck 622: This is a redshift outlier. The redshift assigned by Planck was obtained in dedicated follow-up imaging with the Russian Turkish Telescope. The cluster has no good redMaPPer counterpart, but we were able to identify a candidate high redshift galaxy overdensity, albeit with low confidence.
Planck 660: This is a redshift outlier. The SZ source is correctly associated with ZwCl 0928.0+2904, which NED reports has a photometric redshift (SDSS gives a spectroscopic redshift ), and is at 1.8′ from the Planck position. However, the redshift assigned in the PSZ1 is , corresponding to the cluster GMBCG J142.68564+28.82848, which is incorrect.
Planck 668: This is a redshift outlier. The SZ source is associated with ZwCl 0824.5+2244 in the PSZ1 at 0.66′ from the Planck position with , compatible with the redMaPPer value of . SDSS spectroscopy confirms . The PSZ1 redshift of corresponds to that of NSC J082722+223244 at 2.9′ from the Planck position. This last incorrect redshift comes rom NED, where it is reported as a photometric redshift. The Planck association is correct, but the redshift is incorrectly assigned.
Planck 678: There are no good matching candidates for this system in redMaPPer. Visual inspection reveals a very bright WISE source at (), also detected in SDSS, with a photometric redshift . Several other candidate cluster galaxies can be discerned in the WISE image, making this a high redshift cluster candidate. The SZ source is only detected by one (MMF1) of the three Planck methods.
Planck 719: Outlier in the relation (Section 3.2). The SZ source is associated with the low-richness cluster WHL J158.665+20.5346 () in the PSZ1, at and 1.2′ from the Planck position. It has a redMaPPer counterpart at the same redshift, but of too low richness to be an acceptable match. There is a WISE over-density with faint optical counterpart located 1.5′ from the Planck position, at and , of unknown redshift (Table 3). This is a candidate high-z cluster that appears to have been incorrectly associated with a low-mass system in the foreground.
Planck 729: This cluster is an outlier in the relation (Section 3.2). The SZ source was associated with the low-richness cluster WHL J140.630+11.6581 () in the PSZ1, at and 2.3′ from the Planck position; also listed in the maxBCG and GMBCG catalogs. It has a redMaPPer counterpart at the same redshift, but of too low richness. There is a WISE over-density with faint optical counterpart located 0′.8 from the Planck position, at and , of unknown redshift (Table 3). This is a candidate high-z cluster that has been incorrectly associated with a low-mass system in the foreground.
Planck 732: The Planck location is roughly half way between two rich redMaPPer clusters, RM 1057 (, , ) and RM 373 (, , ). As such, it appears to be a clear case of an SZ-projection. If we were to choose a single match, the better match is RM 373, which is both richer and closer to the Planck detection, whereas PXXIX assigned this detection the redshift of the smaller, slightly more distant cluster RM 1057. That said, we consider this cluster an SZ projection with no unambiguous redshift. Neither of the two matchings noted above results in the cluster being an outlier in the – plane.
Planck 764: This is a redshift outlier. The PSZ1 associated this SZ source with ZwCl 0924.4+0511 at 2.7′ from the Planck position (with ), but the given redshift of is that of NSC J092656+045928, at 1.6′. The two clusters should be identified. There is also a low-richness redMaPPer cluster at this redshift (, ), consistent with SDSS spectroscopy for the group (). However, the correct redMaPPer match is a higher redshift system (, ). SDSS spectra confirms the cluster’s redshift as .
Planck 768: The Planck cluster was originally matched to RM 399 (, , ). There are no other plausible redMaPPer matches. This association does not make the cluster an outlier in the – plane, but nevertheless, the angular offset is uncommonly large. Inspection of the SDSS and WISE images reveal a possible high redshift cluster match.
Planck 779: This is a redshift outlier. The SZ source is associated with ACO 1127 in the PSZ1 at 4′ from the Planck position (with ), but the given redshift of NSC J105417+143835 at 1.8′. The two clusters are one and the same, and they are the correct cluster match to the SZ source, but neither redshift is correct. SDSS spectroscopy confirms , in agreement with the redMaPPer redshift .
Planck 795: This SZ source is not a good match to any redMaPPer clusters. Visual inspection reveals a rich high redshift cluster at , , . The galaxy overdensity is confirmed with WISE.
Planck 865: This is a redshift outlier. The SZ source is associated with A1208 in the PSZ1. There is no redshift given in SIMBAD. The redshift given in NED is compatible with the redMaPPer , as is the redshift of a nearby Wen et al. (2012) object. The Planck association appears correct, but the redshift is incorrect.
Planck 888: This is a redshift outlier. The SZ source is associated with ZwCl 1232.1+2319 at 2.7′ from the Planck position, but the redshift assigned in the PSZ1 is , corresponding to the cluster NSC J123444+230059 at 0.451′. The 2 clusters appear to be one and the same, and they correspond to the correct cluster match, but the redshift is incorrect. The redMaPPer object lies at 0.67′, and appears to be properly centered. SDSS spectra gives , confirming the redMaPPer redshift .
Planck 1093: Outlier in the relation (Section 3.2). The SZ source is associated with the low-richness cluster GMBCG J193.82512+21.04201 () in the PSZ1, at and 4.8′ from the Planck position. It has a redMaPPer counterpart at the same redshift, but of too low richness. There is a WISE over-density with faint optical counterpart located 0′.2 from the Planck position, at and , of unknown redshift (Table 3). This is a candidate high-z cluster that appears to have been incorrectly associated with a low-mass system in the foreground.
Planck 1123: Our automated algorithm matched this cluster to RM 897 (, , ). This tentative association is not an outlier in the – plane. PXXIX assigned a redshift , and an inspection of the SDSS field reveals the presence of a group at this redshift. There is a nearby redMaPPer candidate match, RM 11263. The redshift of RM 11263 is just over away over the PXXIX redshift, and it appears to have been affected by a blend with slightly lower redshift structures, which also led to the cluster being miscentered. We have evaluated at the obvious optical center of the cluster, setting . The change to the richness relative to RM 11293 was insignificant, and the cluster remained an outlier in the – plane, with too low a richness given . Consequently, the fact that the new richness may be somewhat affected by blending is irrelevant: no blending would only exacerbate the problem. We conclude that RM 897 is the correct cluster match, and that the redshift assigned by PXXIX is incorrect. Alternatively, the cluster could be considered an SZ projection effect.
Planck 1128: The Planck location is roughly half way between two rich redMaPPer clusters, RM 683 (Abell 1750, , , ) and RM 18367 (, , ). As such, it appears to be a clear case of an SZ projection. If we were to choose a single match, the better match is RM 18367, which is both richer and closer to the Planck detection, whereas PXXIX assigned this detection the redshift of the smaller, slightly more distant cluster RM 683. However, either association is acceptable as probed by the – scaling relation. We note that there exist deep XMM images of this field which easily detect the background cluster RM 18367.
Planck 1216: This cluster is next to a bright star. At the reported Planck location, the masked fraction of the cluster is 0.17. redMaPPer finds the cluster, but the assigned center (which is incorrect) is such that the masked fraction is above our mask cut of . Consequently, the cluster matching procedure failed. This cluster has an obvious starburst central galaxy, which led to the incorrect center in redMaPPer, which in turn led to the cluster missing from the catalog. This is a clear form of incompleteness in the redMaPPer catalog due centering.