NEW ACCURATE MEASUREMENT OF 36ArH+ AND 38ArH+ RO-VIBRATIONAL TRANSITIONS BY HIGH RESOLUTION IR ABSORPTION SPECTROSCOPY
Abstract
The protonated Argon ion, 36ArH+, has been identified recently in the Crab Nebula (Barlow et al. 2013) from Herschel spectra. Given the atmospheric opacity at the frequency of its =1-0 and =2-1 rotational transitions (617.5 and 1234.6 GHz, respectively), and the current lack of appropriate space observatories after the recent end of the Herschel mission, future studies on this molecule will rely on mid-infrared observations. We report on accurate wavenumber measurements of 36ArH+ and 38ArH+ rotation-vibration transitions in the =1-0 band in the range 4.1-3.7 m (2450-2715 cm-1). The wavenumbers of the (0) transitions of the =1-0 band are 2612.501350.00033 and 2610.701770.00042 cm-1 () for 36ArH+ and 38ArH+, respectively. The calculated opacity for a gas thermalized at a temperature of 100 K and a linewidth of 1 km s-1 of the R(0) line is (36ArH+). For column densities of 36ArH+ larger than cm-2, significant absorption by the (0) line can be expected against bright mid-IR sources.
1 Introduction
Molecular complexes containing noble gas atoms have been searched in space for long without success, using space platforms and ground based observatories. The presence of HeH+ in the atmospheres of bright stars was suggested by Stecher & Milligan (1961, 1962) to explain the differences between observations and stellar models in the ultraviolet (see also, Norton 1964; Harris et al. 2004). The role of HeH+ in the chemistry of the early universe has been also a subject of debate (see, e.g., Lepp & Shull 1984; Galli & Palla 1998; Bovino et al. 2011) and searches have been conducted to try to detect this molecular ion in high redshift objects (Zinchenko et al. 2011) unsuccessfully.
Barlow et al. (2013) have recently reported the serendipitous detection of 36ArH+ in the emission spectra of the Crab nebula during a search for CO lines. In our planet, the most abundant Ar isotope is 40Ar, produced from the disintegration of 40K through electron capture or positron emission, and from beta decay of 40Ca. However, in space the most abundant isotope is 36Ar, produced by alpha processes during stellar nucleosynthesis. The abundances on Earth of 38Ar, 36Ar and 40Ar are 0.063%, 0.337% and 99.600%, respectively. However, in the Sun 84.6% of Argon is 36Ar (Lodders 2008) and in giant planets the ratio 36Ar/40Ar is 8600 (Cameron 1973). The high abundance of the heavy 40Ar on Earth has as a consequence that most laboratory studies of ArH+ have focused on 40ArH+ and that little information is available for 36ArH+, and even less for 38ArH+. Barlow et al. (2013) have discovered 36ArH+ using the submillimeter Fourier Transform Spectrometer (SPIRE, Griffin et al. 2010) on board the Herschel satellite (Pilbratt et al. 2010). The frequency of the =1-0 line of 36ArH+ is 617.5 GHz, for which the atmospheric transmission is rather poor even for a site as good as that of ALMA. The =2-1 line occurs at 1.235 THz and its observation from the ground is impossible due to telluric absorption. Hence, space platforms are best for the observation of the pure rotational lines of this molecule in space. As an alternative, after the end of the Herschel mission, ro-vibrational transitions of ArH+ isotopologues could be observed in absorption against bright background mid-infrared sources, such as the galactic center.
There are a number of high resolution spectroscopic studies on all isotopologues of this ion (i.e. with 40Ar, 36Ar, 38Ar, H and D) in the literature, both in the infrared and in the sub-mm wave region. The work by Odashima et al. (1999) is the last published addition of laboratory frequency data, and references to previous work can be found there. Remarkably, for 36ArH+ and 38ArH+ the only direct measurements are six and two, respectively, ro-vibrational lines, by Filgueira & Blom (1988) and by Haese and Oka (unpublished results, quoted by Johns (1984)), using the natural isotopic abundance of 36Ar and 38Ar in both cases.
In this Letter we report on the accurate laboratory measurement of nineteen lines of the =1-0 band of 36ArH+ and 38ArH+ which have been used to fit all available laboratory data of all ArH+ isotopologues. The mass independent Dunham coefficients have been considerably improved. Accurate wavenumbers are provided to help in the search and detection of 36ArH+ and other isotopologues of ArH+ in space in the mid-infrared.
2 Experimental details
The apparatus used in this experiment has been reported earlier (Doménech et al. 2013, Tanarro et al. 1994), and has been recently used to confirm the identification of NH3D+ in space (Cernicharo et al. 2013). It is based on an IR difference-frequency laser spectrometer, a hollow cathode discharge reactor, and a double modulation technique with phase-sensitive detection (Domingo et al. 1994).
Briefly, frequency-tunable IR radiation is generated by mixing the output of an Ar+ laser with that of a tunable ring dye laser in a LiNbO3 crystal contained in a temperature controlled oven. The wavelength coverage is 2.2-4.2 m, with 3 MHz linewidth and 5 W power. The Ar+ laser is locked to the 127I2 a3 hyperfine component of the (13) 43-0 transition, known with 0.1 MHz accuracy (Quinn 2003). The laser frequency has a residual frequency jitter 1 MHz and similar long-term stability. The tunable single mode ring dye laser is also frequency stabilized, with commercial stabilization electronics (residual jitter 3 MHz). Its wavelength is measured with a high accuracy (10 MHz -3-) commercial wavemeter (High Finesse WSU10), calibrated with the stabilized Ar+ laser. The wavemeter accuracy limits that of the IR frequency scale.
The discharge is modulated at 3.09 kHz through an audio amplifier, a step-up transformer and a 940 ballast resistor. Typical discharge conditions are 250 V rms between electrodes and 375 mA. The IR beam is amplitude modulated at 23.19 kHz with an electro-optic modulator and a polarizer placed in the path of the Ar+ laser beam. The IR beam is split before the absorption cell so that one part is directed to an InSb detector and is used for noise reduction and the other one goes through the multipass cell 32 times (22.4 m pathlength) and is then detected by another InSb detector. To improve the sensitivity for the 36ArH+ and 38ArH+ isotopologues, an autobalanced transimpedance amplifier (ATA) based on the design of Lindsay et al. (2001) has been built and added to the set-up. The ATA output is fed to a dual-phase lock-in amplifier synchronized at the sum frequency of both modulation signals (26.28 kHz). The detection time constant is 30 ms with 12 dB/oct roll off and scans have been made at a rate of 0.005 cm-1 s-1 (about 30 time constants per linewidth) to avoid lineshape distortion effects. The ATA halves the floor noise level, reducing by a factor of four the acquisition time necessary to attain a given signal to noise ratio (SNR). For 36ArH+ and 38ArH+, between 100 and 800 scans have been averaged, to obtain SNR’s between 12 and 50. The width of the scans, 0.05 cm-1 (about 8 linewidths FWHM), keeps the recording time to a minimum and allows a good estimation of the baseline. A symmetric triangle wave is programmed to control the scans, so the lines are recorded both with increasing and decreasing wavenumber scale. The full dataset of frequency and intensity values is frequency-binned and averaged in a 0.0005 cm-1 grid. The wavemeter is recalibrated with the frequency stabilized Ar+ laser after every 50 scans.
The reactor is pumped down to 10-3 mbar. A continuous flow (30 mg min-1) of Ar with natural isotopic composition (l’Air Liquide, 99.9995% purity) at 0.4 mbar pressure is used to generate the ArH+ ions in the discharge. Attempts to increase the ArH+ IR absorption signal by adding H2 were unsuccessful, indicating that the hydrogen concentration necessary to produce maximum ArH+ absorption signals is very small and is thought to proceed from the tiny amount of residual water. ArH+ in glow discharge plasmas is known to be produced mainly through the reactions H+ArArH++H (=2.110-9 cm3s-1) and Ar++H2ArH++H (=8.710-10 cm3s-1) (Anicich 1993); and to be destroyed mainly through the reaction ArH++H2H+Ar (=6.310-10 cm3s-1). Recent kinetic studies on Ar/H2 discharges with relatively large proportions of H2 show appreciable amounts of ArH+ (Méndez et al. 2010; Sode et al. 2013). Nevertheless, previous spectroscopic studies of ArH+ show that a fairly small proportion of H2 (ranging from 0.1 to 10 % in the studies of Haese et al. 1983, Johns 1984, Laughlin et al. 1987, Brown et al. 1988 and Filgueira & Blom 1988) or no supply at all of H2 (Brault & Davis 1982) to the discharge gives larger ArH+ signals.
3 Results and Discussion
We have chosen the (6) line of the =1-0 band of 40ArH+ at 2711.4029 cm-1 as a reference to optimize the operating conditions and check the day-to-day repeatability of the experiment. We can observe this line in a single scan with SNR of 1100. Its Doppler full width at half maximum (FWHM) is 0.0059-0.0061 cm-1, corresponding to a kinetic temperature of 380-400 K. From the relative line intensities of (6) observed in the =1-0 and =2-1 bands, the estimated vibrational temperature is 580K.
We estimate a density of ArH+ in the discharge of 41010 cm-3, derived from the transition dipole moments and Herman-Wallis factors for 40ArH+ in various vibrational bands given by Picqué et al. (2000), the estimated vibrational and rotational (kinetic) temperatures and the observed peak absorption (tipically 0.035) in the (6) =1-0 line of 40ArH+. This is a rough estimate, since ion signals exhibit day-to-day variations of up to 40%, depending on the discharge behavior. Nonetheless this value is close to the total electron densities measured in this type of plasmas (Méndez et al. 2010), suggesting that ArH+ is a dominant ion in our discharge.
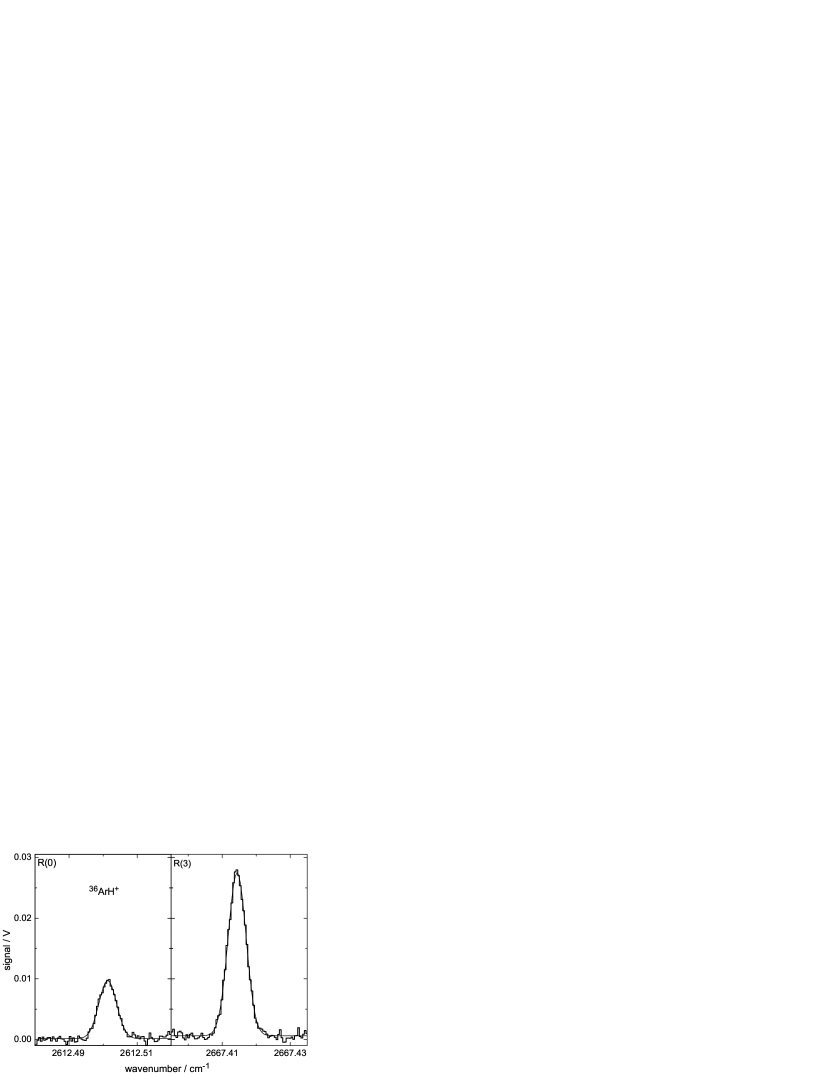
We have measured fourteen lines of 36ArH+ in the =1-0 band ((6) to (7)) ranging from 2458.4 to 2729.3 cm-1. We have scanned 0.05 cm-1 wide regions, centered on the frequencies calculated from the Dunham parameters of Johns (1984). The predictions are rather accurate, and the lines were found within cm-1 of their expected value. Typically, 200 scans were averaged. The line center position has been derived from a least-squares fit of each line to a Gaussian function. As an example, the (0) and (3) lines are shown in Figure 1, together with their Gaussian fits. The uncertainty in the line positions is estimated as the quadratic sum of the standard error of the line center derived from the fit plus the manufacturer stated accuracy of the wavemeter, i.e. 3.3 MHz (1). The observed line centers and their estimated uncertainties () are given in Table 1.
These new data for 36ArH+ have been fitted to the frequencies derived from the energy levels calculated with a simple Hamiltonian for a vibrating rotor (Herzberg 1989)
| (1) |
Despite the relatively low number of measurements, the quality of the data allows to determine, with statistical significance, five independent parameters (up to the centrifugal distortion constants), with an uncertainty-weighted standard deviation =0.61. Recall that is close to unity for an adequate model and reasonable estimates of the experimental uncertainties. The low value reflects an internal coherence of the frequency better than the uncertainty, as it is reasonable to expect. As a further check, with the parameters determined in this fit, we calculate the frequency of the 1-0 rotational transition of 36ArH+ at 617524.41.2 MHz (), which compares very well with the frequency predicted by the Cologne database (Müller et al. 2005) of 617525.230.45 MHz (). As noted in the Introduction, prior to this work, only six direct measurements of ro-vibrational frequencies of 36ArH+ were available. The accuracy of the previous values, estimated by their authors, was 0.001 cm1. No measurements of (0) have been reported previously.
As for 38ArH+, we have recorded five previously unreported lines, (0) to (4), in the =1-0 band. Given their weakness, it was necessary to average up to 800 scans for some of them. Since the efficiency of the difference frequency mixing process decreases with the IR frequency, and phonon absorption from LiNbO3 starts to become significant at lower frequencies, the IR power available for lines in the branch was not sufficient to record them in a reasonable amount of time. The wavenumbers determined in this work and their uncertainties are shown in Table 1. As an example, the (0) and (2) lines are shown in Figure 2, together with their Gaussian fits. Filgueira & Blom (1984) reported the observation of the (3) and (4) lines, with 0.001 cm-1 accuracy, and, similarly to 36ArH+, no measurements of (0) have been reported previously. Given the reduced number of lines in this case, we have not attempted an independent fit of this isotopologue.

These new measurements, together with all previous infrared and millimeter-wave data found in the literature for all isotopologues of ArH+ (i.e. those including 40Ar, 36Ar, 38Ar, H and D) have been combined in a global fit to a mass-independent Dunham’s series expansion for a diatomic molecule in a state (Watson 1980)
| (2) |
where and are mass independent coefficients ( are the Born-Oppenheimer approximation breakdown, or BOB, terms), and , the atomic masses of the corresponding isotope (Coursey et al. 2010), , the electron mass and , a charge-modified reduced mass, defined for ArH+ as
| (3) |
In the fitting process it became evident that a significantly better global fit is obtained if, in the calculation of , we use in the numerator, instead of the Ar atomic mass . In this case, =0.72, while that obtained using equation (3) is =0.86. Using amounts to centering all the positive charge of the ion on the Ar nucleus. Similar improvements in a Born-Oppenheimer potential fit using different expressions of were observed in HeH+ by Coxon & Hajigeorgiou (1999), although in that case the best fit was obtained if half the electron mass was subtracted from that of each atom. Furthermore, an ab-initio study of noble gas hydride molecule-ions (Schutte 2002) shows a progressive displacement of the positive charge of the ion from the H nucleus to the noble gas nucleus, at the equilibrium distance, in going from HeH+ to KrH+. Therefore, we deemed advisable to carry out four fits using different calculations for the reduced mass: using Watson’s (1980) expression; splitting equally the charge among both nuclei; completely ignoring the electron mass (i.e. treating the molecule as a neutral), and assigning all the charge to the Ar nucleus (as described above). The are 0.86, 0.76, 0.72 and 0.72, respectively. In order to better reproduce the set of existing observations, we have chosen the latter as our best fit, regardless of the possible implications on the adequacy of Equation (3) to calculate the charge-corrected reduced mass of light ions, or on the effect of on the physical meaning of the Dunham parameters thus derived.
The fit has been carried out using a linear least-squares fitting program coupled to the MADEX code (Cernicharo 2012), which allows to predict the frequencies of the pure rotational and ro-vibrational lines of all the isotopologues of ArH+ from the parameters provided by the fitting routine. The fit contains 367 experimental frequencies, weighted by the square of their estimated reciprocal uncertainty. The results are shown in Table 2, together with the parameters obtained by fitting all the previous data prior to this work. The parameters with no uncertainty have been fixed to the values derived from the fitted parameters and the Dunham relations to as provided by the code ACET of the CPC library written by Ogilvie (1983). Including a BOB term does not improve the quality of the fit. In both fits, () has been used in the numerator of Equation (3) to calculate . Summarizing the results, before the inclusion of the new data reported in this Letter, the standard deviation of the fit was 52.5 MHz, which decreases to 50.7 MHz when our new wavenumbers are included. The relatively small change in standard deviation is due to the reduced number of new accurate data. Nevertheless, significant improvements are obtained in the , and parameters, whose standard deviations decrease by factors of 1.8, 1.4 and 5.6, respectively, when the present wavenumbers are taken into account. The change in the rest of parameters is marginal, accompanied by a less significative decrease of their standard deviations, due to the large number of pure rotational lines measured with high accuracy for 40ArH+ and 40ArD+. The BOB parameter is poorly determined even with those data for the pure rotational lines (see Odashima et al. 1999). Using and , of Table 2 we can predict the frequencies of the pure rotational lines of all isotopologues with high accuracy. The =1-0 transition is predicted at 617525.1340.100, 616648.7200.100, and 615858.1360.100 MHz for 36ArH+, 38ArH+, and 40ArH+ respectively. The predicted wavenumber of the =1-0 (0) line is 2612.50129(610-5), 2610.70170(1010-5), and 2609.07719(2010-5) cm-1 for the same isotopologues. The quoted intervals are uncertainties. Table 3 contains all published observed frequencies of all isotopologues, as well as the values calculated from our fit.
The absorption coefficient of the (0) line can be computed from the transition dipole moment of the =1-0 transition derived by Picqué et al. (2000). We have used their value of =0.297 D based on the calculations of Rosmus (1979) for the permanent dipole moment of the ground vibrational state =2.2 D. They also provide a smaller value, =0.194 D, based on the experimental determination of =1.420.6 D by Laughlin et al. (1987). However, Laughlin et al. (1989) provided =3.00.6 D after a refinement of their experiment, in better agreement with the value by Rosmus (1979). Both values are in good agreement with the calculations performed at a higher level of theory by Cheng et al. (2007) and by the analysis of the experimental potential curve by Molski (2001). Using =0.297 D we can derive ((0))=(T)(ArH+)/v, where (ArH+) is the column density of the molecule in cm-2, v is the linewidth in km s-1 and where (T) is 9.510-15, 1.610-15, 3.210-16, and 1.510-16 (in cm2km s-1), for =10, 100, 500, and 1000 K, respectively. These values for (T) have to be decreased by a factor 2.4, or increased by a factor 1.9, depending on wether the value of Laughlin et al. (1987), or that of Laughlin et al. (1989), is assumed. The best conditions to detect the (0) lines are those of the diffuse ISM lines of sight where the kinetic temperature could be below 100 K and no emission is expected from the (0) line. For the estimated column densities by Barlow et al. (2013) absorption in the (0) lines of a few percent could be expected. We note, however, that if the kinetic temperature of the gas in the CRAB nebula is above 1000 K, the (0) line, and others, could appear in emission. For column densities above 1013 cm-2 the different isotopologues of ArH+ could be easily detected in cold dark clouds against bright sources through mid-IR observations.
4 Concluding remarks
We have provided direct accurate wavenumber measurements of nineteen vibration-rotation lines of 36ArH+ and 38ArH+, in natural isotopic abundance, measured with a difference frequency laser spectrometer and a hollow cathode discharge cell. Of those, only six had been reported before, and with much larger uncertainty. Furthermore, the new wavenumbers have improved the Dunham-type fit to all published rotation and vibration-rotation data for all isotopologues of this molecule, allowing for more accurate predictions of other transitions for any of them. Notably, the measured wavenumbers of the (0) transitions of the =1-0 band are 2612.501350.00033 and 2610.701770.00042 cm-1 () for 36ArH+ and 38ArH+ [predicted values of 2612.50129 610-5) cm-1 and 2610.70170 (1010-5) cm-1], respectively. These wavenumbers should help in future searches for absorptions of these molecules against bright sources.
References
- (1) Anicich, V. G. 1993, JPCRD, 22, 1469.
- (2)
- (3) Barlow, M. J., Swinyard, B.M., Owen, P.J. et al. 2013, Sci, 342, 1343.
- (4)
- (5) Bovino, S., Tacconi, M., Gianturco, F.A. & Galli, D. 2011, A&A, 529, A140.
- (6)
- (7) Bowman, W. C., Plummer, G. M., Herbst, E. & De Lucia F. C., 1983, JChPh, 79, 2093.
- (8)
- (9) Brault, J.W. & Davis, S.P. 1982, PhyS, 25, 268.
- (10)
- (11) Brown, J.M., Jennings, D. A., Vanek, M. et al. 1988, JMoSp, 128, 587.
- (12)
- (13) Cameron, A. G. W. 1973, SSRv, 14, 392.
- (14)
- (15) Cernicharo, J. 2012, EAS Publications Series, 58, 251.
- (16)
- (17) Cernicharo, J. , Tercero, B., Fuente, A. et al. 2013, ApJL, 771, L10.
- (18)
- (19) Cheng, M., Brown, J.M., Rosmus, P. et al. 2007, PhRvA, 75, 012502.
- (20)
- (21) Coursey, J.S. et al. 2010, Atomic Weights and Isotopic Compositions (Gaithersburg, MD: National Institute of Standards and Technology) (version 3.0). http://physics.nist.gov/Comp
- (22)
- (23) Coxon, J.A. & Hajigeorgiou, P.G. 1999, JMoSp, 193, 306.
- (24)
- (25) Doménech, J.L., Cueto M., Herrero V. J. et al. 2013, ApJL, 771, L11.
- (26)
- (27) Domingo, C., Tanarro, I., Herrero, V. J. et al. 1994, Proc. SPIE,2124, 227.
- (28)
- (29) Filgueira, R.R. & Blom, C.E. 1988, JMoSp, 127, 279.
- (30)
- (31) Galli, D. & Palla, F. 1998, A&A, 335, 403.
- (32)
- (33) Griffin, M.J., Abergel, A., Abreu, A., et al. 2010, A&A, 518, L3.
- (34)
- (35) Haese, N., Pan, F.-S. & Oka, T. 1983, PhRvL, 50, 1575.
- (36)
- (37) Harris, G.J., Lynas-Gray, A.E., Miller, S. & Tennyson J. 2004, ApJ, 617, L143
- (38)
- (39) Herzberg, G. 1989. Molecular Spectra and Molecular Structure. Volume I - Spectra of Diatomic Molecules, Malabar, Florida: Robert E. Krieger Publishing CO.
- (40)
- (41) Johns, J.W.C. 1984, JMoSp, 106, 124.
- (42)
- (43) Laughlin, K.B., Blake, G.A., Cohen, R.C., Hovde, D.C. & Saykally R.J. 1987, PhRvL, 58, 996.
- (44) Laughlin, K.B., Blake, G.A., Cohen, R.C., Hovde, D.C. & Saykally R.J. 1988 RSPTA, 234, 119.
- (45) Laughlin, K.B., Blake, G.A., Cohen, R.C. & Saykally, R. J. 1989, JChPh, 90, 1358
- (46)
- (47) Lepp, S. & Shull, J.M. 1984, ApJ, 280, 465.
- (48)
- (49) Lindsay, C.M., Rade Jr., R.M. & Oka, T. 2001. JMoSp, 210, 51.
- (50)
- (51) Liu, D-J., Ho, W-C. & Oka T., 1987, JChPh, 87, 2442
- (52)
- (53) Lodders, K. 2008, ApJ, 674, 607.
- (54)
- (55) Méndez, I., Tanarro, I. & Herrero, V.J. 2010, PCCP, 12, 4239.
- (56)
- (57) Molski M., 2001, CPL, 342, 293
- (58)
- (59) Müller, H. S. P., Schlöder, F., Stutzki, J. & Winnewisser, G. T. 2005, JMoSt, 742, 215.
- (60) The Cologne Database For Molecular Spectroscopy, CDMS, http://www.astro.uni-koeln.de/cdms/catalog
- (61)
- (62) Norton, R.H. 1964, PhD Thesis, California Institute of Technology
- (63)
- (64) Odashima, H., Kozato A., Matsushima F., Tsunekawa S, & Takagi K 1999. JMoSp, 195, 356.
- (65)
- (66) Ogilvie, J.F. 1983. CoPhC, 30, 101.
- (67)
- (68) Picqué, N., Guelachvili, G. & Civis, S. 2000. JChPh, 113, 2134.
- (69)
- (70) Pilbratt, G., Riedinger, J.R., Passvogel, T., et al. 2010, A&A, 518, L1.
- (71)
- (72) Quinn, T.J. 2003, Metro, 40, 103.
- (73)
- (74) Rosmus P. 1979, AcTc, 51, 359
- (75)
- (76) Schutte, C.J.H. 2002. CPL, 353, 389.
- (77)
- (78) Sode, M., Schwarz-Selinger, T. & Jacob, W. 2013, JAP, 114, 063302.
- (79)
- (80) Stecher, T. P. & Milligan, J.E. 1961, AJ, 70, 296.
- (81)
- (82) Stecher, T. P. & Milligan, J.E. 1962, ApJ, 136, 1.
- (83)
- (84) Tanarro, I., Sanz, M.M., Domingo, C., et al. 1994, JPhCh, 98, 5862.
- (85)
- (86) Watson, J. 1980, JMoSp, 80, 411.
- (87)
- (88) Zinchenko, L., Dubrovich, V. & Henkel, C. 2011, MNRAS, 415, L78.
- (89)
| Isotopologue | Line | /cm-1 | aa= estimated uncertainty / 10-5 cm-1 | (o-c) bb(o-c)=() / 10-5 cm-1 | Constant/cm-1 ccNumbers in parentheses are one standard deviation in units of the last quoted digit, as derived from the fit. | |
|---|---|---|---|---|---|---|
| (6) | 2458.36336 | 11.4 | 0.3 | 10.30044364(778) | ||
| (5) | 2482.47613 | 11.3 | -5.5 | 6.21374(154)10-4 | ||
| (4) | 2505.91727 | 10.5 | 7.7 | 2592.651339(42) | ||
| (3) | 2528.67068 | 11.6 | 3.8 | 9.92620133(616) | ||
| (2) | 2550.72091 | 11.8 | -8.9 | 6.127689(908)10-4 | ||
| (1) | 2572.05291 | 13.2 | -2.8 | |||
| 36ArH+ | (0) | 2612.50135 | 11.3 | 5.9 | ||
| (1) | 2631.58798 | 11.1 | -10.6 | |||
| (2) | 2649.89731 | 10.3 | 8.6 | |||
| (3) | 2667.41441 | 10.4 | -0.3 | |||
| (4) | 2684.12561 | 11.9 | 4.6 | |||
| (5) | 2700.01671 | 11.4 | -8.8 | |||
| (6) | 2715.07445 | 11.3 | 0.9 | |||
| (7) | 2729.28504 | 11.0 | 2.0 | |||
| (0) | 2610.70177 | 13.9 | ||||
| (1) | 2629.76268 | 11.2 | ||||
| 38ArH+ | (2) | 2648.04731 | 13.4 | |||
| (3) | 2665.54197 | 14.9 | ||||
| (4) | 2682.23225 | 13.9 |
= 1.824(145)10-01 2.017(813)10-01
=-3.3110(122)10-01 -3.3126(125)10-01
= 6.147(218)10-01 6.157(221)10-01
= 1.25816(439)10-01 1.25312(498)10-01
= 8.006(279)10-01 7.854(290)10-01
= 1.0098(384) 9.929(399)10-01
for ArH+
| (this work)aaUnits are cm-1amuk/2+l. Numbers in parentheses are uncertainties in units of the last quoted digit. An uncertainty of 0 means that the parameter has been fixed. | (previous data)aaUnits are cm-1amuk/2+l. Numbers in parentheses are uncertainties in units of the last quoted digit. An uncertainty of 0 means that the parameter has been fixed. | ||
|---|---|---|---|
| 1 | 0 | 2688.29968(193) | 2688.29896(345) |
| 2 | 0 | -60.56901(224) | -60.56869(227) |
| 3 | 0 | 4.9333(124)10-01 | 4.9320(123)10-01 |
| 4 | 0 | -2.348(287)10-03 | -2.332(284)10-03 |
| 5 | 0 | -1.154(316)10-04 | -1.162(313)10-04 |
| 6 | 0 | -1.330(132)10-05 | -1.329(131)10-05 |
| 0 | 1 | 10.28307619(216) | 10.28307575(219) |
| 1 | 1 | -3.6901057(708)10-01 | -3.6900543(738)10-01 |
| 2 | 1 | 2.92102(466)10-03 | 2.91688(478)10-03 |
| 3 | 1 | 9.25(165)10-06 | 1.028(168)10-05 |
| 4 | 1 | -2.898(275)10-06 | -3.022(279)10-06 |
| 5 | 1 | -1.948(165)10-07 | -1.896(167)10-07 |
| 0 | 2 | -6.0181686(568)10-04 | -6.0181497(568)10-04 |
| 1 | 2 | 7.89698(914)10-06 | 7.8769(126)10-06 |
| 2 | 2 | 1.469(381)10-08 | 2.146(410)10-08 |
| 3 | 2 | -2.1555(349)10-08 | -2.2871(351)10-08 |
| 4 | 2 | 2.887511467(0)10-10 | 4.188353696(0)10-10 |
| 5 | 2 | -2.276400996(0)10-11 | -2.531285219(0)10-11 |
| 0 | 3 | 1.54073(178)10-08 | 1.54146(187)10-08 |
| 1 | 3 | -3.867(101)10-10 | -3.745(128)10-10 |
| 2 | 3 | -1.441(182)10-11 | -1.732(210)10-11 |
| 3 | 3 | 2.367548148(0)10-13 | 6.839849573(0)10-13 |
| 4 | 3 | -9.706972163(0)10-13 | -1.029987077(0)10-12 |
| 0 | 4 | -8.961(261)10-13 | -9.148(293)10-13 |
| 1 | 4 | 1.074791089(0)10-15 | 2.300842563(0)10-15 |
| 2 | 4 | -1.091227090(0)10-14 | -1.135430007(0)10-14 |
| 3 | 4 | -4.145809861(0)10-16 | -4.269036526(0)10-16 |
| 4 | 4 | 3.101458722(0)10-16 | 3.303414639(0)10-16 |
| 0 | 5 | 2.203620896(0)10-17 | 2.202997632(0)10-17 |
| 1 | 5 | -3.102378289(0)10-18 | -3.367869218(0)10-18 |
| 2 | 5 | 1.657426695(0)10-18 | 1.894902940(0)10-18 |
| 3 | 5 | -5.622789166(0)10-19 | -5.889490755(0)10-19 |
| 0 | 6 | -2.567213307(0)10-21 | -2.537578088(0)10-21 |
| 1 | 6 | -1.281992858(0)10-21 | -1.307682397(0)10-21 |
| 2 | 6 | -4.750748688(0)10-22 | -5.139236544(0)10-22 |
| 3 | 6 | 2.274040168(0)10-22 | 2.408609282(0)10-22 |
| 0 | 7 | -3.390838692(0)10-26 | -3.984572007(0)10-26 |
| 1 | 7 | 1.797128568(0)10-25 | 1.996397008(0)10-25 |
| 2 | 7 | -4.768691261(0)10-26 | -4.646346036(0)10-26 |
| Isotopologue | Units | - | Ref.11References. — (1) This work; (2) Filgueira & Blom (1988); (3) Bowman et al. (1983);(4) Brown et al. (1988); (5) Liu et al. (1987); (6) Brault & Davis (1982); (7) Johns (1984); (8) Laughlin et al. (1988); (9) Odashima et al. (1999) | ||||||||
|---|---|---|---|---|---|---|---|---|---|---|---|
| 36ArH+ | 7 | 6 | 1 | 0 | cm-1 | 2715.0745 | .00011 | 2715.074333 | .000034 | .000117 | 1 |
| 36ArH+ | 8 | 7 | 1 | 0 | cm-1 | 2729.2850 | .00011 | 2729.285196 | .000041 | -.000156 | 1 |
| 36ArH+ | 4 | 3 | 1 | 0 | cm-1 | 2667.4140 | .00100 | 2667.414412 | .000021 | -.000412 | 2 |
| 36ArH+ | 3 | 2 | 1 | 0 | cm-1 | 2649.8960 | .00100 | 2649.897267 | .000022 | -.001267 | 2 |
| 36ArH+ | 2 | 1 | 1 | 0 | cm-1 | 2631.5890 | .00100 | 2631.588125 | .000024 | .000875 | 2 |
| 36ArH+ | 1 | 2 | 1 | 0 | cm-1 | 2550.7200 | .00100 | 2550.720959 | .000026 | -.000959 | 2 |
| 36ArH+ | 2 | 3 | 1 | 0 | cm-1 | 2528.6720 | .00100 | 2528.670669 | .000024 | .001331 | 2 |
| 36ArH+ | 3 | 4 | 1 | 0 | cm-1 | 2505.9180 | .00200 | 2505.917300 | .000022 | .000700 | 2 |
| 36ArD+ | 1 | 0 | 0 | 0 | MHz | 319065.3790 | .06500 | 319065.389737 | .005378 | -.010737 | 3 |
| 38ArH+ | 1 | 0 | 1 | 0 | cm-1 | 2610.7018 | .00014 | 2610.701706 | .000036 | .000064 | 1 |
| 38ArH+ | 2 | 1 | 1 | 0 | cm-1 | 2629.7627 | .00011 | 2629.762543 | .000034 | .000137 | 1 |
Note. — Table 3 is published in its entirety in the electronic edition the Journal. A portion is shown here for guidance regarding its form and content. Frequencies are in cm-1 or in MHz as indicated. These units apply to all the elements of each row. Observed and predicted uncertainties ( and ) are 1 values. Transitions with =0 have been discarded in the fit due to a large value.