Electronic structure of the BaTi2As2O parent compound of the titanium based oxypnictide superconductor
Abstract
The electronic structure of BaTi2As2O, a parent compound of the newly discovered titanium-based oxypnictide superconductors, is studied by angle-resolved photoemission spectroscopy. The electronic structure shows multi-orbital nature and possible three-dimensional character. An anomalous temperature-dependent spectral weight redistribution and broad lineshape indicate the incoherent nature of the spectral function. At the density-wave-like transition temperature around 200 K, a partial gap opens at the Fermi patches. These findings suggest that BaTi2As2O is likely a charge density wave material in the strong interaction regime.
pacs:
71.45.Lr, 75.30.Fv, 74.70.-b, 79.60.BmI Introduction
Planar square lattice made of transition elements and anions has been proven to be a rich playground for high temperature superconductivity, as exemplified in the CuO2 plane of the cuprate high temperature superconductors, and the FeAs or FeSe plane of the iron-based superconductors. Recently, superconductivity has been discovered in Ba1-xNaxTi2Sb2O () Yajima2012 ; Doan2012 , a titanium-based oxypnictide with an anti-CuO2 type Ti2O plane and Sb above and below the center of each Ti2O square. From the structural point of view, such a lattice is an intriguing combination of both CuO2 and FeAs type of lattices, thus it may be another family of unconventional superconductors based on titanium, although the maximal is currently only 5.5 K upon Na doping Doan2012 .
The signature of possible charge density wave or spin density wave has been observed in Ba1-xNaxTi2Sb2O and other compounds with (Ti2Pn2O)2- (Pn=As, Sb) layers Axtell1997 ; Ozawa2004 ; Liu2009 ; Liu2010 ; Wang2010 , resembling that in the iron-based high temperature superconductors. The instability of the ordered state, such as spin fluctuation, often plays an important role in the unconventional superconductivity Singh2012 . Therefore, it is critical to reveal the nature of the density wave transition. Theoretical calculations suggest that the nested Fermi surface sections drive the density wave instability Biani1998 ; Pickett1998 ; Yan2013 . However, the experimental electronic structure of such materials has not been reported. Moreover, density wave order has not been identified in powder neutron diffraction experiments on Na2Ti2Pn2O (Pn=As, Sb) Ozawa2000 ; Ozawa2001 . Only recently have the muon spin rotation and nuclear magnetic resonance studies excluded magnetic order in Ba1-xNaxTi2Sb2O and favor a charge density wave picture Kitagawa2013 ; Rohr2013 .
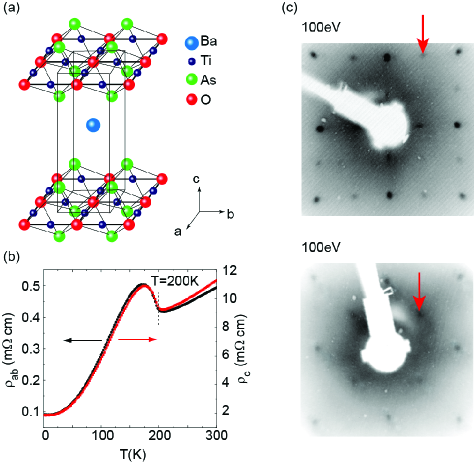
BaTi2As2O is an isostructural compound of the superconducting BaTi2Sb2O, with isovalent substitution of Sb by As [Fig. 1(a)] Wang2010 . Thus it could be viewed as a parent compound of the titanium-based superconductors. A density wave transition takes place around 200 K, as shown by the resistivity data [Fig. 1(b)]. In this Article, we investigate the electronic structure of BaTi2As2O with angle resolved photoemission spectroscopy (ARPES). The photoemission spectra show broad lineshape without sharp quasipartical peak near the Fermi energy (). The spectral weight at EF forms Fermi pockets with parallel sections and Fermi patches (finite spectral weight away from Fermi surfaces). Our polarization and photon energy dependent studies reveal the multi-orbital and three-dimensional nature of this material. Intriguingly, the spectral weight redistributes over a large energy scale as a function of temperature, indicating the incoherent nature of the spectral function. Furthermore, a partial gap opens at the Fermi patches around the density wave transition temperature, which is similar to charge density wave materials in the strong interaction regime Shen2007 ; Shen2008 .
II Experimental
Single crystals of BaTi2As2O were grown by flux method Wang2010 ; Wang2009 . The ARPES data were taken at the Beamline 1 and Beamline 9 of Hiroshima synchrotron radiation center (HiSOR). Temperature dependent study was conducted at Beamline 5-4 of Stanford Synchrotron Radiation Lightsource (SSRL). The 7 eV laser data were taken with an in-house setup at Fudan University. All data were collected with Scienta R4000 electron analyzers. The energy resolution is 20 meV at HiSOR Beamline 1, 10 meV at HiSOR Beamline 9, 5 meV at SSRL, and 4 meV for the laser setup. The samples were cleaved in-situ, and measured under ultrahigh vacuum better than mbar. The low energy electron diffraction (LEED) patterns in Fig. 1(c) indicate the square lattice of cleaved surface [the plane in Fig. 1(a)]. Additional surface reconstruction spots, as indicated by the arrows, appear depending on cleavages and probably come from the reconstruction of the half-layer Ba atoms at the surface similar to those in BaFe2-xCoxAs2 Massee2009 . Aging effects were strictly monitored during the experiments.
III Band structure
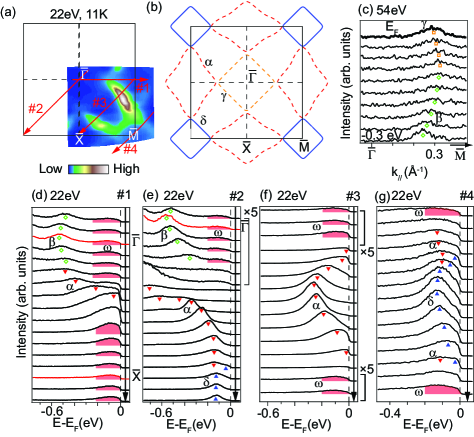
Figure 2(a) shows the photoemission intensity map of BaTi2As2O at . As sketched in Fig. 2(b), the Fermi surfaces in the projected two-dimensional Brillioun zone (BZ) consists of one square shaped hole pocket () around the point, four diamond shaped hole pockets () centered at four X̄ points, and four square shaped electron pockets () centered at four M̄ points. The square shaped pockets at and M̄ show multiple parallel sections, providing possible Fermi surface nesting condition for density wave instabilities, as suggested in previous theoretical calculations Biani1998 ; Pickett1998 ; Singh2012 ; Yan2013 . At the first glance, the Fermi surfaces may come from the warping and hybridization of two sets of quasi-1D sections along and directions Biani1998 . In this case, the Fermi pocket at the zone center should be electron-like; however in contrast to this, the square shaped pocket formed by is a hole pocket. As shown by the momentum distribution curves in Fig. 2(c), an electron-like band fades out below , while a hole-like band appears and crosses near the zone center.
Figure 2(d) shows the energy distribution curves (EDC’s) along -X̄, crossing the hole pockets centered at and X̄ [cut #1 in Fig. 2(a)]. Band contributes prominent spectral weight and forms the hole pocket around X̄. Along cut #2, band disperses towards and coincides with the bottom of band , which forms the electron pocket at zone corner [Fig. 2(e)]. Bands and keep broad lineshape while approaching , and cross without a sharp quasi-particle peak. Along both cut #1 and #2, band is observed below near zone center [Figs. 2(d)-2(e)], while the band , which forms the hole pocket at , could hardly be tracked in EDC’s [Figs. 2(d)-2(e)] due to its weak intensity and nearly vertical dispersion [Fig. 2(c)]. Figure 2(f) shows the dispersion of band along cut #3 between two neighboring hole pockets. In Fig. 2(g), bands and along cut #4 show similar dispersive structures with those near zone corner along cut #2. Moreover, in Figs. 2(d)-2(g), there is spectral weight with broad lineshape (shaded area) between -0.2 eV and , labeled as , contributing finite spectral weight over almost the entire BZ, which resembles the Fermi patches observed in 2H-NaxTaS2 before Shen2007 , which is a charge density wave material with strong electron-phonon interactions.
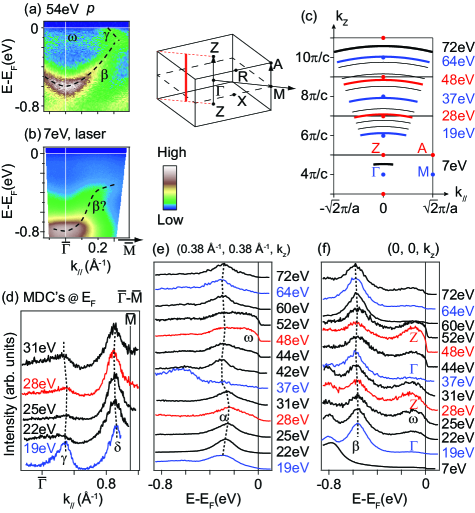
The band dispersion along is investigated by photon energy dependent study. In Figs. 3(a)-3(b), the photoemission spectra taken with 7 eV laser and 54 eV photon energy show distinct band structures. This implies strong dispersion along , consistent with the previous calculations on its sibling materials Pickett1998 ; Singh2012 ; Yan2013 . We have performed a detailed study with photon energies ranging from 19 to 72 eV, covering more than two BZ’s along [Fig. 3(c)]. The dispersions of bands , [Fig. 3(d)], and [Fig. 3(e)] match the period of BZ along if assuming the inner potential to be 12 eV. Moreover, the broad feature shows a variation of intensity that matches the period of BZ [Figs. 3(e)-3(f)]. On the other hand, as shown in Figs. 3(d)-3(f), the dispersion is rather weak above 19 eV. Such a weak dispersion along contradicts the distinct spectra taken with 7 eV laser, suggesting a loss of dispersive information along probably due to the poor resolution for photon energy range [19 eV, 72 eV]. In the universal curve of escaping depth vs. kinetic energy, the mean escaping depth of the photoelectron excited by photons at this energy range is around 7 ÅHufner , yielding a as large as the BZ size. This would largely smear out the dispersive information along and result in a weak dispersion and/or Fermi patches with periodic variation of intensity, as indeed observed in our data. The escaping depth increases rapidly with photon energies from 19 eV to 7 eV by more than three times Hufner , providing a much better resolution, which could explain the distinct spectra taken with 7 eV laser. Intriguingly, the spectra taken with 7 eV photon energy still show intrinsic broad features.
IV Multi-orbital nature of bands near EF
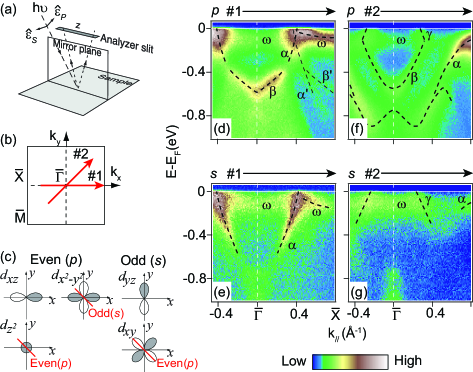
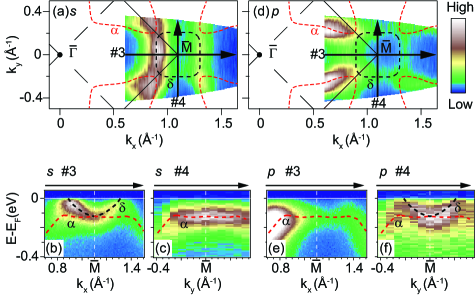
For compounds with (Ti2Pn2O)2- (Pn=As, Sb) layers, the density of states near is dominated by Ti electrons according to theoretical calculations Pickett1998 ; Singh2012 ; Yan2013 , and there is only one electron for each Ti3+ ion. However, our data show multiple bands crossing in BaTi2As2O, suggesting multi-orbital composition of these bands. To reveal the orbital composition near , polarization-dependent ARPES study was conducted in both and geometries. Figure 4(a) shows the geometries of the photoemission experiment setup, where the path of the incident photon beam and the sample surface normal define the mirror plane. The matrix element of photoemission could be described by
where the and are final- and initial-states, respectively Damascelli2003 . Given that the final state is a plane wave and its symmetry is always even against the mirror plane, the photoemission intensity would be suppressed if the initial state and the have opposite symmetries. With the kx and ky directions in Fig. 4(b) defined as the Ti-As-Ti direction, the five orbitals are classified into even and odd symmetries in Fig. 4(c) with respect to the -X-R-Z plane. The symmetries with respect to the -M-A-Z plane are indicated in red [Fig. 4(c)]. In the current experimental setup, the even (odd) orbitals should be visible in () geometry [Fig. 4(c)]. In addition, for the out-of-plane component of the polarized light, the signal of orbitals extending out-of-plane would be enhanced in this geometry.
As illustrated in Fig. 4(b), polarization-dependent ARPES study around was conducted along both -X̄ (#1) and -M̄ (#2) with 48 eV photons. In Fig. 4(d), some features folded from band and show up around X̄ (noted as and ), consistent with the surface reconstruction in the upper panel of Fig. 1(c). In Figs. 4(d)-4(e), the band is visible in both geometries along -X̄, indicating its mixed orbital composition with both odd and even symmetries. The spectral weight of feature is enhanced near X̄ in geometry, indicating orbital with even symmetry or out-of-plane component. At other momenta, is visible in both geometries, suggesting mixed orbital composition.
Along -M̄, the band is visible in geometry [Fig. 4(f)] and suppressed in geometry [Fig. 4(g)], suggesting its even composition along this direction. In Figs. 4(f)-4(g), band and are visible in both geometries, indicating their mixed orbital composition. Band and other features at higher binding energies show even symmetry in both -X̄ and -M̄ direction [Figs. 4(d)-4(g)].
As shown by the Fermi surface mapping in geometry [Fig. 5(a)], the top and bottom edges of pocket is suppressed , while its left and right edges are fairly intensive. Below in geometry, the band is visible along cut #3 but not visible along cut #4 [Figs. 5(b)-5(c)]. In geometry, the band is not visible along cut #3 but visible along cut #4 [Figs. 5(e)-5(f)]. This suggests that the orbital composition of band is odd along cut #3 and even along cut #4, i.e., a switch of orbital symmetries under four fold rotation about M̄.
Around M̄, band shows flat dispersion and is visible in both geometries and along both cuts #3 and #4 [Figs. 5(b)-5(c) and 5(e)-5(f)], indicating mixed orbital composition. A change of orbital composition between the dispersive part and the flat part could be observed from the intensity change of band in Figs. 5(c) and 5(e).
To determine the orbital composition, orbital resolved band structure calculation is required. However, there is no band structure calculation of BaTi2As2O yet. Nevertheless, our results show that the features near come from the hybridization of multiple Ti 3 orbitals. The calculation on BaTi2Sb2O Singh2012 show muti-orbital compostion of the bands near , which supports our findings. The multi-orbital character in BaTi2As2O resembles that in the iron-based superconductors Singh2008 ; Kuroki2008 ; Graser2009 .
V Temperature dependent study
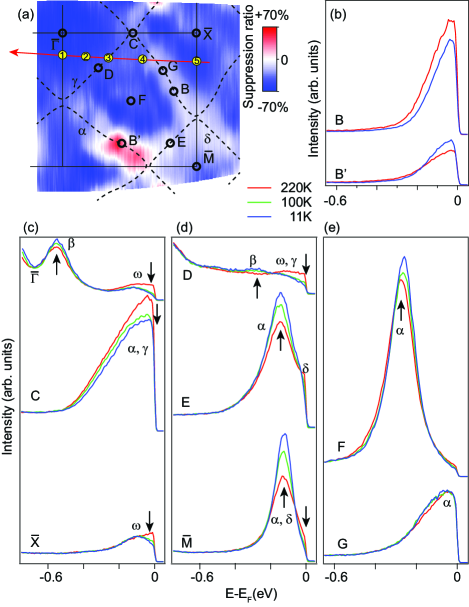
Now we turn to the temperature-dependent study on the density wave transition in BaTi2As2O. In the conventional picture of density wave transition, a gap opens along parallel Fermi surface sheets when the system enters the density wave state Pickett1998 ; Singh2012 ; Yan2013 . Considering the Fermi patches spreading over the BZ and the lack of sharp Fermi crossings, we investigated the temperature dependence over a quarter of the BZ. Figure 6(a) shows the false color map of the spectral weight suppression ratio at from 220 K to 11 K, i.e., . The spectral weight is suppressed at the Fermi patches away from Fermi crossings, where the broad feature dominates. The parallel Fermi surface sheets formed by bands and , where density wave instability was suggested, do not show prominent suppression. Most part of the pocket shows weak suppression, while one branch at the lower side of BZ shows great enhancement, as exemplified by comparing the temperature dependence of EDC’s at momenta B and B’ [Fig. 6(b)]. The partial suppression of spectral weight at is consistent with the metallic behavior below transition [Fig. 1(b)], and agrees with previous optical study on its sibling material Na2Ti2As2O Huang2013 . However, such an asymmetric suppression/enhancement for the pocket cannot be explained by matrix element effect, possibly due to other momentum dependent effects.
Figures 6(c)-6(e) show the EDC’s at various momenta as marked in Fig. 6(a). The EDC’s are divide by the resolution convolved Fermi-Dirac function at corresponding temperature and multiplied by that of 11 K to remove thermal broadening effect near . The suppression of spectral weight takes place near , as indicated by the down arrows on the EDC’s for momenta , C, X̄ [Fig. 6(c)], D, and M̄ [Fig. 6(d)]. On the other hand, the spectral weight of bands , , and below enhances with decreasing temperature [up arrows in Figs. 6(c)-6(e)]. Thus the evolution of spectral weight distribution with temperature could be viewed as a spectral weight redistribution from Fermi patches at to the dispersive bands at higher binding energies, which saves energy. The energy scale of the spectral weight redistribution ranges from 0.1 eV for bands at zone corner, to 0.6 eV for band at zone center, which is far beyond the energy range of thermal effect and is not expected in a non-interacting electron system. The spectral weight enhancement for bands , , and do not slow down below 100 K [up arrows in Figs. 6(c)-6(e)], indicating that it is not relevant to the density wave transition around 200 K. Similar large scale spectral weight redistribution was observed in Sr2CuO2Cl2, which is explained by multiple initial-/final-states induced by strong coupling between electrons and bosons Kim2002 . The large scale spectral weight redistribution in BaTi2As2O could originate from similar strong coupling effect, which is probably momentum dependent and induces an asymmetric suppression/enhancement as observed in Fig. 6(a). On the other hand, the spectral weight suppression at mostly takes place between 220 K and 100 K [down arrows in Figs. 6(c)-6(e)], suggesting density wave transition related component.
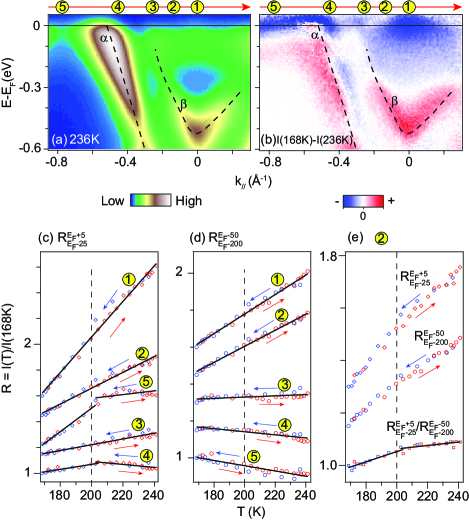
In order to investigate the density wave transition related component, we conduct detailed temperature-dependent study around 200 K along the cut through momenta \footnotesize{1}⃝\footnotesize{5}⃝ as marked in Fig. 6(a). This cut is selected to cover momenta \footnotesize{1}⃝ and \footnotesize{2}⃝ (the Fermi patch inside the Fermi surface ), momentum \footnotesize{5}⃝ (the Fermi patch inside the Fermi surface ), and momentum \footnotesize{4}⃝ (the Fermi patch between the Fermi surfaces), while the bands and are resolved [Fig. 7(a)]. Figure 7(b) shows the spectral weight difference between 236 K and 168 K. The major suppression of spectral weight takes place around , while the enhancement is mainly at higher binding energies on bands and , demonstrating the spectral weight redistribution. Detailed temperature evolution of relative spectral weight at momenta \footnotesize{1}⃝\footnotesize{5}⃝ are plotted in Figs. 7(c)-7(d), for energy window [-25 meV, +5 meV] (), and [-200 meV, -50 meV] (), respectively. At most momenta and binding energies, the spectral weight show smooth suppression/enhancement though 200 K, demonstrating the spectral weight redistribution independent of the density wave transition. On the other hand, slope changes are observed around 200 K for momentum \footnotesize{4}⃝ and \footnotesize{5}⃝ [Fig. 7(c)], indicating gap opening of density wave transition at these momentum. At momentum \footnotesize{2}⃝, after dividing the temperature-dependent curve of by that of , both of which show smooth evolution, a slope change around 200 K is readily observable [/ in Fig. 7(e)], demonstrating a partial gap opening buried under the large spectral weight redistribution. Note that the density wave transition related slope changes take place at Fermi patches (e.g., momenta \footnotesize{2}⃝, \footnotesize{4}⃝, and \footnotesize{5}⃝) without well-defined Fermi surfaces, suggesting that the partial gap opening takes place at Fermi patches, rather than at the nested Fermi surface sections based on the conventional density wave picture Pickett1998 ; Singh2012 ; Yan2013 .
VI Discussions and conclusion
The dispersive features in photoemission spectra of BaTi2As2O show broad lineshape and cross without sharp quasiparticle peaks. On the other hand, the overall bandwidth show little renormalization compared with the calculated band structure of sibling materials Singh2012 ; Yan2013 . These characters resemble those in polaronic systems like La1.2Sr1.8Mn2O7, where incoherent broad features dominate the photoemission spectra with vanishingly small quasiparticle weight, while following the bare band dispersion Mannella2005 ; Dessau1998 . The polaronic picture is further supported by the large scale temperature-dependent spectral weight redistribution, which resembles that in Sr2CuO2Cl2 induced by strong electron correlations with phonons or magnetic excitations Kim2002 .
Due to the interference of large scale temperature-dependent spectral weight redistribution, it is hard to extract the exact momentum distribution of density wave gap opening. However, the signature of partial gap opening on Fermi patches rather than Fermi surfaces provides some clue for further investigation. Since the Fermi patches partly come from the convolving of highly -dispersive bands, an out-of-plane nesting vector could be expected to form the density wave instability, like that in VSe2 Strocov2012 . On the other hand, charge density wave instability formed by Fermi patches or barely occupied states were reported in 2H-NaxTaS2 and NbSe2 Shen2007 ; Shen2008 , which show polaronic signatures. Therefore, BaTi2As2O is likely a similar charge density wave material in the strong interaction regime. Moreover, considering the conventional s-wave superconductivity in 2H-NaxTaS2 and NbSe2 and recent reports Kitagawa2013 ; Rohr2013 ; Subedi2013 , the superconductivity in titanium oxypnictides could also be conventional.
In summary, we have carried out a systematic ARPES study on BaTi2As2O and revealed its band structure with multi-orbital nature and possible three-dimensional character. The spectral weight at forms both Fermi surfaces and Fermi patches. Broad lineshape and anomalous temperature dependence of spectral weight redistribution suggest the incoherent nature of the spectral functions due to strong interactions. Partial gap opening at the transition temperature are observed on Fermi patches rather than the parallel sections of Fermi surfaces, which resembles charge density wave materials in the strong interaction regime.
VII Acknowledgements
We gratefully acknowledge the helpful discussions with Prof. J. P. Hu. This work is supported in part by the National Science Foundation of China, and the National Basic Research Program of China (973 Program) under the grant Nos. 2012CB921400, 2011CB921802, 2011CBA00112, 2011CB309703, 91026016. SSRL is operated by the US DOE, BES, Divisions of Chemical Sciences and Material Sciences.
References
- (1) T. Yajima, K. Nakano, F. Takeiri, T. Ono, Y. Hosokoshi, Y. Matsushita, J. Heister, Y. Kobayashi, and H. Kageyama, J. Phys. Soc. Jpn. 81, 103706 (2012).
- (2) P. Doan, M. Gooch, Z. Tang, B. Lorenz, A. Moeller, J. Tapp, P. C. W. Chu, and A. M. Guloy, J. Am. Chem. Soc. 134, 16520 (2012).
- (3) X.F. Wang, Y.J. Yan, J.J. Ying, Q.J. Li, M. Zhang, N.Xu, and X.H. Chen, J. Phys.: Condens. Matter 22, 075702 (2010).
- (4) E. A. Axtell, III, T. Ozawa, S. M. Kauzlarich, and R. R. P. Singh, J. Solid State Chem. 134, 423 (1997).
- (5) T. C. Ozawa, S. M. Kauzlarich, J. of Cryst. Growth 265, 571 (2004).
- (6) R. H. Liu, D. Tan, Y. A. Song, Q. J. Li, Y. J. Yan, J. J. Ying, Y. L. Xie, X. F. Wang, and X. H. Chen, Phys. Rev. B 80, 144516 (2009).
- (7) R. H. Liu, Y. A. Song, Q. J. Li, J. J. Ying, Y. J. Yan, Y. He, and X. H. Chen, Chem. of Mater. 22, 1503 (2010).
- (8) D. J. Singh, New J. Phys. 14, 123003 (2012).
- (9) F. F. Biani, P. Alemany, E. Canadell, Inorg. Chem. 37, 5807 (1998).
- (10) W.E. Pickett, Phys. Rev. B 58, 4335 (1998).
- (11) X. W. Yan, Z. Y. Lu, J. Phys.: Condens. Matter 25, 365501 (2013).
- (12) T. C. Ozawa, R. Pantoja, E. A. Axtell, III, S. M. Kauzlarich, J. E. Greedan, M. Bieringer, J. W. Richardson Jr., J. Solid State Chem. 153, 275 (2000).
- (13) T. C. Ozawa, S. M. Kauzlarich, M. Bieringer and J. E. Greedan, Chem. Mater. 13, 1804 (2001).
- (14) S. Kitagawa, K. Ishida, K. Nakano, T. Yajima, and H. Kageyama, Phys. Rev. B 87, 060510 (2013).
- (15) F. von Rohr, A. Schilling, R. Nesper, C. Baines, and M. Bendele, Phys. Rev. B 88, 140501 (2013).
- (16) D.W. Shen, B. P. Xie, J. F. Zhao, L. X. Yang, L. Fang, J. Shi, R. H. He, D. H. Lu, H. H. Wen, and D. L. Feng, Phys. Rev. Lett. 99, 216404 (2007).
- (17) D.W. Shen,, Y. Zhang, L. X. Yang, J.Wei, H.W. Ou, J. K. Dong, B. P. Xie, C. He, J. F. Zhao, B. Zhou, M. Arita, K. Shimada, H. Namatame, M. Taniguchi, J. Shi, and D. L. Feng, Phys. Rev. Lett. 101, 226406 (2008).
- (18) X. F. Wang, T. Wu, G. Wu, H. Chen, Y. L. Xie, J. J. Ying, Y. J. Yan, R. H. Liu, and X. H. Chen, Phys. Rev. Lett. 102, 117005 (2009).
- (19) F. Massee, S. de Jong, Y. Huang, J. Kaas, E. van Heumen, J. B. Goedkoop, and M. S. Golden, Phys. Rev. B 80, 140507 (2009).
- (20) S. Hüfner, Photoelectron Spectroscopy: Principles and Application (Springer-Verlag, New York, 1995).
- (21) A. Damascelli, Z. Hussain, and Z.-X. Shen, Rev. Mod. Phys. 75, 473 (2003).
- (22) K. Kuroki, S. Onari, R. Arita, H. Usui, Y. Tanaka, H. Kontani, and H. Aoki, Phys. Rev. Lett. 101, 087004 (2008).
- (23) S. Graser, T. A. Maier, P. J. Hirschfeld, and D. J. Scalapino, New J. Phys. 11, 025016 (2009).
- (24) D. J. Singh and M. H. Du, Phys. Rev. Lett. 100, 237003 (2008).
- (25) Y. Huang, H. P. Wang, W. D. Wang, Y. G. Shi, and N. L. Wang, Phys. Rev. B 87, 100507 (2013).
- (26) C. Kim, F. Ronning, A. Damascelli, D. L. Feng, Z.-X. Shen, B. O. Wells, Y. J. Kim, R. J. Birgeneau, M. A. Kastner, L. L. Miller, H. Eisaki and S. Uchida, Phys. Rev. B 65, 174516 (2002).
- (27) N. Mannella, W. L. Yang, X. J. Zhou, H. Zheng, J. F. Mitchell, J. Zaanen, T. P. Devereaux, N. Nagaosa, Z. Hussain, and Z.-X. Shen, Nature 438, 474 (2005).
- (28) D. S. Dessau, T. Saitoh, C.-H. Park, Z.-X. Shen, P. Villella, N. Hamada, Y. Moritomo, and Y. Tokura, Phys. Rev. Lett. 81, 192 (1998).
- (29) V. N. Strocov, M. Shi, M. Kobayashi, C. Monney, X. Wang, J. Krempasky, T. Schmitt, L. Patthey, H. Berger, and P. Blaha, Phys. Rev. Lett. 109, 086401 (2012).
- (30) A. Subedi, Phys. Rev. B 87, 054506 (2013).