Characterization of the Praesepe Star Cluster by Photometry and Proper Motions with 2MASS, PPMXL, and Pan-STARRS
Abstract
Membership identification is the first step to determine the properties of a star cluster. Low-mass members in particular could be used to trace the dynamical history, such as mass segregation, stellar evaporation, or tidal stripping, of a star cluster in its Galactic environment. We identified member candidates with stellar masses 0.11–2.4 M☉ of the intermediate-age Praesepe cluster (M 44), by using Pan-STARRS and 2MASS photometry, and PPMXL proper motions. Within a sky area of 3 deg radius, 1040 candidates are identified, of which 96 are new inclusions. Using the same set of selection criteria on field stars led to an estimate of a false positive rate 16%, suggesting 872 of the candidates being true members. This most complete and reliable membership list allows us to favor the BT-Settl model in comparison with other stellar models. The cluster shows a distinct binary track above the main sequence, with a binary frequency of 20–40%, and a high occurrence rate of similar mass pairs. The mass function is consistent with that of the disk population but shows a deficit of members below 0.3 solar masses. A clear mass segregation is evidenced, with the lowest-mass members in our sample being evaporated from this disintegrating cluster.
1 Introduction
A star cluster manifests itself as a density concentration of comoving stars in space. Born out of the same molecular cloud, the member stars have roughly the same age, similar chemical composition, and are at essentially the same distance from us. Star clusters, therefore, serve as good test beds to study stellar formation and evolution. In order to diagnose the properties of a star cluster, such as its age, distance, size, spatial distribution, mass function, etc., it is necessary to identify as completely as possible the member stars. In particular, with a sample of members including the lowest mass stars, or even substellar objects, one could trace the dynamical history of an open cluster, e.g., the effect of mass segregation, stellar evaporation, and tidal stripping in the Galactic environment.
Nearby open clusters are useful in study of their low-mass population. Praesepe (M 44; NGC 2632; the Beehive Cluster) is such a rich ( members) and intermediate-age (757 Myr; Gáspár et al., 2009) stellar aggregation in Cancer, as a member in the Hyades moving group (Eggen, 1960), also called the Hyades supercluster. Compared to Praesepe, the Hyades cluster itself has a scattered main sequence in the color-magnitude diagram (CMD) because of the significant depth with respect to its distance. The advantages of studying stars in Praesepe are numerous. First, with a distance determination ranging from 170 pc (Reglero & Fabregat, 1991) to 184 pc (An et al., 2007), the cluster is close enough to detect low-mass stars or even brown dwarfs. In this work, we adopted a distance pc (Gáspár et al., 2009), and metallicity [Fe/H]=0.16 (Carrera & Pancino, 2011). Second, the proper motion (PM) of the cluster is distinct from that of the field stars, so contamination is minimized when identifying member stars. Third, in contrast to a star cluster at birth, for which the spatial distribution of members is governed by the parental cloud structure, the stellar distribution in an evolved cluster depends mainly on the interaction between members, from which we could investigate the dynamical evolution of the cluster.
Early PM measurements of Praesepe included the pioneering work by Klein Wassink (1927) to identify bright members within a 1-deg radius of the cluster center, and by Jones & Cudworth (1983) who extended the detection limit to mag to include intermediate-mass members. Wang et al. (1995) combined early data and presented a list of nearly 200 PM members. Using PMs and photometry, Jones & Stauffer (1991) identified a list of member candidates from to 18 mag within 2° of the cluster center. Using optical and infrared photometry, Williams et al. (1995) selected member candidates with mass and concluded a mass function similar to the field, with no evidence of stellar evaporation. Wang et al. (2011) summarized the photometric surveys of Praesepe members down to the hydrogen-burning limit. Notably, Hambly et al. (1995a), with a limiting magnitude of mag, thereby reaching the stellar mass of M☉, derived a rising mass function toward the low-mass end, and presented evidence of mass segregation (Hambly et al., 1995b). With the Two Micron All Sky Survey (2MASS) and Digital Sky Survey data covering a sky area of 100 deg2, Adams et al. (2002) extended the lower main sequence to 0.1 M☉, and determined the radial density profile of member stars. Kraus & Hillenbrand (2007) surveyed a sky area of 300 deg2 to identify members by optical to infrared spectral energy distribution, and by PM measurements taken from UCAC2 for bright stars or calculated from USNO-B1 and SDSS positions, reaching almost into the brown-dwarf regime. Their sample of early-type stars is incomplete because of the bright limit of UCAC2, whereas for later-type members the incompleteness is caused by the detection limits of USNO-B1 and 2MASS. Recently Khalaj & Baumgardt (2013) used SDSS and PPMXL data to characterize the stellar members, including the mass segregation effect and binarity.
There have been efforts to identify brown dwarfs in Praesepe. Pinfield et al. (1997) covered one deg2 down to mag and identified 19 brown-dwarf candidates without spectral confirmation. Chappelle et al. (2005) presented deep optical and near-infrared observations covering 2.6 deg2 to a mass limit of 0.06 M☉. González-García et al. (2006) explored the central 0.6 deg radius region, reaching a limit of mag corresponding to 0.05–0.13 M☉, and identified one substellar candidate. Boudreault et al. (2010) performed an optical band and near-infrared and band photometric survey covering 3.1 deg2 with detection limits of mag and mag, and found a handful of substellar candidates. The substellar census was augmented by Wang et al. (2011) who, using very deep optical ( and -band) photometry of the central 0.59 deg2 region of the cluster, identified a few dozen substellar member candidates. The first spectroscopically confirmed L dwarf member in Praesepe was secured by Boudreault & Lodieu (2013).
The stellar mass function of Praesepe was found to rise until 0.1 M☉ (Hambly et al., 1995b; Chappelle et al., 2005; Baker et al., 2010; Boudreault et al., 2010), in contrast to the Hyades, which have about the same age but are deficient of very low-mass stars and brown dwarfs. Possible explanations include different initial mass functions for the two clusters, or that Praesepe somehow did not experience as much dynamical perturbation in its environments (Bouvier et al., 2008). A recent study with the UKIRT Infrared Deep Sky Survey (UKIDSS) Galactic Clusters Survey derived a declining mass function toward lower masses (Boudreault et al., 2012). One of the aims of this work is to secure a sample of highly probable members to address this issue.
The spatial distribution of star in a cluster is initially governed by the structure in the parental molecular cloud. As a star cluster ages, gravitational scattering by stellar encounters results in mass segregation (Spitzer & Shull, 1975); that is, massive stars tend to concentrate toward the center of the cluster, whereas lower mass stars, with a greater velocity dispersion, are distributed out to greater radii. For Praesepe, Hambly et al. (1995a) combined their observations, complete to mag and mag, with those of Mermilliod et al. (1990) with mag, to show a clear mass segregation effect. While brown dwarfs may have a preferred spatial distribution within a young star cluster (Caballero, 2008), they tend to be distributed uniformly as the cluster evolves de la Fuente Marcos & de la Fuente Marcos (2000).
Observational attempts to find and characterize members in a star cluster often are sufficiently deep but limited in sky coverage, or cover wide areas but are restricted to only brighter (more massive) members. Studies with large sky coverages usually secure membership on the basis of photometry, lacking PM measurements for faint members. In this paper, we present photometric (2MASS and Pan-STARRS) and astrometric (PPMXL) diagnostics to select the member candidates in Praesepe. Our sample allows us to characterize the cluster including the binarity, its size, the mass function and the segregation effect. We describe the photometric and PM data in Section 2, and how we identified probable members in Section 3. The discussion is in Section 4, for which we compare our results with those in the literature. The binarity is discussed, and evidence of mass segregation and tidal stripping is presented. The paper ends with a short summary as Section 5.
2 Data Sources
Data used in this study include photometry and PM measurements within a 5-deg radius around the Praesepe center (R.A.=, Decl., J2000). Archival data were taken from the 2MASS Point Sources Catalog, PPMXL, and Pan-STARRS. The 2MASS Point Source Catalog (Skrutskie et al., 2006) has the 10 detection limits of mag, mag, and mag, and saturates around 4–5 mag. The typical astrometric accuracy for the brightest unsaturated sources is about 70–80 mas. PPMXL is an all-sky merged catalog based on the USNO-B1 and 2MASS positions of 900 million stars and galaxies, reaching a limiting mag (Roeser et al., 2010). The typical error is less than 2 milliarcseconds (mas) per year for the brightest stars with Tycho-2 (Høg et al., 2000) observations, and is more than 10 mas yr-1 at the faint limit.
Pan-STARRS (the Panoramic Survey Telescope And Rapid Response System) is a wide field (7 deg2) imaging system, with a 1.8 m, f/4.4 telescope (Hodapp et al., 2004), equipped with a 1.4 giga-pixel camera (Tonry et al., 2008). The prototype (PS1), located atop Haleakala, Maui, USA (Kaiser et al., 2010), has been patrolling the entire sky north of declination since mid-2010. Repeated observations of the same patch of sky with a combination of , , , , and bands several times a month produce a huge inventory of celestial objects that vary in brightness or in position. Deep static sky images and catalog of stars and galaxies are also obtained. The PS1 filters differ slightly from those of the SDSS (Abazajian et al., 2009). The filter extends 20 nm redward of for greater sensitivity and lower systematics for photometric redshift estimates. SDSS has no corresponding filter (Tonry et al., 2012a). The limiting magnitudes are mag, mag, mag, mag, and mag, with the saturation limit of mag. Upon completion of its 3.5 year mission by early 2014, PS1 will provide reliable photometry and astrometry. While incremental photometry of PS1 is available at the moment, the calibration of astrometry, hence the PM measurements, will need yet to tie down the entire sky, so no PS1 PM data were used here. The photometric analysis and calibration is described in Magnier et al. (2013). PS1 photometry for each detected object has measurements at multiple epochs, but for the work reported here only the average magnitude is used. In our study, we therefore made use of the 2MASS photometry for stars too bright for PS1, plus the PS1 photometry for faint stars, and the PPMXL PMs to select and characterize stellar member candidates. In matching counterparts in different star catalogues, one arcsecond was used as the coincidence radius among PPMXL, PS1, and 2MASS sources.
3 Candidate Selection
Our membership diagnosis relies on grouping in sky position, in PMs, and along the isochrones appropriate for the cluster in the infrared and optical CMDs. The sources with 2MASS photometric uncertainties greater than 0.05 mag, roughly reaching mag, mag, and mag, were removed from the sample. Candidacy was then further winnowed in the versus CMD by including only objects with colors within 0.3 mag from the Padova isochrones (Marigo et al., 2008). This initial, wide range of colors allowed us not to adopt an a priori stellar evolutionary model, but in turn to put different models to test, as demonstrated below.
With the initial photometric sample, we then identified stars with PMs close to that of the cluster. Obviously the choice of the range is a compromise between the quality and the quantity of the candidate list. The optimal range was decided by how the cluster grouping is blended with the field. The PPMXL data toward Praesepe are shown in Figure 1. The PM distribution has two peaks, one for the cluster ( mas yr-1, mas yr-1) and the other for field stars ( mas yr-1, mas yr-1). The latter is the reflex Galactic motion of the Sun toward this particular line of sight. The average PM we adopted for the cluster is close to those listed by SIMBAD, mas yr-1, and mas yr-1 (Loktin & Beshenov, 2003). Naturally, around the peak of the cluster, the distribution is dominated by members, and away from the peak the contamination by field stars becomes prominent. In fact, Praesepe is among a few cases where the cluster’s motion is clearly separated from that of the field, so the PM distribution exhibits a distinct secondary peak due to the cluster.

We exercised two levels of PM selection. First, a Gaussian function was fitted to the secondary (cluster) peak. Even through the distribution is known to be non-Gaussian (Girard et al., 1989), the top part of the peak can be reasonably approximated by a Gaussian with a standard deviation of 9 mas yr-1. This is the PM range, namely within mas yr-1 of the cluster’s average PM, that we adopted to select PM membership. This range is similar to that used by Kraus & Hillenbrand (2007) (8 mas yr-1) or by Boudreault et al. (2012) (8 mas yr-1 in and 12 mas yr-1 in ). We note that Boudreault et al. (2012) derived, using relative PMs on the basis of the UKIDDS data, a different mean motion ( mas yr-1, mas yr-1). The discrepancy may arise because these authors used the median value to choose the center of the PM range, yet the distribution is skewed because of the contribution from the field. The next level of PM selection is mas yr-1, at which there is about the same contribution from the cluster and from the field, i.e., a 50% contamination of the sample. Figure 2 compares the cases of 4 versus 9 mas yr-1. While bright candidates, including giant stars, are not much affected by the choice, the cluster sequence clearly stands out with the narrower PM range even without restrictions on position, color, or magnitude. The adoption of mas yr-1 facilitates comparison between our results and previous works. But the mas yr-1 sample was still kept for a more reliable selection of candidates. Figure 2 also shows the PM distribution projected on the line connecting the peak of the field and the peak of the cluster. Even with this projection showing the maximum distinction between the two peaks, the distribution near the cluster is overwhelmed by that of the field.

Figure 3 shows the radial density profile of stars following roughly the cluster’s isochrone and PM within the entire field. The surface density decreases monotonically until around , then levels off. Our analysis therefore was conducted within a spatial radius of 3°. At 179 pc, this corresponds to a linear dimension of pc across. This size is relatively large among the 1657 entries with both angular diameter and distance determinations in the open cluster catalog compiled by Dias et al. (2002)111Updated to January 2013, available at http://www.astro.iag.usp.br/$∼$wilton/., with the majority having diameters of 2–4 pc.

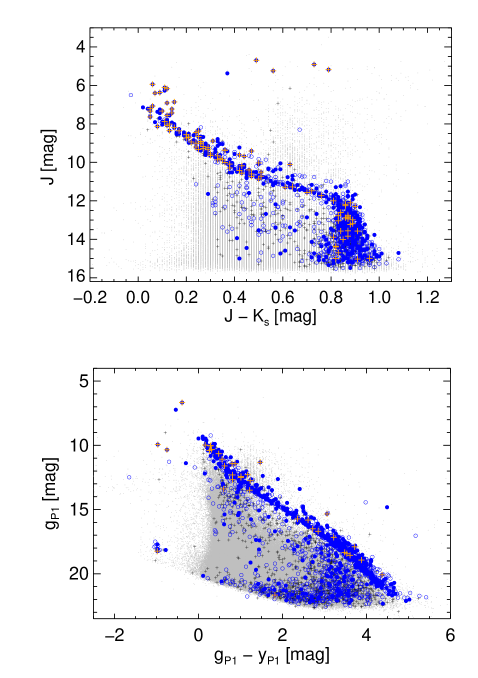
Figure 4 shows the versus and the versus CMDs when the spatial (within or beyond 3° angular distance from the cluster center) and PM criteria (within 9 or 4 mas yr-1) are applied. Even without a preselection by photometry or color, the cluster sequence is already evident. A subsample was chosen with a much restrictive set of parameters, namely with the angular distance within the central 30′, and with mas yr-1. This subsample is incomplete, but consists of highly secured members, which validates our initial rough selection ranges of magnitude and colors, and can be used to compare various stellar atmospheric models.
For the 2MASS/PPMXL sample, photometric candidacy is selected in the versus CMD: (i) for stars brighter than mag, from 0.06 mag below to 0.18 mag above and perpendicular to the Padova track; for giants there is no photometric restriction, i.e., only the spatial and kinematic criteria were applied; (ii) for fainter stars, from 0.1 mag below to 0.1 mag above and perpendicular to the Siess isochrone.
For stars fainter than the 2MASS sensitivity, we resorted to the PS1 data collected up to January 2012. The luminosity function toward Praesepe reaches beyond mag, but our data are limited by the sensitivity of the PPMXL dataset at around 21 mag. To avoid spurious detections, only sources that have been measured more than twice in both and bands were included in our analysis. The magnitudes were derived from the SDSS magnitudes (taken from Kraus & Hillenbrand, 2007) transformed to the PS1 photometric system (Tonry et al., 2012a), namely, by , where . For the magnitudes, because SDSS has no corresponding , the transformation from was used, , where is again . Because of this, plus the Paschen absorption, the transformation to (and to ) has a larger uncertainty than in other bands (Tonry et al., 2012a). In the transformation to either or , using the quadratic instead of the linear fit makes little difference. The bottom panel of Figure 4 plots versus together with the PS1 main sequence transformed from Kraus & Hillenbrand (2007). For the PS1/PPMXL sample, the selection range is from 0.15 mag below to 0.4 mag above and perpendicular to the Kraus & Hillenbrand (2007) main sequence transformed to the PS1 system (Tonry et al., 2012a).
The combination of the 2MASS/PPMXL and the PS1/PPMXL samples contains a total of 1040 stars that satisfy all the criteria of photometry (along the isochrone), kinematics (consistent PMs), and spatial (within a 3° radius) grouping. In comparison, there are 168 stars satisfying the identical set of criteria except being with radii between 4° and (which happens to have the same sky area as the 3° cluster radius, i.e., deg2) — these are considered field stars and this number of stars should be subtracted from the cluster region. So our final list contains 1040 member candidates, among which about 872 () should be true cluster members. Statistically a brighter candidate is more likely to be a true member than a fainter candidate because of the field contamination. If the stringent criterion of mas yr-1 had been used instead, the number of candidates would have become 547 within , and 33 between and , yielding a net of 514 members within , yielding a 6% false positive rate.
4 The Updated Member List
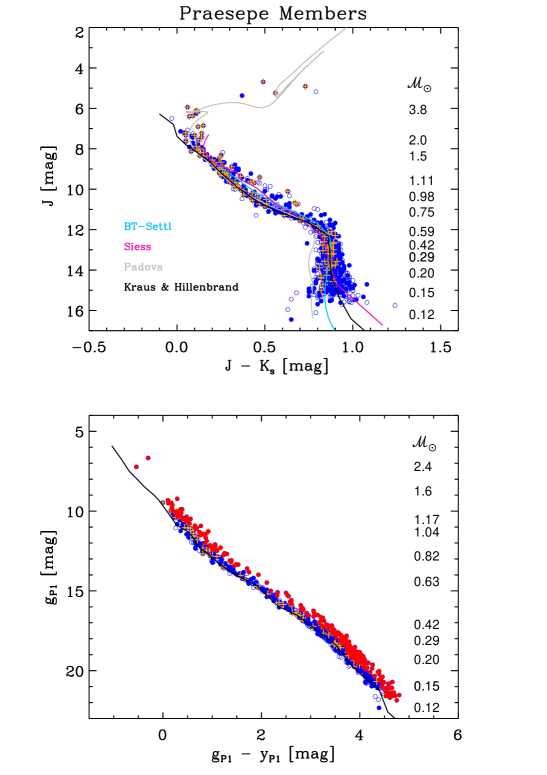
Table 1 lists the properties of the 1040 candidates. The first two columns, (1) and (2), are the identification number and coordinates. Columns (3) and (4) give the PM measurements and errors in right ascension and in declination taken from the PPMXL catalog. Subsequent columns, from (5) to (12), list the photometric magnitudes and corresponding errors of PS1 , , , , and , and 2MASS , , and . The (13) column flags if the candidate is possibly binary. The last (14) column lists the common star name, if any. The 2MASS and PS1 CMDs of the members listed in Table 1 are displayed in Figure 5, along with a selected stellar models: BT-Settl (Allard et al., 2013; Allard, 2014)222http://perso.ens-lyon.fr/france.allard/, the latest of NextGen models by Hauschildt et al. (1999) using the solar abundance of Asplund et al. (2009), Siess et al. (2000), Padova (Marigo et al., 2008), and Kraus & Hillenbrand (2007). To convert the effective temperature in the Siess et al. (2000) models to , , and magnitudes, we made use of the table presented in Kenyon & Hartmann (1995). While all isochrones follow roughly each other for mag, they differ noticeably toward faint magnitudes. The Padova isochrone is too blue to fit the data. This cannot be caused by reddening because Praesepe is very nearby, so is hardly reddened mag (Taylor, 2006). The rest four stellar models, though diverging toward the lowest mass end of our data, fit the data equally well. The highly secured list of candidates indicates a better fit with the BT-Settl model.
| No. | R.A. Decl. (J2000) | Flag | Remarks | ||||||||||
|---|---|---|---|---|---|---|---|---|---|---|---|---|---|
| [deg] | [mas yr-1] | [mas yr-1] | [mag] | [mag] | [mag] | [mag] | [mag] | [mag] | [mag] | [mag] | |||
| (1) | (2) | (3) | (4) | (5) | (6) | (7) | (8) | (9) | (10) | (11) | (12) | (13) | (14) |
| 413 | 129.7619871 19.7248670 | 0 | BD20 2140 | ||||||||||
| 414 | 129.7620587 19.5325438 | 1 | |||||||||||
| 415 | 129.7627808 19.4043081 | 1 | |||||||||||
| 416 | 129.7633143 20.0437781 | 0 | |||||||||||
| 417 | 129.7651196 19.9997784 | 0 | HD 73430 | ||||||||||
| 418 | 129.7663424 20.5672773 | 1 | |||||||||||
| 419 | 129.7670607 19.5226714 | 0 | |||||||||||
| 420 | 129.7712342 19.7573463 | 1 | |||||||||||
| 421 | 129.7717692 20.1172023 | 0 | HD 73429 | ||||||||||
| 422 | 129.7754141 19.6768137 | 0 | HD 73449 |
Note. — Table 1 is published in its entirety in the electronic edition of the journal. A portion is shown here for guidance regarding its form and content.
Our member candidates have been selected as grouping in five out of six-dimensional photometric and kinematic parameters, less only the radial velocity measurements. Our list hence is more reliable than using photometry alone, and is comprehensive in terms of stellar mass and sky area coverage than currently available. Among the 1040 candidates, 214 were selected by the 2MASS/PPMXL sample only, 82 by PS1/PPMXL only, and 742 by both. The reason that PS1/PPMXL does not find more candidates is, other than the limit at the bright end, because the faintest candidates are very red, mag — in favor of 2MASS detection — and because the PS1/PPMXL data are limited by the brightness limit of PPMXL. The situation will improve once PS1 produces its own PM measurements. A total of 890 of our candidates coincide with those by Kraus & Hillenbrand (2007), 567 with those by Boudreault et al. (2012), and 190 with neither. Of the latter, 96 candidates have not been identified in either Hambly et al. (1995b), Pinfield et al. (1997), Adams et al. (2002), or Baker et al. (2010). Some of our candidates missed by Boudreault et al. (2012) are located in the UKIDSS survey gap.
Membership identification by photometry alone, e.g., by González-García et al. (2006) and Boudreault et al. (2010), is vulnerable to significant contamination by field stars, so reliable membership could be secured for bright stars only. To illustrate this, the entire PS1/PPMXL 5° sample contains 320,312 stars. There would have been 2445 candidates if only the photometric and positional criteria were set, but the number reduces drastically to 826 once the additional PM criterion ( mas yr-1) is imposed.
Our member list includes the two stars recently reported by Quinn et al. (2012), BD20 2184 (their Pr 0201=NGC 2632 KW 418) and 2MASS J084211491916373 (their Pr 0211=NGC 2632 KW 448), to host exoplanets. A few candidates found in previous works did not pass our PM selection. For example, stars J083850.6192317 and J084108.01914901, listed by González-García et al. (2006) as members on the basis of optical and infrared photometry, have PMs ( mas yr-1 and mas yr-1 for J083850.6192317, and mas yr-1 and mas yr-1 for J084108.01914901) inconsistent with being part of Praesepe. Another highly probable member suggested by González-García et al. (2006), J084039.3192840, already refuted by Boudreault et al. (2010) because of its () color, is indeed not in our candidate list. Of the six brown dwarf candidates proposed by Boudreault et al. (2010, their Table 5), only three are found in our data, though the identification for either stars No. 099, or No. 909 is uncertain because of a nearby star in each case (see the finding charts in their Fig. 8). Only star No. 910 may have a PPMXL counterpart within 10″, but it has a proper motion ( mas yr-1, mas yr) inconsistent with membership. The brown dwarf candidate found by Magazzù et al. (1998), NGC 2632 Roque Praesepe 1, was not in our list because of its faint magnitude ( mag).
van Leeuwen (2009) identified, but not tabulated, 24 Hipparcos members in Praesepe. With the identifications kindly provided by van Leeuwen, we confirm that they are all enlisted in our candidate sample. The blue stragglers in the cluster suggested by Andrievsky (1998), HD 73666, HD 73819, HD 73618, HD 73210, too bright for PS1, are all confirmed to be PM members. Our photometric selection precludes the white dwarfs known in the cluster (Dobbie et al., 2004, 2006). They are too faint for 2MASS but have been recovered by PPMXL and PS1, illustrated in Figure 4. One additional white dwarf candidate is identified in our data (, , J2000; mas yr-1, mas yr-1) with mag, and mag. The white dwarf members follow the general cooling sequence from brighter/bluer to fainter/redder in the CMD. Scaled with white dwarfs in the field, studied by Tonry et al. (2012b) also with PS1 data, the ones in Praesepe have a cooling time scale of 0.2–0.4 Gyr.
4.1 Binary Fraction
A binary system with identical component stars would have the brightness of either star overestimated by 0.75 mag. A binary sequence therefore is often seen as a swath up to 0.7–0.8 mag above the main sequence of a star cluster in a CMD. Multiple systems may have even larger magnitude differences. Steele & Jameson (1995) and Hodgkin et al. (1999) estimated a multiplicity of for low-mass members in Praesepe. In both the 2MASS and PS1 CMDs (see Figure 5), the binary sequence stands out clearly. Such a distinct binary sequence was already noticed by Kraus & Hillenbrand (2007). Note that the versus main sequence is characterized by a slanted upper part and turns nearly vertically below the mass of M☉. While the upper main sequence allows us to gauge the distance (shifting vertically), the vertical segment provides a convenient tool to estimate the reddening of a cluster (shifting horizontally). This fact, however, also means the versus CMD cannot be used to evaluate the binarity at the lower main sequence. Instead, the PS1 CMD shows a monotonic track, so is useful for this purpose.
There is no clear dividing line above the main sequence to separate binaries from single stars. The bottom panel of Figure 5 demonstrates a magnitude difference of 0.5 mag above the main sequence as the dividing line. In this case, there are 242 stars above the line, or a binary fraction of about 23% of the total 1040 member candidates. No attempt was made to estimate separately the binarity of the 872 true member versus the 168 interloper samples. If the difference is lower to 0.4 mag or 0.3 mag, the number increases, respectively, to 302 (29%) or 389 (37%). The relatively small increase in the binary fraction is the consequence of a distinct binary sequence of this cluster; that is, the binaries in Praesepe tend to be of similar-mass systems, as noted, for example, by Pinfield et al. (2003). Praesepe also seems to teem with multiple systems, as concluded by Khalaj & Baumgardt (2013). Boudreault et al. (2012) conducted an elaborative analysis on the binarity. Adopting a brightness range from 0.376 to 1.5 mag above the (single star) main sequence, these authors derived a binary frequency of for the mass range of 0.45 to 0.2 M☉, for 0.2 to 0.1 M☉, and for 0.1 to 0.07 M☉. Given the uncertainties in membership and binarity assignments, our data do not justify division of the sample into different mass bins, and we infer an overall binary frequency (or multiplicity) of at least 20–40%.
4.2 Cluster Mass Function
The stellar mass was interpolated via a least-square polynomial fitting to the (if too bright in PS1) or magnitude using the compilation of Kraus & Hillenbrand (2007) (their Table 5), and adopting a distance modulus of 6.26 mag. The band observations saturate around mag, corresponding to mag in our sample, or about 0.6 M☉. The masses of our candidates range from M☉ to M☉.
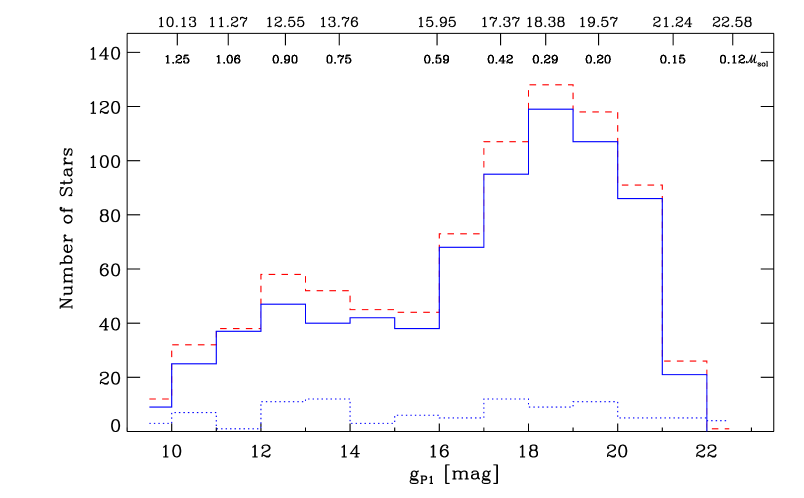
The luminosity function of the cluster was derived by subtraction of the field contamination. For field stars, we selected the stars satisfying the same PM and isochrone criteria, but with angular distance between and from the cluster center. In Figure 6, the luminosity function of the member candidates listed in Table 1 is subtracted by that of the field. The field distribution is flat, as expected, and contributes only as a small correction to the observed luminosity function. The corrected luminosity function rises spuriously near the PS1 saturation limit of 11–15 mag, and then turns around near mag, or mass M☉.
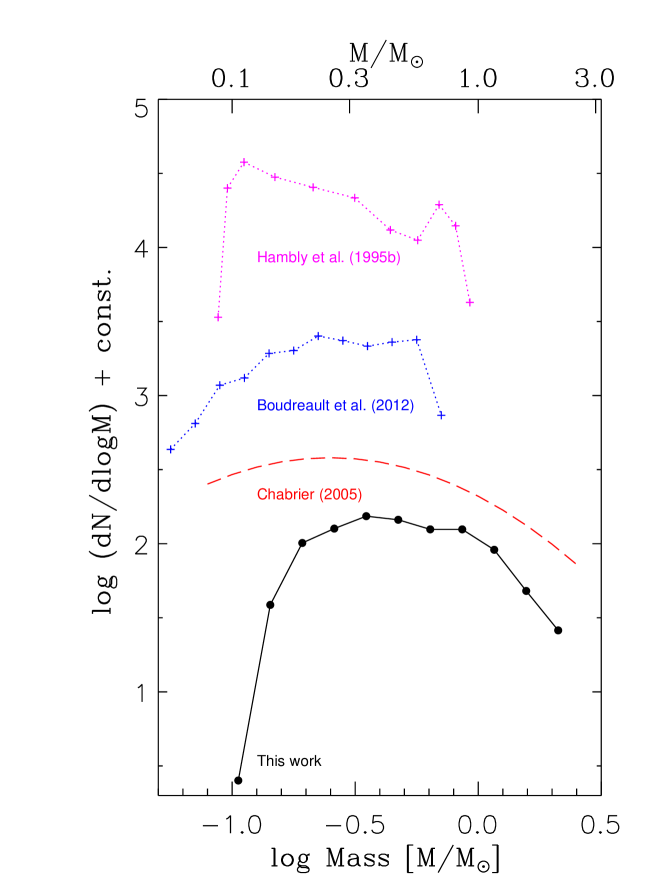
The mass function of Praesepe members is shown in Figure 7. We note that this is the mass function for the stellar systems, i.e., with no binary correction. Using optical band and near-infrared and photometric data, Boudreault et al. (2010) reported a rising mass function in the range from 0.6 M☉ to 0.1 M☉ then turning over, in agreement with previous works, e.g., by Hambly et al. (1995b). This increase in number with decreasing mass was shown by Wang et al. (2011) to continue into the brown dwarf regime, peaking around MJup then decrease until about MJup. Kraus & Hillenbrand (2007) and Baker et al. (2010) also derived a rising, but flatter, mass function. On the other hand, Boudreault et al. (2012), using also the UKIDSS photometry, but adding additional proper motion information, obtained an opposite result, namely, a declining mass function between 0.6 M☉ and 0.1 M☉, different from those by Hambly et al. (1995b), Chabrier (2005), Kraus & Hillenbrand (2007), Baker et al. (2010), and Boudreault et al. (2010). Our sample is more complete at the higher mass end than that by Boudreault et al. (2012), but otherwise the mass function is consistent with theirs for stellar masses greater than around 0.3 M☉. Overall, the mass function we obtained resembles that of the disk population (Chabrier, 2005) for the massive part, but shows a deficit of the lowest mass population ( M☉).
4.3 Spatial Distribution of Members
Even the youngest star clusters may have elongated shape (Chen, Chen, & Shu, 2004), likely a consequence of filamentary structure in the parental clouds. Subsequent encounters among member stars then circularize the core of a cluster. Mass segregation occurs as energy losing massive stars sink to the center, whereas lower-mass members gain energies and occupy a larger volume in space. Some stars may gain sufficient speed so as to escape the system. The lowest mass members are particularly vulnerable to such stellar “evaporation”. As the cluster evolves, the internal gravitational pull becomes weaker and external disturbances, such as differential rotation, or tidal force from passing molecular clouds and from the Galactic disk, act together to distort the shape of a cluster and eventually tear it apart. The deformation and tidal stripping are effective even for globular clusters (Chen & Chen, 2010).
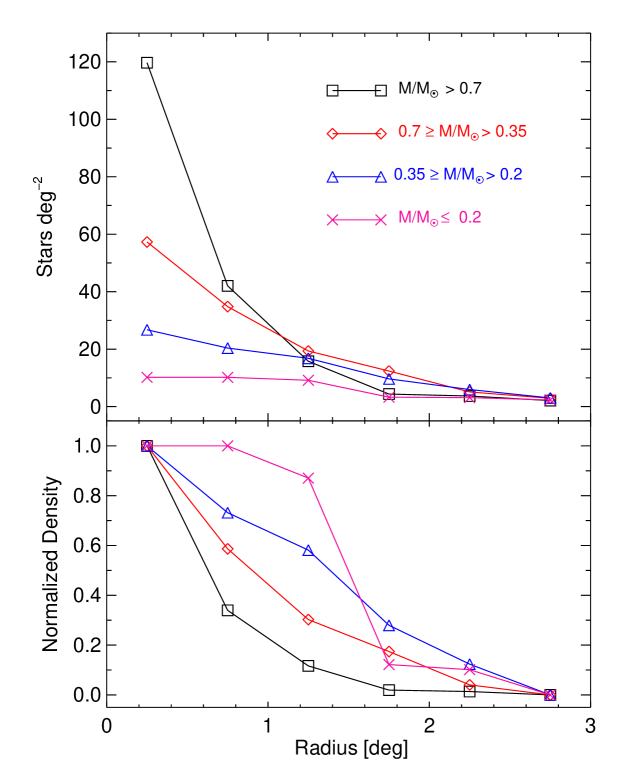
Figure 8 shows how the stellar mass correlates with the spatial distribution. The radial density profiles have been computed for four different mass groups: M/M (129 stars), M/M0.2–0.35 (256 stars), M/M0.35–0.7 (332 stars), and M/M (323 stars). The top panel shows the observed density profiles, while the bottom panel compares the normalized profiles. Because of the normalization, no correction of the field contamination is necessary. Relatively massive members appear to be centrally concentrated, whereas lower mass members are more scattered spatially, a result of mass segregation.
Mass segregation in Praesepe was well demonstrated already by Hambly et al. (1995b), Kraus & Hillenbrand (2007), and Khalaj & Baumgardt (2013). Our result is consistent with that by Hambly et al. (1995b) from 0.85 M☉ to 0.15 M☉. When the radial density distribution shown in Figure 8 is parameterized with an exponential form, , the least-squared fitting yields (for members ), 0.96 (0.35–0.7 M☉), and 0.42 (0.2–0.35 M☉). Caballero (2008) suggested that a power-law function may be more appropriate. In any case, for the faintest sample, the density distribution is certainly not exponential. Instead, it exhibits a sharp truncation beyond 1°. We interpret this as a consequence of stellar evaporation. This further supports the notion of a relative lack of low-mass stars in Praesepe, as already demonstrated in Figure 7.
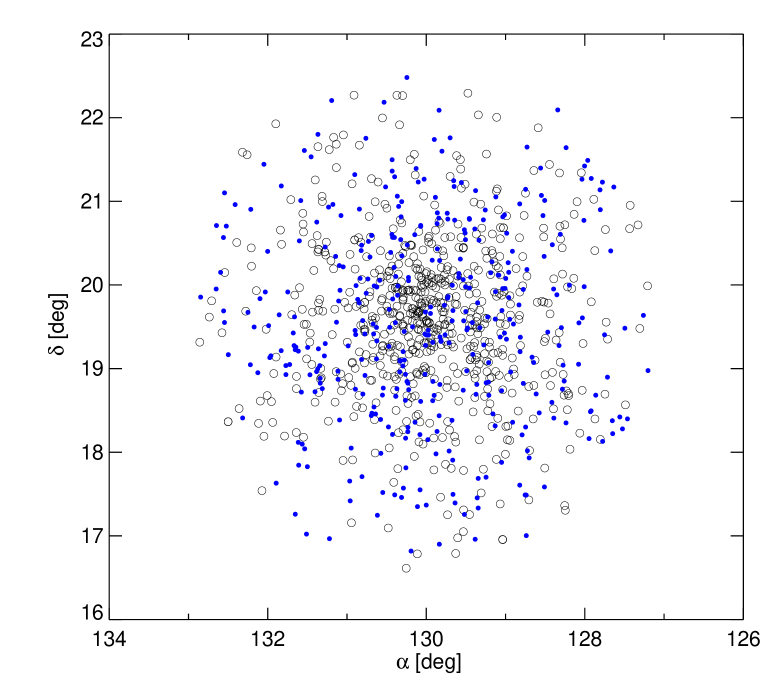
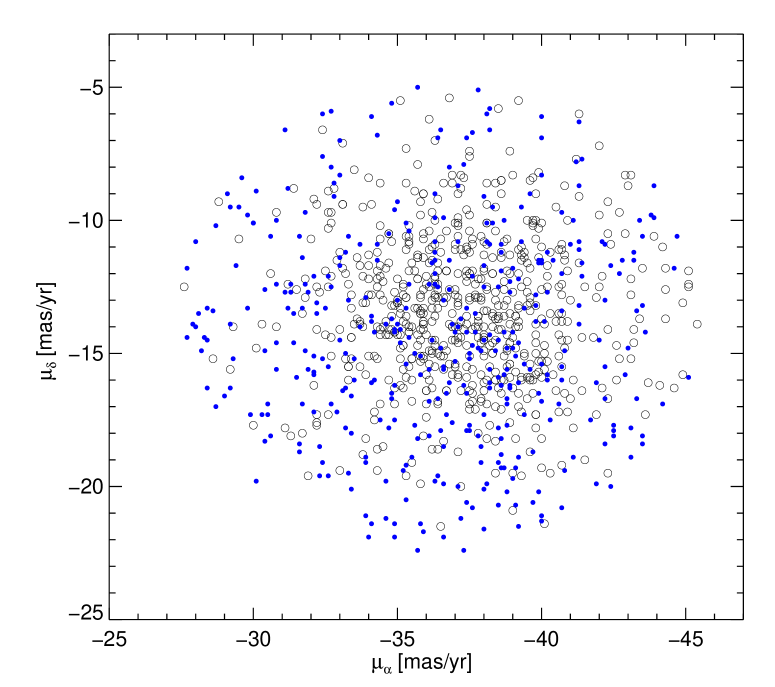
Mass segregation is further manifested by the positional (Figure 9) and PM distributions (Figure. 10) of the members; namely, relatively massive members are concentrated in a smaller volume in space, and have a smaller velocity dispersion than lower-mass stars. The average stellar mass in our sample is M☉, close to that for a Miller-Scalo initial mass function. With the total number of members , the total stellar mass in the cluster then amounts to at least . The lowest mass stars, with a declining mass function, do not contribute significantly to the total mass. With a radius pc, the velocity dispersion of the cluster then would be km s-1, which is noticeably less than the typical value of 1–2 km s-1 for Galactic open clusters. At the assumed distance of 179 pc to Praesepe, an intracluster PM dispersion of 1 mas yr-1 corresponds to a velocity dispersion of 0.8 km s-1. Our data thus are not precise enough to measure any PM gradient among members.
The evidence is mounting that Praesepe is dissolving. It is spatially extended with a sparse stellar density. Holland et al. (2000) suggested that Praesepe might consist of two merging clusters. The relatively high fraction of equal mass pairs (and of multiples) may be the consequence of occasional stellar ejection during three-body encounters (Binney & Tremaine, 1987), or during the merging process. Relevant time scales for a dissolving star cluster include: () the dynamical (crossing) time scale, , () the relaxation time, , and (iii) the evaporation time, (Binney & Tremaine, 1987). For Praesepe, these time scales are yr, yr, and yr, respectively. The lowest-mass members, having an average escape probability (Spitzer, 1987) several times of that for the most massive stars, are particularly susceptible to ejection. The Praesepe cluster therefore is almost fully relaxed, and tidal stripping has occurred, starting with the lowest mass members being witnessed to escape from the cluster.
5 Summary
We have conducted a photometric and proper motion selection of member stars of the Galactic open cluster Praesepe, using 2MASS, PPMXL and Pan-STARRS data. Our sample is comprehensive in terms of sky area (3° radius), limiting magnitude ( mag), and reliability ( false positive rate). A total of 1040 member candidates are identified, 872 of which are highly probable members, down to about 0.1 solar masses. While for members more massive than 0.6 M☉, the Padova isochrone works well, the BT-Settl atmospheric model fits better toward fainter magnitudes. The binary frequency of Praesepe members is about 20–40%, with a relatively high occurrence of similar mass pairs. The mass function is consistent with that of the disk population, but with a deficit of stars less massive than 0.3 M☉. Members show a clear evidence of mass segregation, with the lowest mass population being evaporated from the system. At the faint magnitude end, the bottleneck of membership selection for very faint objects remains the sensitivity of the PM measurements. Once the PS1 completes its survey in early 2014, increasing the photometric depth and the stellar PM baseline to more than 3.5 years, we expect to secure member lists for nearby star clusters well into the substellar regime.
We thank the referee, José A. Caballero, who provided very constructive comments on an earlier version to greatly improve the quality of the paper. We are grateful to Steve Boudreault for providing published data to produce Figure 7. The Pan-STARRS1 Surveys (PS1) have been made possible through contributions of the Institute for Astronomy, the University of Hawaii, the Pan-STARRS Project Office, the Max-Planck Society and its participating institutes, the Max Planck Institute for Astronomy, Heidelberg and the Max Planck Institute for Extraterrestrial Physics, Garching, The Johns Hopkins University, Durham University, the University of Edinburgh, Queen’s University Belfast, the Harvard-Smithsonian Center for Astrophysics, the Las Cumbres Observatory Global Telescope Network Incorporated, the National Central University of Taiwan, the Space Telescope Science Institute, the National Aeronautics and Space Administration under Grant No. NNX08AR22G issued through the Planetary Science Division of the NASA Science Mission Directorate, the National Science Foundation under Grant No. AST-1238877, and the University of Maryland. The NCU group is financially supported partially by the grant NSC101-2628-M-008-002.
References
- Abazajian et al. (2009) Abazajian, K. N., Adelman-McCarthy, J. K., Agüeros, M. A., et al. 2009, ApJS, 182, 543
- Adams et al. (2002) Adams, J. D., Stauffer, J. R., Skrutskie, M. F., et al. 2002, AJ, 124, 1570
- Ahumada & Lapasset (1995) Ahumada, J., & Lapasset, E. 1995, A&AS, 109, 375
- An et al. (2007) An, D., Terndrup, D. M., Pinsonneault, M. H., Paulson, D. B., Hanson, R. B.,& Stauffer, J. R. 2007, ApJ, 655, 233
- Allard et al. (2013) Allard, F., Homeier, D., & Freytag, B. 2013, Mem. Soc. Astron. Italiana, 84, 1053
- Allard (2014) Allard, F. 2014, IAU Symposium, 299, 271
- Andrievsky (1998) Andrievsky, S. M. 1998, A&A, 334, 139
- Asplund et al. (2009) Asplund, M., Grevesse, N., Sauval, A. J., & Scott, P. 2009, ARA&A, 47, 481
- Baker et al. (2010) Baker, D. E. A., Jameson, R. F., Casewell, S. L., et al. 2010, MNRAS, 408, 2457
- Baraffe et al. (1998) Baraffe, I., Chabrier, G., Allard, F., & Hauschildt, P. H. 1998, A&A, 337, 403
- Binney & Tremaine (1987) Binney, J., & Tremaine, S. 1987, Galactic Dynamics, Princeton, NJ, Princeton University Press, 1987
- Boudreault et al. (2010) Boudreault, S., Bailer-Jones, C. A. L., Goldman, B., Henning, T., & Caballero, J. A. 2010, A&A, 510, A27
- Boudreault et al. (2012) Boudreault, S., Lodieu, N., Deacon, N. R., & Hambly, N. C. 2012, MNRAS, 426, 3419
- Boudreault & Lodieu (2013) Boudreault, S., & Lodieu, N. 2013, MNRAS, 434, 142
- Bouvier et al. (2008) Bouvier, J., Kendall, T., Meeus, G., et al. 2008, A&A, 481, 661
- Caballero (2008) Caballero, J. A. 2008, MNRAS, 383, 375
- Carrera & Pancino (2011) Carrera, R., & Pancino, E. 2011, A&A, 535, A30
- Chabrier (2005) Chabrier, G. 2005, in The Initial Mass Function 50 Years Later, Eds. E. Corbelli and F. Palle (Springer, Dordrecht) Ap&SSL, 327, 41
- Chappelle et al. (2005) Chappelle, R. J., Pinfield, D. J., Steele, I. A., Dobbie, P. D., & Magazzù, A. 2005, MNRAS, 361, 1323
- Chen, Chen, & Shu (2004) Chen, W. P., Chen, C. W., & Shu, C. G. 2004, AJ, 128, 2306
- Chen & Chen (2010) Chen, C. W., & Chen, W. P. 2010, ApJ, 721, 1790
- de la Fuente Marcos & de la Fuente Marcos (2000) de la Fuente Marcos, R., & de la Fuente Marcos, C. 2000, Ap&SS, 271, 127
- Dias et al. (2002) Dias, W. S., et al. 2002, A&A, 389, 871
- Dobbie et al. (2004) Dobbie, P. D., Pinfield, D. J., Napiwotzki, R., et al. 2004, MNRAS, 355, L39
- Dobbie et al. (2006) Dobbie, P. D., Napiwotzki, R., Burleigh, M. R., et al. 2006, MNRAS, 369, 383
- Eggen (1960) Eggen, O. J. 1960, MNRAS, 120, 540
- Fossati et al. (2008) Fossati, L., et al. 2008, A&A, 483, 891
- Gáspár et al. (2009) Gáspár, A., Rieke, G. H., Su, K. Y. L., et al. 2009, ApJ, 697, 1578
- Girard et al. (1989) Girard, T. M., Grundy, W. M., López, C. E., & van Altena, W. F. 1989, AJ, 98, 227
- González-García et al. (2006) González-García, B. M., Zapatero Osorio, M. R., Béjar, V. J. S., et al. 2006, A&A, 460, 799
- Hambly et al. (1995a) Hambly, N. C., Steele, I. A., Hawkins, M. R. S., & Jameson, R. F. 1995a, A&AS, 109, 29
- Hambly et al. (1995b) Hambly, N. C., Steele, I. A., Hawkins, M. R. S., & Jameson, R. F. 1995b, MNRAS, 273, 505
- Hauschildt et al. (1999) Hauschildt, P. H., Allard, F., & Baron, E. 1999, ApJ, 512, 377
- Hodapp et al. (2004) Hodapp, K.W., Siegmund,W. A., Kaiser, N., et al. 2004, Proc. SPIE, 5489, 667
- Hodgkin et al. (1999) Hodgkin, S. T., Pinfield, D. J., Jameson, R. F., et al. 1999, MNRAS, 310, 87
- Høg et al. (2000) Høg, E., Fabricius, C., Makarov, V. V., et al. 2000, A&A, 355, L27
- Holland et al. (2000) Holland, K., Jameson, R. F., Hodgkin, S., Davies, M. B., & Pinfield, D. 2000, MNRAS, 319, 956
- Jones & Cudworth (1983) Jones, B. F., & Cudworth, K. 1983, AJ, 88, 215
- Jones & Stauffer (1991) Jones, B. F., & Stauffer, J. R. 1991, AJ, 102, 1080
- Kaiser et al. (2010) Kaiser, N., et al. 2010, Proc. SPIE, 7733, 77330E
- Khalaj & Baumgardt (2013) Khalaj, P., & Baumgardt, H. 2013, MNRAS, 434, 3236
- Klein Wassink (1927) Klein Wassink, W. J. 1927, Pub. of the Kapteyn Astron. Laboratory Groningen, 41, 1
- Kenyon & Hartmann (1995) Kenyon, S. J., & Hartmann, L. 1995, ApJS, 101, 117
- Kraus & Hillenbrand (2007) Kraus, A. L., & Hillenbrand, L. A. 2007, AJ, 134, 2340
- Loktin & Beshenov (2003) Loktin, A. V., & Beshenov, G. V. 2003, Astron. Rep., 47, 6
- Magazzù et al. (1998) Magazù, A., Rebolo, R., Zapatero Osorio, M. R., Martín, E. L., & Hodgkin, S. T. 1998, ApJ, 497, L47
- Magnier et al. (2013) Magnier, E. A., Schlafly, E., Finkbeiner, D., et al. 2013, ApJS, 205, 20
- Marigo et al. (2008) Marigo, P., Girardi, L., Bressan, A., et al. 2008, A&A, 482, 883
- Mermilliod et al. (1990) Mermilliod, J.-C., Weis, E. W., Duquennoy, A., & Mayor, M. 1990, A&A, 235, 114
- Muench et al. (2002) Muench, A. A., Lada, E. A., Lada, C. J., & Alves, J. 2002, ApJ, 573, 366
- Pinfield et al. (1997) Pinfield, D. J., Hodgkin, S. T., Jameson, R. F., Cossburn, M. R., & von Hippel, T. 1997, MNRAS, 287, 180
- Pinfield et al. (2003) Pinfield, D. J., Dobbie, P. D., Jameson, R. F., et al. 2003, MNRAS, 342, 1241
- Quinn et al. (2012) Quinn, S. N., White, R. J., Latham, D. W., et al. 2012, ApJ, 756, L33
- Reglero & Fabregat (1991) Reglero, V., & Fabregat, J. 1991, A&AS, 90, 25
- Roeser et al. (2010) Roeser, S., Demleitner, M., & Schilbach, E. 2010, AJ, 139, 2440
- Siess et al. (1997) Siess, L., Forestini, M., & Dougados, C. 1997, A&A, 324, 556
- Siess et al. (2000) Siess, L., Dufour, E., & Forestini, M. 2000, A&A, 358, 593
- Skrutskie et al. (2006) Skrutskie, M. F., Cutri, R. M., Stiening, R., et al. 2006, AJ, 131, 1163
- Spitzer & Shull (1975) Spitzer, L., Jr., & Shull, J. M. 1975, ApJ, 201, 773
- Spitzer (1987) Spitzer, L. 1987, “Dynamical Evolution of Globular Clusters”, Princeton, NJ, Princeton University Press, 1987
- Steele & Jameson (1995) Steele, I. A., & Jameson, R. F. 1995, MNRAS, 272, 630
- Taylor (2006) Taylor, B. J. 2006, AJ, 132, 2453
- Tonry et al. (2008) Tonry, J. L., Burke, B. E., Isani, S., Onaka, P. M., & Cooper, M. J. 2008, Proc. SPIE, 7021, 702105
- Tonry et al. (2012a) Tonry, J. L., Stubbs, C. W., Lykke, K. R., et al. 2012, ApJ, 750, 99
- Tonry et al. (2012b) Tonry, J. L., Stubbs, C. W., Kilic, M., et al. 2012, ApJ, 745, 42
- van Leeuwen (2007) van Leeuwen, F. 2007, A&A, 474, 653
- van Leeuwen (2009) van Leeuwen, F. 2009, A&A, 497, 209
- Wang et al. (1995) Wang, J. J., Chen, L., Zhao, J. H., & Jiang, P. F. 1995, A&AS, 113, 419
- Wang et al. (2011) Wang, W., Boudreault, S., Goldman, B., et al. 2011, A&A, 531, A164
- Williams et al. (1995) Williams, D. M., Rieke, G. H., & Stauffer, J. R. 1995, ApJ, 445, 359