Evidence for leptonic CP phase from NOA , T2K and ICAL: A chronological progression
Abstract
We study the synergy between the long-baseline (LBL) experiments NOA and T2K and the atmospheric neutrino experiment ICAL@INO for obtaining the first hint of CP violation in the lepton sector. We also discuss how precisely the leptonic CP phase () can be measured by these experiments. The CP sensitivity is first described at the level of oscillation probabilities, discussing its dependence on the parameters – , mass hierarchy and . In particular, we discuss how the precise knowledge or lack thereof of these parameters can affect the CP sensitivity of LBL experiments. We follow a staged approach and analyze the sensitivity that can be achieved at different points of time over the next 15 years from these LBL experiments alone and/or in conjunction with ICAL@INO. We find that the CP sensitivity of NOA /T2K is enhanced due to the synergies between the different channels and between the two experiments. On the other hand the lack of knowledge of hierarchy and octant makes the CP sensitivity poorer for some parameter ranges. Addition of ICAL data to T2K and NOA can exclude these spurious wrong-hierarchy and/or wrong-octant solutions and cause a significant increase in the range of values for which a hint of CP violation can be achieved. In fact in parameter regions unfavourable for NOA /T2K, we may get the first evidence of CP violation by adding the ICAL data to these. Similarly the precision with which can be measured also improves with inclusion of ICAL data.
I Introduction
In the present status of neutrino oscillation physics, a fair amount of knowledge about the oscillation parameters has been gained from solar, atmospheric, accelerator and reactor experiments. In the standard 3-flavour scenario there are 6 parameters governing the oscillation of the neutrinos. These are the three mixing angles — , , , two mass squared differences – () and the Dirac CP phase . Among these the unknown parameters are: (i) the sign of ( corresponds to Normal Hierarchy (NH); corresponds to Inverted Hierarchy (IH) ) (ii) the octant of ( corresponding to Higher Octant (HO) or corresponding to Lower Octant (LO)). (iii) the CP phase ; a value of this parameter different from 0 or would signal CP violation in the lepton sector. 111The current best-fit value of is in the lower octant but at 2 the higher octant values are allowed. Also reference Fogli et al. (2012) shows a preference for though this is not statistically significant. Recently a 1 hint towards NH has been reported in Zhang and Ma (2013).
CP violation has been observed in the quark sector and this can be explained by the complex phase of the CKM matrix Christenson et al. (1964); Aubert et al. (2001); Abe et al. (2001). The origin of this could be complex Yukawa couplings and/or complex vacuum expectation values of the Higgs field Lee (1973, 1974). In such cases it is plausible that there can be a complex phase analogous to the CKM phase, in the leptonic mixing matrix as well 222In the quark sector there is only one CP phase associated with the CKM matrix. However if neutrino are Majorana particle then the leptonic mixing matrix contains three phases in general. However oscillation experiments are sensitive only to the Dirac CP phase .. This can lead to CP violation in the lepton sector Branco et al. (2012). However experimental detection of this phase is necessary to establish this expectation on a firm footing. The determination of the leptonic CP phase is interesting not only in the context of fully determining the MNSP mixing matrix but also because it could be responsible for the observed matter-antimatter asymmetry through the mechanism of leptogenesis Joshipura et al. (2001); Endoh et al. (2002).
Since occurs with the mixing angle in the MNSP matrix, the recent measurement of a non-zero and moderately large value of this angle by reactor and accelerator experiments is expected to be conducive for the measurement of . The current best-fit value of from global oscillation analyses is Fogli et al. (2012); Forero et al. (2012); Gonzalez-Garcia et al. (2012). If was very small then any measurement of would have required high intensity sources Bandyopadhyay et al. (2009). However the moderately large value of makes it worthwhile to explore whether can be measured and any evidence of CP violation can be obtained by the current and upcoming experiments using conventional beams. Many recent studies have investigated this issue Machado et al. (2013); Agarwalla et al. (2013a); Agarwalla et al. (2012); Prakash et al. (2012); Blennow et al. (2013a) in the context of the LBL experiment T2K which is currently running Abe et al. (2011a) and NOA Ayres et al. (2004) which is expected to start taking data in near future. Earlier studies on measurement of leptonic CP violation by conventional superbeam experiments can be found in Burguet-Castell et al. (2001); Huber et al. (2009); Ishitsuka et al. (2005); Mena and Parke (2004); Mena et al. (2006).
A potential problem in determining comes from the lack of knowledge of hierarchy which gives rise to wrong hierarchy-wrong solutions Minakata and Nunokawa (2001); Barger et al. (2002). A prior knowledge of hierarchy can help to eliminate these fake solutions thereby enhancing the CP sensitivity. However since the baselines of T2K and NOA are not too large they have limited hierarchy sensitivity. Moreover this depends on the true value of chosen by nature Minakata and Nunokawa (2001); Minakata and Sugiyama (2004). It has been shown recently in Prakash et al. (2012) that these experiments can determine hierarchy at 90% C.L. only for favourable combination of parameters — ({, NH} or {, IH}). However for the complementary unfavourable combinations, the hierarchy sensitivity of these experiments is low, because of which their sensitivity is compromised.
In this paper, we expand on the observation made in Ghosh et al. (2013a) regarding the synergy between existing and upcoming atmospheric and long-baseline experiments for measuring . The central idea is that due to the large value of atmospheric neutrinos passing through the earth experience appreciable matter effects leading to an enhanced hierarchy sensitivity. Moreover this sensitivity does not depend crucially on the true values. Thus addition of atmospheric information to the data from LBL experiments can increase the hierarchy sensitivity in the unfavourable region for the latter. This feature leads to an enhanced CP sensitivity for LBL experiments when atmospheric data is included in the analysis Ghosh et al. (2013a). This is despite atmospheric neutrino experiments themselves not having any appreciable sensitivity to Gandhi et al. (2007). Usually, studies of CP sensitivity are done assuming hierarchy and octant to be known. In our study we quantify explicitly the exposures required by a realistic atmospheric neutrino experiment to achieve this.
We analyze in detail the individual and combined sensitivity of LBL and atmospheric neutrino experiments, both at the level of oscillation probabilities and with simulations of relevant experimental set-ups. For the long-baseline experiments we consider T2K, which is already running and NOA which is expected to start taking data in 2014. For atmospheric neutrinos we choose the magnetized iron calorimeter detector (ICAL) which is being constructed by the India-based Neutrino Observatory (INO) collaboration 333 There are other upcoming atmospheric neutrino experiments like Hyper-Kamiokande Abe et al. (2011b) and PINGU Akhmedov et al. (2013) which may provide similar results. For our study we adopt a staged approach where we look at the data which will be available to us from these experiments at different chronological points over the next 15 years. We explore whether the LBL experiments T2K and NOA can give any evidence of being different from 0 and by themselves or in combination with data from ICAL@INO. We also present results for the precision measurement of individually for the LBL experiments and in combination with ICAL@INO. In addition to the role of atmospheric neutrino data in resolving hierarchy- degeneracy, its impact on removing octant- degeneracy is also examined. We also study how the CP sensitivity of the LBL experiments varies with in its current range.
Many future experiments are being planned for addressing the problem of resolution of mass hierarchy and determination of the CP phase . This includes LBNE Akiri et al. (2011), LBNO Stahl et al. (2012), T2HK Ishida (2013), ESS Baussan et al. (2013) etc. The planning of these facilities are expected to benefit from a detailed assessment of the capabilities of the currently running or under construction experiments Ghosh et al. (2013b). In this context it also makes sense to survey if T2K and NOA do not see CP violation with their currently projected run times then whether they can achieve this with extended run times Prakash et al. (2012); Blennow et al. (2013a); Machado et al. (2013). In this paper we expound this possibility to explore the ultimate reach of these experiments to detect .
The paper is organized as follows. In Section II, we describe the dependence of neutrino oscillation probabilities and how it is correlated with other parameters. Section III gives the experimental details of the long-baseline experiments (NOA and T2K) and atmospheric neutrino experiment (ICAL) considered in our study. Section IV outlines the results for the measurement and CP violation discovery potential of NOA and T2K with different exposures corresponding to different points of time in the future. In Section V we discuss the dependence of the CP sensitivity of NOA and T2K on neutrino parameters and the synergies between different channels. Section VI analyzes the CP sensitivity of atmospheric neutrino experiments with a magnetized iron detector, focusing on the CP measurement potential for a combination of NOA and T2K with ICAL. We summarize the conclusions in Section VII.
II Effect of hierarchy and Octant on sensitivity
The sensitivity to and potential for CP violation discovery can be understood from the oscillation probabilities in matter Kimura et al. (2002); Ohlsson et al. (2013); Akhmedov et al. (2013). The predominant contribution to the sensitivity is from the oscillation probability (), which has a dependence on in its sub-leading term which is suppressed by the small solar mass-squared difference. In matter of constant density, can be expressed in terms of the small parameters and as Akhmedov et al. (2004); Cervera et al. (2000); Freund (2001)
| (1) | |||||
Here , , and . is the Fermi constant and is the electron number density. The behaviour of this expression depends on the neutrino mass hierarchy, i.e. the sign of the atmospheric mass-squared difference . For neutrinos, is positive for NH and negative for IH, while for antineutrinos it is the opposite. It can be seen that the dependence of the second sub-leading term comprises of both and , and has the potential for discovering CP violation.
From Eq.1, the following observations can be made:
-
1.
Since appears in the expression coupled with the atmospheric mass-squared difference in the term , it suffers from the hierarchy- degeneracy which potentially limits the CP sensitivity Barger et al. (2002). The ambiguity shows up only in specific half-planes of true depending on the true mass hierarchy Prakash et al. (2012). For neutrinos, the probability is higher for NH than for IH due to matter effects as seen from the first term in Eq. 1. Near the oscillation maximum (), this increase in can be compensated by the second term, if lies close to . Similarly, the lowering of in case of IH can be compensated if lies close to . To summarize, it is difficult to disentangle the effects of hierarchy and if the hierarchy is normal and lies in the upper half-plane (UHP,) or if the hierarchy is inverted and lies in the lower half-plane (LHP,). These unfavourable combinations of parameters make the NH and IH probabilities overlap, making hierarchy determination difficult. On the other hand, if the combination of hierarchy and in nature is either {NH, LHP} or {IH,UHP}, then there is a substantial separation between NH and IH and it is easier to distinguish between the two hierarchies Prakash et al. (2012).
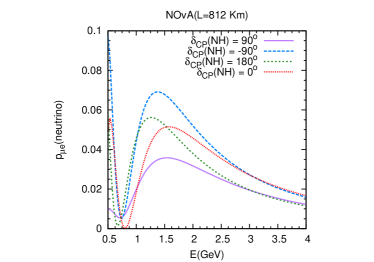
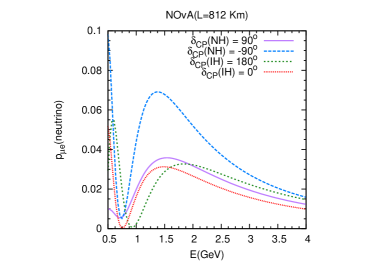
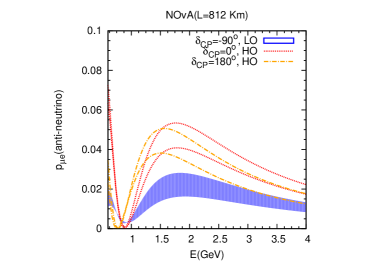
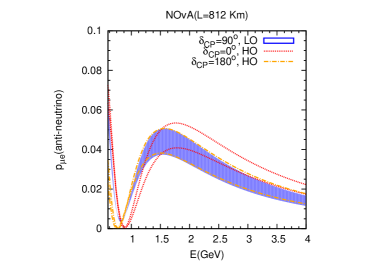
We illustrate this point with the help of Fig.1. In this figure, is plotted for the NOA baseline (812 Km) with the true values and and true NH (in both panels). The test curves in the left(right) panel are for and for NH(IH). Thus, the left(right) plots show the separation between CP-conserving test and maximally CP-violating true when the hierarchy is known(unknown). This is indicative of the CP violation discovery potential in each case. We see that the separations of the cases and from the CP conserving cases are comparable. But if the test hierarchy for the CP-conserving curves is inverted, the separation is considerably increased for and reduced for . This indicates that a true value of in the LHP would be effective for lifting the -hierarchy degeneracy for true NH-test IH while true lying in the UHP would worsen the degeneracy. For antineutrinos and test hierarchy NH, since the matter effect is less the probability will be somewhat lower than the corresponding ones for the neutrinos. In addition the curves for and will be interchanged but the separation for these two cases from the CP conserving values still remain comparable. When the test hierarchy is IH, the antineutrino probabilities are higher because of enhanced matter effects. This compounded with the flipping of the and probability curves for NH leads to LHP still being favorable for lifting the degeneracy. For true IH, the opposite is true, i.e. values in the UHP are favourable for resolving the degeneracy for both neutrinos and antineutrinos.
-
2.
Since the -sensitive term occurs with , it gives rise to the intrinsic octant degeneracy: Fogli and Lisi (1996). However recently a more generalized form of the octant degeneracy: has been elucidated in detail in Chatterjee et al. (2013); Barger et al. (2012), extending the conventional definition. This includes the possibility that the test value of occurring anywhere in the ’wrong’ octant may give the same probability. The recent tighter constraint on the value of helps to weaken the degeneracy with this parameter, but the ambiguity between the two octants for different values of still remains.
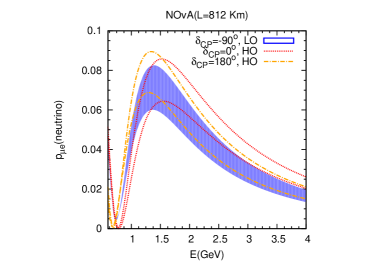
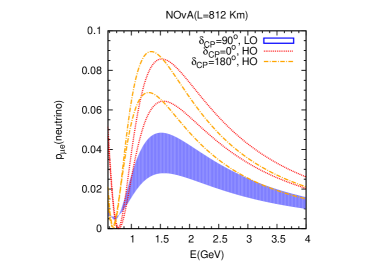
Whether this degeneracy is manifested in the results for CP sensitivity from an experiment depends on whether the experiment (or combination of experiments) is capable of determining the octant and resolving the octant- degeneracy to a good enough confidence level. The octant sensitivity arises from the dependence in the leading term, and is significantly dependent on the true values of oscillation parameters and Chatterjee et al. (2013). Since increases with and with in the LHP, while in the UHP pulls it down, a true value of lying in the higher octant (HO) would be more likely to suffer from the octant- degeneracy if the true value of is in the UHP. On the other hand, if true is in the lower octant (LO) then true lying in the LHP would raise and lead to an ambiguity with values corresponding to test in the HO. Hence the LHP is favourable for resolving the octant degeneracy in the case of true HO and the UHP is favourable for true LO. These features are reflected in Fig. 2 where we show the effect of octant degeneracy in distinguishing between the CP conserving and maximally CP violating cases for , for the NOA baseline. The upper panel is for neutrinos whereas the lower panel is for antineutrinos. The shaded region corresponds to true LO. The first panel shows that for true LO and true (LHP) the two cases cannot be distinguished whereas in the second panel, for (UHP) a clear separation is seen. For antineutrinos the behaviour for LHP and UHP is opposite. This indicates that a combination of neutrinos and antineutrinos would be conducive for removal of octant- degeneracy Agarwalla et al. (2013b); Machado et al. (2013). For true HO the behaviour is opposite.
III Experimental details
For the long-baseline experiments NOA and T2K, simulation is done using the GLoBES package Huber et al. (2005, 2007); Messier (1999); Paschos and Yu (2002). T2K (L 295 Km) is assumed to have a kt Water Ĉerenkov detector and a MW beam running effectively for or years by 2016. The initial plan of T2K was to run with with 1021 protons on target (pot)/year for five years Itow et al. (2001). However because of natural calamity T2K has not been able to achieve its full capacity yet. We take into account its present lower power run as well as the planned upgrades to give a total of 5 effective T2K years till 2016 (i.e. a total of pot). We also consider the option of T2K running for years by 2021, to ascertain whether such an extension would be advantageous. For NOA (L 812 Km), we consider a kt TASD detector with a MW beam with 7.3 1020 pot/year running for years by 2020 and years by 2024. In this work we use a re-optimized NOA experimental set-up with refined event selection criteria Patterson (2012); Agarwalla et al. (2012). Detailed specifications of these experiments are given in Itow et al. (2001); Ishitsuka et al. (2005); Huber et al. (2002); Fechner (2006); Kato (2008); Ayres et al. (2004); Agarwalla et al. (2012).
For atmospheric neutrinos, we analyze a magnetized iron calorimeter detector (ICAL) of the prototype planned by the India-based Neutrino Observatory (INO), which will detect muon events with the capability of charge identification Ghosh et al. (2013c). We use constant neutrino energy and angular detector resolutions of 10 and 10∘ respectively, unless otherwise specified. Note that the neutrino resolutions using INO simulation codes are currently being generated. However we have checked that the resolutions used above gives similar results as obtained by the INO simulation code using muons Ghosh et al. (2013c). We consider a 1 GeV neutrino energy threshold, 85% efficiency and 100% charge identification efficiency. We look at two detector exposures of 250 kT yr, corresponding to 5 years of running for a 50 kT detector, and 500 kT yr or 10 years of running with such a detector. The detector is currently under construction, with a projected time frame of 5 years to completion, so this data is expected to be available by about 2023 and 2028 respectively. Earth matter effects are included in the atmospheric neutrino analysis using a standard Preliminary Reference Earth Model (PREM) density profile of the earth Dziewonski and Anderson (1981).
Henceforth, we give the exposure of NOA or T2K as where and respectively denote the number of years of neutrino and antineutrino running of the experiment.
For our study of T2K, NOA and ICAL, we look at the following chronological points:
-
•
2016, when T2K will have completed either a (5+0) or a (3+2) run
-
•
2020, when NOA will have completed a (3+3) run
-
•
2024, when NOA will have completed a (5+5) run and ICAL will have at least 5 years of data
-
•
2028, when ICAL will have 10 years of data
We also consider the case of T2K going on to a (5+5) run, which can be taken into account in the 2024 analysis along with NOA (5+5) and ICAL 5.
IV CP sensitivity of T2K and NOA : chronological progression
In this section, we study the prospects for CP violation discovery and precision measurement of NOA and T2K for different exposures corresponding to progressive points of time in the next 10 years. The experimental capabilities are demonstrated using CP violation discovery plots and precision plots respectively.
The discovery potential of an experiment for CP violation is computed by considering a variation of the over the full range in the simulated true or ‘experimental’ event spectrum , and comparing this with or in the test or ‘theoretical’ event spectrum . The discovery in its simplest statistical form is defined as 444In this work we have used the standard definition of and used the usual convention . Note that since we have not included fluctuations in the simulated data in our case . For alternate statistical analysis using frequentist or Bayesian approach see Blennow et al. (2013b); Qian et al. (2012); Ciuffoli et al. (2013); Schwetz (2007); Blennow (2013).
| (2) |
In our calculation we include a marginalization over systematic errors and uncertainties for each experiment. 555We have not used correlated systematics for various experiments in this study. However, such an analysis would impose additional constraints on the systematic parameters and serve to improve the results presented here. The resultant from the various experiments are then added and finally marginalized (unless specified otherwise) over the parameters , , and hierarchy in the test spectrum. As expected, the discovery potential of the experiments is zero for true and , while it is close to maximum at the maximally CP violating values . We use the following transformations relating the effective measured values of the atmospheric parameters and to their natural values and de Gouvea et al. (2005); Nunokawa et al. (2005); Raut (2013):
| (3) |
| (4) |
The effective values and correspond to parameters measured by muon disappearance experiments. It is advocated to use these values in the definitions of priors if the prior is taken from muon disappearance measurements. The corrected definition of is significant due to the large measured value of , while for the above transformation is valid even for small values. In our analysis we do not use any external priors for these parameters as the experiments themselves are sensitive to these parameters. However it is to be noted that for the effective parameters, there is an exact mass hierarchy degeneracy between and and an exact intrinsic octant degeneracy between and . Therefore use of these values in the analysis ensures that one hits the exact minima for the wrong hierarchy and wrong octant in the numerical analysis for the muon disappearance channel. Measurements with the appearance channel and the presence of matter effects can break these degeneracies. Also, the generalized octant degeneracy occurring between values of in opposite octants for different values of and is still present for the effective atmospheric mixing angle. For such cases, a fine marginalization grid has to be used in the analysis in order to capture the minima occurring in the wrong hierarchy and wrong octant.
The following true values and test ranges of parameters are used in our computation:
| (5) | |||||
with specific values of and .
and are fixed to their true values since their effect is negligible. External (projected) information on from the reactor experiments is added in the form of a prior on :
| (7) |
with the 1 error range .
The CP sensitivity of an experiment can also be quantified by the precision measurement of possible by the experiment. In this case we look at a variation of the over the full range in both the simulated true event spectrum and the test event spectrum . Thus the precision is given by
| (8) |
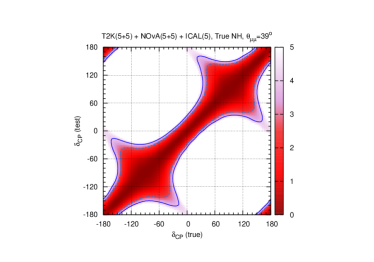
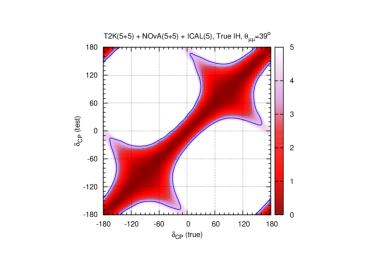
We present precision plots which show the test range allowed by the data for each true value of , up to a specified confidence level. The allowed values of are represented by the shaded regions in the figures. For an ideal measurement, the allowed values would be very close to the true value. Thus the allowed region would be along the diagonal. However, due to finite precision of the parameters as well as the parameter degeneracies, other values are also seen to be allowed.
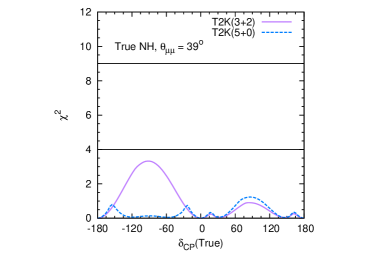
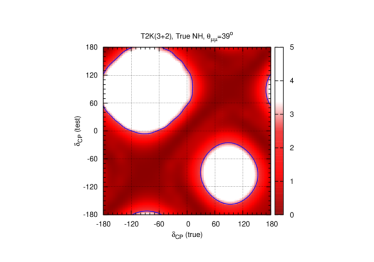
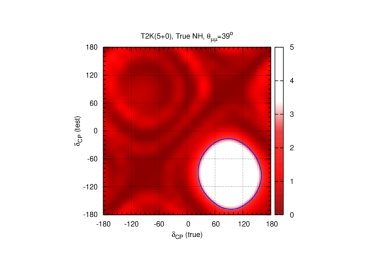
IV.1 CP sensitivity of T2K (3+2) and (5+0) (2016)
T2K is expected to have a neutrino run of 5 years. There are also discussions for a break-up of neutrino and antineutrino runs, for which we consider the case of (3+2) years Machado et al. (2013). In the left panels of Fig. 3, we depict the CP violation discovery for both these options (upper row) and 90 C.L. precision for T2K (3+2) (middle row) and T2K (5+0) (bottom row) for , (true values) and true NH. The figure shows that the CP sensitivity of T2K alone is quite low, especially for the (5+0) case, where the discovery potential remains below over the entire true range. This is because the baseline of T2K (295 Km) is relatively short and earth matter effects are minimal, leading to the hierarchy- degeneracy predominating in both half-planes when only a neutrino beam is taken. When we consider a neutrino-antineutrino combination, the different behaviours of the neutrino and antineutrino probabilities partially resolves the degeneracy in the favourable half-plane (in this case the LHP) for a (3+2) run. Therefore, as pointed out in Machado et al. (2013), a T2K (3+2) run provides better CP sensitivity than a T2K (5+0) run. This is also evident in the precision plots, where the allowed region of (shaded area) is more for the (5+0) case, indicating that less regions of are excluded at 90 C.L.
IV.2 CP sensitivity of T2K (3+2) and (5+0) with NOA (3+3) (2020)
The experiments T2K and NOA are synergistic since the different baselines (295 Km for T2K and 812 Km for NOA ) experience different degrees of earth matter effects and hence show somewhat different dependences on the neutrino parameters. In particular, the degeneracies observed in Fig. 3 can be resolved in some areas by combining T2K with NOA . We explore how addition of NOA affects the difference in CP sensitivity between T2K (3+2) and (5+0) runs.
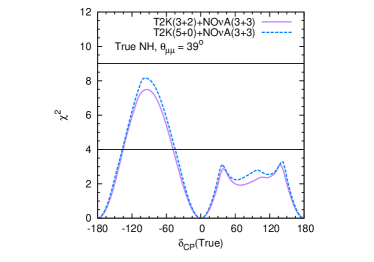
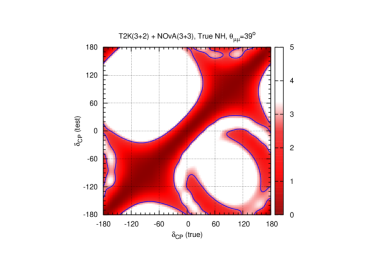
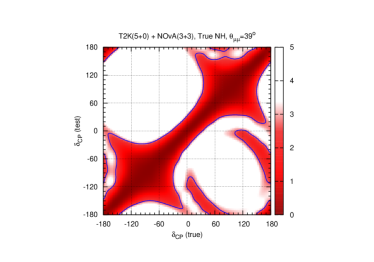
The right panels of Fig. 3 shows the CP violation discovery (upper row) and 90 C.L. precision (middle and lower rows) for T2K + NOA for true NH and the same values of parameters as the left panels. The upper row depicts the discovery potential for the combination of both T2K exposures with NOA (3+3). The middle and lower rows show the precision for T2K (3+2) + NOA (3+3) and T2K (5+0) + NOA (3+3) respectively. A comparison of the left and right panels tells us that for both discovery and precision, the advantage offered by T2K (3+2) over (5+0) is lost when we combine T2K with NOA . While for T2K alone the discovery can rise above 2 in the LHP for (3+2) but remains well below 2 for (5+0), the discovery of NOA + T2K is nearly identical for T2K (3+2) and (5+0), and rises to values above (2.5) in the LHP. The allowed regions also look similar in the two cases.
This behaviour can be explained as follows. Since NOA already includes a combined neutrino-antineutrino run, it is capable of resolving the hierarchy- degeneracy and providing significant CP sensitivity in the favourable half-plane. Therefore the hierarchy degeneracy resolution provided by T2K (3+2) in the favourable half-plane is no longer required when T2K is combined with NOA . Thus in the combined analysis, the T2K CP sensitivity adds to the NOA sensitivity irrespective of whether T2K has a (5+0) or (3+2) run. For the subsequent chronological analysis, we choose the T2K run to comprise of (5+0) years.
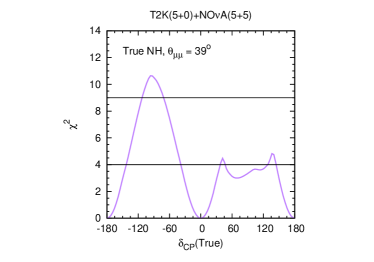
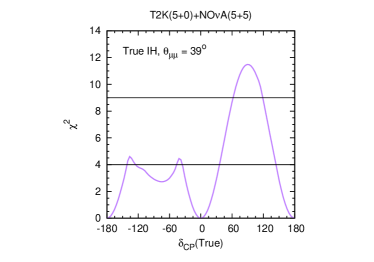
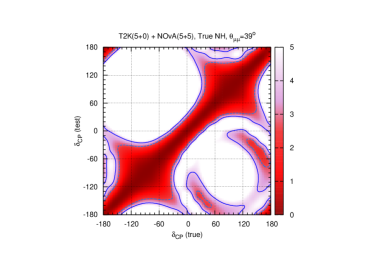
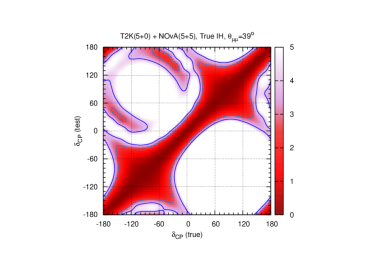
IV.3 CP sensitivity of T2K (5+0) with NOA (5+5) (2024)
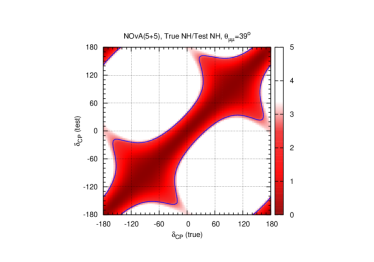
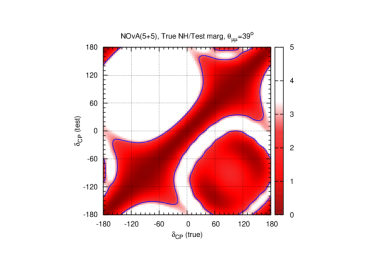
Although the current projection of NOA is to run for (3+3) years we also consider the possibility of a (5+5) run of NOA . This is to investigate the possibility of an enhanced sensitivity to using upgradation of current facilities. In Fig.4, we plot the CP violation discovery (upper row) and 90/95 C.L. precision (lower row) for true NH (left panel) or true IH (right panel). Comparing with Fig.3, it can be observed that the increased NOA exposure adds to the discovery potential, giving values as high as (3) for maximal CP violation in the favourable half-plane in each case and reaching close to (2) at some points in the unfavourable half-plane even though the discovery minima still lie in the wrong-hierarchy region there. In the precision figures, the allowed regions shrink to an area along the major diagonal (true = test ) corresponding to the right-hierarchy solutions and some off-axis islands corresponding to the wrong-hierarchy solutions arising from the hierarchy- degeneracy. These are, as expected, in the UHP for true NH and in the LHP for true IH.
IV.4 CP sensitivity of T2K (5+5) with NOA (5+5) (2024, alternative T2K run)
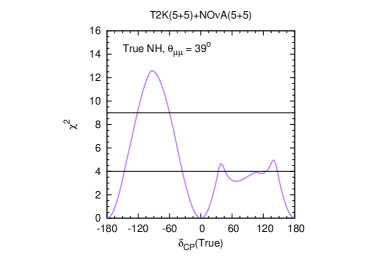
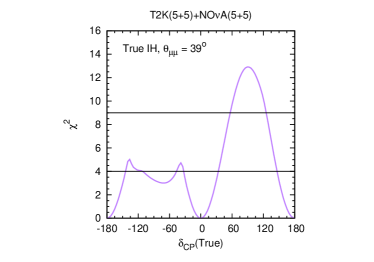
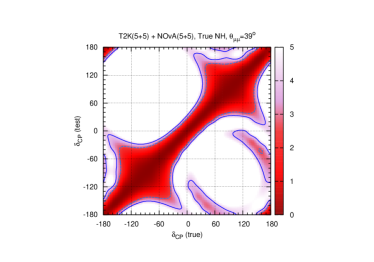
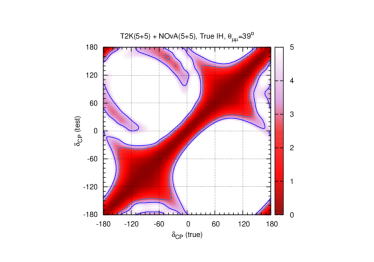
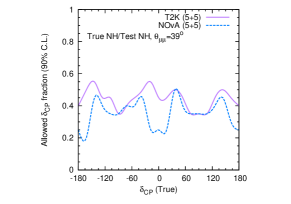
In this section we consider the possibility of a (5+5) run for T2K in conjunction with NOA (5+5) run. This is a possible extension beyond the projected timescale of the experiments. Fig.5 illustrates the CP violation discovery potential, 90 C.L. precision and 95 C.L. precision for NOA (5+5) + T2K (5+5) for , and true NH (left panel) or true IH (right panel). It may be observed that in this case the discovery potential rises to well above 3 for maximal CP violation in the favourable half-plane, and stays above 3 between for true NH and for true IH. In the unfavourable half-plane a 2 discovery signal is achieved over part of the true range, but the discovery minima still occur with the wrong hierarchy. Similarly, while the off-axis islands in the precision plot corresponding to the wrong-hierarchy solutions vanish at the level of 90 C.L., they are still not ruled out at 95 C.L. This shows the need for some additional input in order to resolve the hierarchy- degeneracy in the unfavourable half-plane.
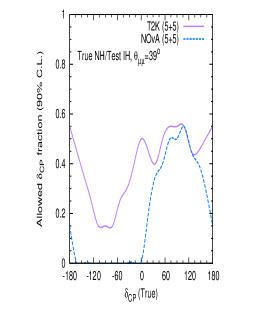
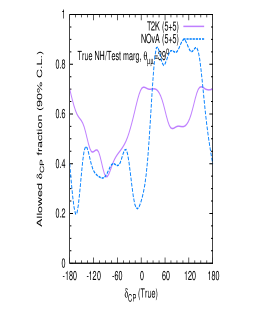
It is worthwhile to analyze the relative contributions of NOA and T2K in this case, where they have equal exposures with both neutrinos and antineutrinos. While T2K has better statistics, NOA enjoys greater hierarchy sensitivity due to a longer baseline and stronger earth matter effects. To study this, we plot in Fig.6 the allowed fraction of values at 90 C.L. for T2K (5+5) and NOA (5+5) as a function of true . This quantity indicates the fraction of test values which lie in the allowed region for each specific value of true . Hence smaller values of the allowed CP fraction signify better CP sensitivity.
The figure is plotted for true NH. The three panels correspond to test NH, test IH and a marginalization over hierarchy. It is observed that for a fixed NH, NOA does slightly better than T2K. For test IH, NOA and T2K perform similarly in the unfavourable half-plane (UHP), but NOA is much better than T2K in the favourable half-plane (LHP) due to its superior hierarchy sensitivity. However, with a marginalization over the unknown hierarchy, NOA does much worse than T2K in the unfavourable half-plane.
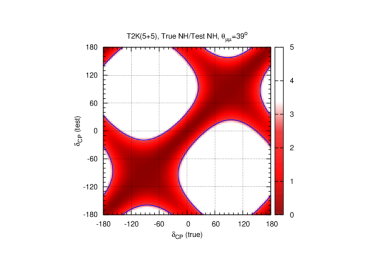
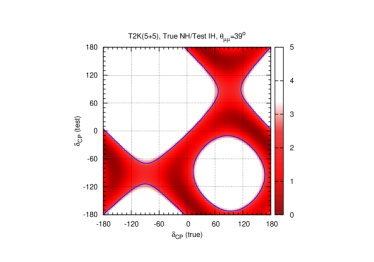
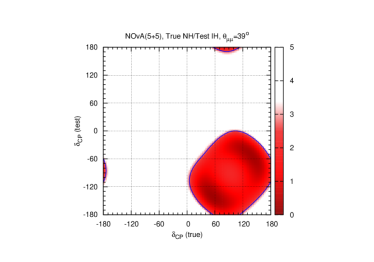
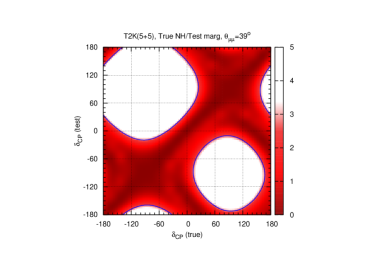
This anomalous feature can be explained from the 90 C.L. precision plots for T2K (5+5) and NOA (5+5) (true NH) in Fig.7. The three panels in each column correspond to test NH, test IH and marginalization over hierarchy. For fixed true and test NH (top row), T2K has a slightly larger allowed region than NOA . For test IH (middle row), NOA does much better than T2K in terms of the allowed range covered. However, the allowed region of NOA for test IH lies within the UHP of true and LHP of test , which is an excluded region for test NH. Because of these disparate allowed regions, with a marginalization over hierarchy (bottom row), NOA gives an allowed region along the axis as well as in the true UHP - test LHP region, increasing its allowed CP fraction. On the other hand, for T2K, there are significant overlaps between the allowed regions for test NH and test IH, and the true UHP - test LHP range remains excluded in both cases. So a marginalization over hierarchy does not cause as much of an increase in the allowed CP fraction for T2K as it does for NOA .
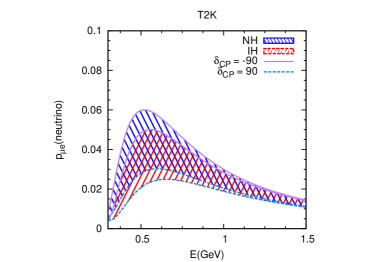
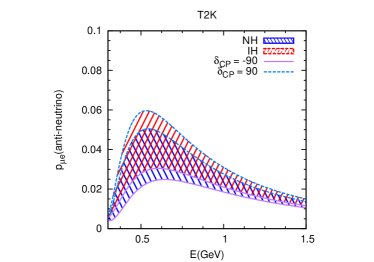
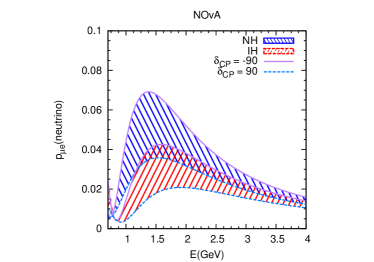
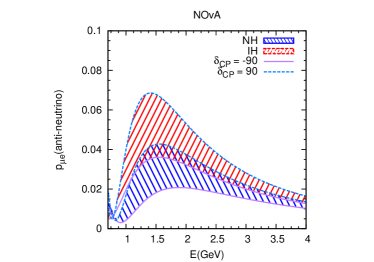
The reason for this difference in the behaviour of NOA and T2K can be seen at the level of probabilities. Fig.8 depicts the energy spectrum for the T2K and NOA baselines for neutrinos and antineutrinos, showing the bands for NH and IH when is varied over the full range. The curves for and are highlighted. It is easy to see that due to the greater separation between the NH and IH bands for NOA , the true NH - test IH case shows a clear degeneracy between the two bands near true and test , leading to the true UHP - test LHP allowed region in the NOA test IH precision figure. T2K has a much greater overlap between the NH and IH bands, but in this case, the overlap is more prominent in the regions of true UHP - test UHP and true LHP - test LHP, corresponding to the allowed areas in these ranges in the T2K test IH precision figure. Hence in spite of the smaller allowed regions for NOA compared to T2K especially for true NH/test IH, the location of the allowed regions leads to an anti-synergistic combination for NOA (5+5), giving an overall poorer CP sensitivity than T2K (5+5).
V CP violation discovery potential of T2K/NOA : synergies and dependence on parameters
In this section, we study the behaviour of the CP violation discovery potential as a function of the neutrino parameters , the neutrino mass hierarchy and the octant of . We also examine the synergy between the individual channels. The discussion of synergies and parameter dependence here is for the case T2K (5+0) + NOA (5+5), i.e. with a time frame till 2024.
V.1 Synergy between appearance and disappearance channels of T2K/NOA :
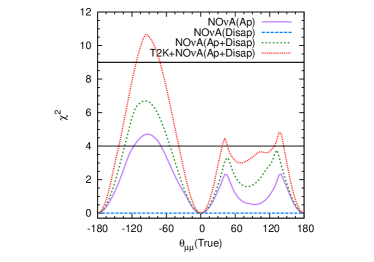
The event rates in T2K and NOA get contributions from both and channels. Due to the different behaviours of the two channels as a function of and other oscillation parameters, there is a synergy between them which leads to an enhancement of the CP violation discovery potential of the combination. In Figure 9, the CP violation discovery is plotted as a function of true for the appearance and disappearance channels of NOA and T2K for , and true NH. The following features can be observed:
-
1.
The CP violation discovery potential principally arises from the appearance channel of NOA /T2K, which is a function of , owing to its dependence on the quantity in the sub-leading term of Eq.1 as discussed in Section II. The disappearance channel offers a weaker sensitivity through a sub-leading dependence on Akhmedov et al. (2004). The blue curve shows that by itself, the disappearance channel () has negligible discovery potential.
-
2.
Due to the different behaviours of the two channels as a function of and other oscillation parameters, there is a synergy between them which leads to an enhancement of the CP violation discovery potential of the combination. is a function of both and while depends only on . From the green curve, it can be seen that the discovery potential of the combination is significantly greater than the sum of the discovery of the individual channels.
-
3.
Both NOA and T2K experience this synergy between the appearance and disappearance channels. In addition, there is a further enhancement of the discovery potential when the two experiments are combined, as discussed in the previous section.
V.2 Dependence on :
The behaviour of CP sensitivity as a function of can be understood by looking at the -dependence of the oscillation probability . As seen in Eqn. 1, has a leading order term that is independent of , and a sub-leading term that is a function of In calculating CP sensitivity , the leading order -independent term cancels out from the true and test spectra in the numerator, but remains in the denominator. For illustrative purposes, the can be expressed as
| (9) |
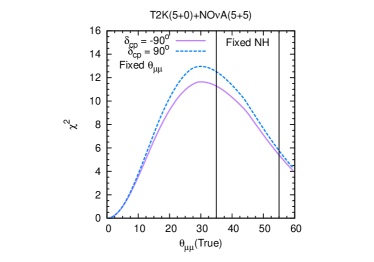
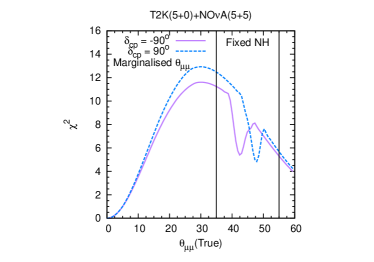
where , , are functions of the other oscillation parameters apart from and . It is easy to show that for small values of , which is an increasing function. It is also straightforward to consider the other limit, where is close to . In this limit, which decreases with . This feature can be understood qualitatively by noting that the leading order term is independent of and therefore acts as a background to the CP signal Huber et al. (2009). Therefore, CP sensitivity initially increases with , peaks at an optimal value, and then decreases with . These features are reflected in Fig.10 where we plot the CP violation discovery potential of NOA +T2K as a function of for two maximally CP-violating values of true . We assume and a fixed normal mass hierarchy. A marginalization over is done in the left panel and is fixed to its true values in the right panel. It can be seen that the discovery rises for very small values of and reaches its highest value in the range before starting to drop off gradually. The vertical lines denote the current range (). This figure shows that the range of that nature has provided us with is a fortuitous one, since it happens to lie in a region where the sensitivity to CP violation is maximum with such experiments.
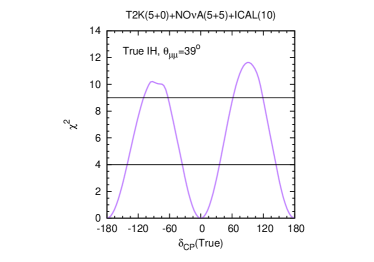
Fig.11 depicts the CP violation discovery as a function of true for NOA +T2K (true NH, and hierarchy marginalized, ) for two values of at the lower and higher end of its present range and two values prior. It can be seen that in the favourable half-plane of , there is a slight increase in the with an increase in in this range, as can be predicted from Fig.10. In the unfavourable half-plane, there is again a complicated dependence of the discovery on the intrinsic CP violation discovery of the experiments as well as their hierarchy sensitivity, and since the latter increases significantly with , we observe a more definite improvement of the overall discovery potential with increasing .
V.3 Dependence on the neutrino mass hierarchy:
This aspect has been discussed in detail in Ghosh et al. (2013a). Fig.12 shows the CP violation discovery as a function of true for NOA +T2K for three values of , and true NH (left panel) or IH (right panel). As expected, there is a drop in the discovery in the unfavourable half-plane in each case, i.e. in the UHP for true NH and in the LHP for true IH. In these regions, the discovery minima occur with the wrong hierarchy due to the hierarchy- degeneracy, and the discovery is a sum of the intrinsic discovery potential and the hierarchy sensitivity of NOA +T2K Ghosh et al. (2013a).
V.4 Dependence on and octant:
In Fig.12, we can also observe the dependence of the CP violation discovery on the true value of . When true lies in the favourable half-plane, the discovery potential decreases with increasing in the current allowed range of . In the unfavourable half-plane, the behaviour is more complicated since the discovery minima lie in the wrong-hierarchy region for part of the range, and the hierarchy sensitivity adds to the discovery . The hierarchy sensitivity is directly proportional to , and therefore the overall CP violation discovery potential in these regions also increases with .
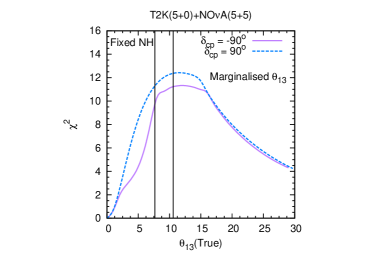
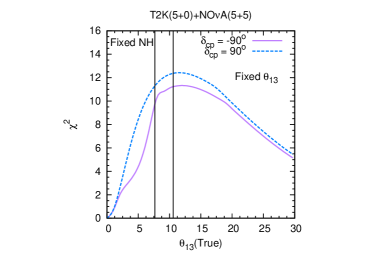
As seen in Eqn. 1, has a leading order independent term and a sub-leading dependent term . This is similar to the behaviour. Thus for smaller values of the is expected to rise, reaching a peak at an intermediate value of and decreasing thereafter. This is reflected in the left panel of fig.13 where the CP violation discovery potential of NOA +T2K is shown as a function of true . This plot is drawn for two maximally CP-violating values of true , and a fixed NH with test fixed to its true value. The vertical lines give the present 3 range of (). Therefore, as we increase in its allowed range, we see a drop of sensitivity.
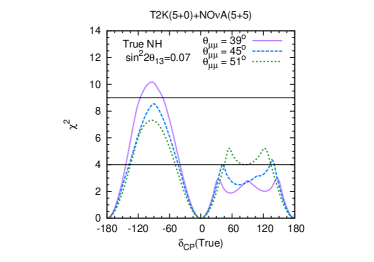
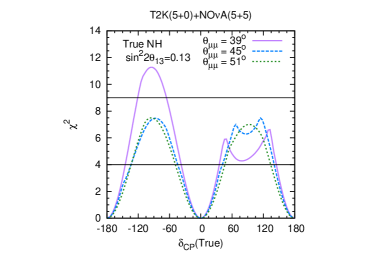
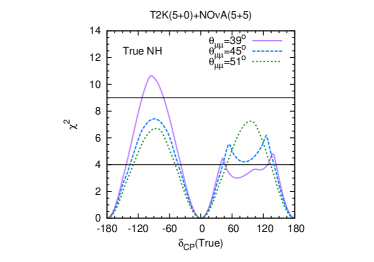
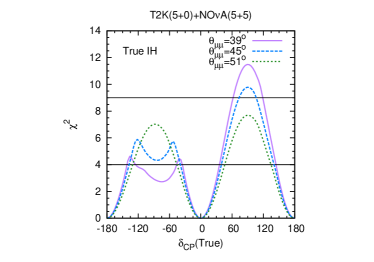
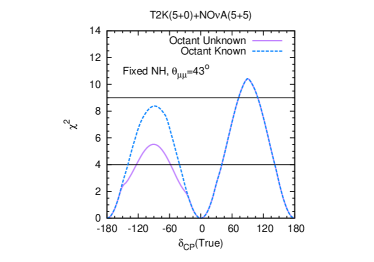
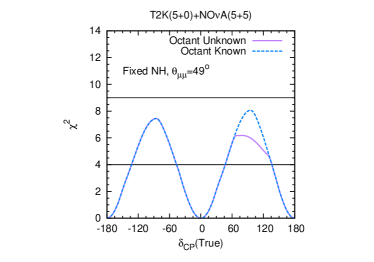
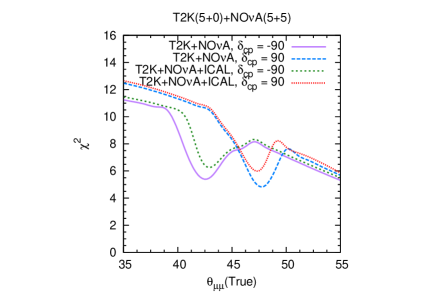
The right panel of Fig. 13 is obtained by marginalizing over the octant i.e assuming no prior knowledge of the octant in which lies. We find that for or , there is no effect of a marginalization over the octant. This is because the octant sensitivity of NOA + T2K is good enough (at least 2) in this range of to rule out CP discovery solutions in the wrong octant Chatterjee et al. (2013). The octant adds to the CP discovery in the wrong octant and excludes any minima occurring in that region. For , the octant sensitivity of NOA +T2K is not high enough to exclude wrong-octant solutions, and we see a wiggle in the discovery curves signaling the octant- degeneracy. The behaviour is different for , since the LHP is favourable for resolving the octant- degeneracy for true HO and the UHP is favourable for true LO (in the neutrino mode, which gives the predominant contribution in these results). This is illustrated in Fig.14, where the discovery potential of NOA +T2K is plotted as a function of true for (left panel) and (right panel) with and without a marginalization over the octant. and a fixed NH is assumed. These values of lie within the range of unresolved octant- degeneracy, which shows up as a drop in the curve in the LHP for and in the UHP for when the octant is assumed to be unknown, as expected from the above argument. The favourable half-plane in each case suffers from no degeneracy. We also see that the drop due to the octant degeneracy is greater in the case of than for since the former value lies in the central part of the degenerate region, while the latter is at the edge.
VI CP violation discovery and precision with combined NOA , T2K and atmospheric neutrinos
In general, the CP sensitivity of atmospheric neutrino experiments are limited by the finite detector resolutions. In particular, the angular resolutions need to be very good to have any intrinsic CP sensitivity from these experiments Ghosh et al. (2013a); Samanta (2009); Ge et al. (2013). It has been highlighted in Ghosh et al. (2013a), that in spite of this limitation the atmospheric neutrino experiments can play a crucial role in discovering CP violation in combination with the current generation LBL experiments T2K and NOA . The main reason for this is the ability of the atmospheric neutrino experiments to lift the hierarchy- degeneracy by excluding discovery minima occurring with the wrong hierarchy in the unfavourable half-plane of . This is achieved due to the significant and largely -independent hierarchy sensitivity of atmospheric neutrino experiments. This was demonstrated in in Ghosh et al. (2013a) taking ICAL@INO as the atmospheric neutrino detector. In this work we do a combined study for T2K + NOA + ICAL with different exposures and for both the CP violation discovery potential and the precision.
VI.1 CP sensitivity of ICAL
In this sub-section we explore some details of the CP sensitivity of atmospheric neutrino experiments. The main issue here is that the atmospheric neutrinos come from all directions. Hence these experiments face a further challenge of accurately reconstructing the direction apart from the energy. We investigate how the intrinsic CP sensitivity of atmospheric neutrinos depend on the energy and angular resolutions and how much sensitivity can be achieved for an ideal detector.
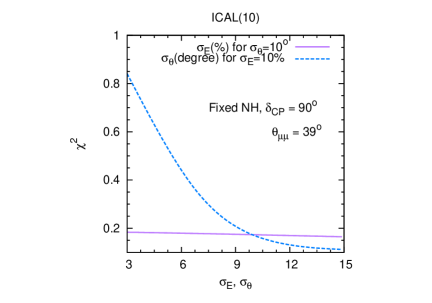
In Fig.15 the CP violation discovery potential of ICAL is plotted as a function of the energy and angular resolution. The curve for angular(energy) resolution is plotted by varying the respective smearing widths between () while holding the energy(angular) resolution fixed at . The figure illustrates the significant role played by the angular resolution of an atmospheric neutrino detector in its CP sensitivity. With present realistic values of detector smearing (15,15∘), the CP sensitivity of such an experiment is washed out by averaging over bins in energy and direction, due to the coupling between and in the term in Ghosh et al. (2013a). With a hypothetical improved angular resolution of , the CP violation discovery may reach values close to 1, going up to 5 for ideal detector resolutions in both angle and energy.
VI.2 CP sensitivity of T2K (5+0) with NOA (3+3) or (5+5) and ICAL 5 years (2024) or 10 years (2028)
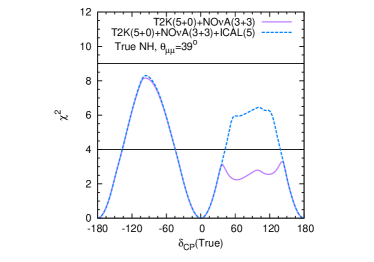
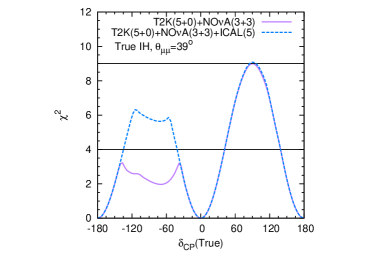
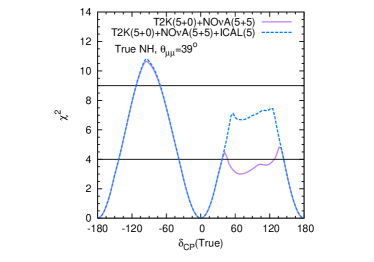
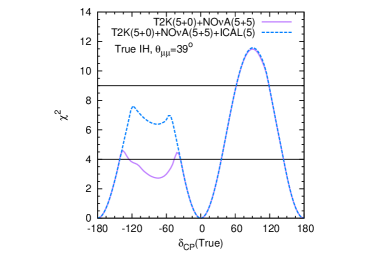
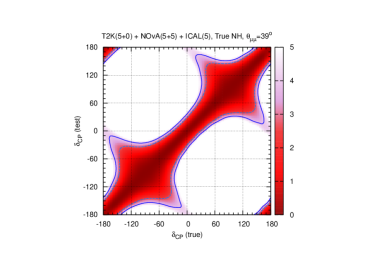
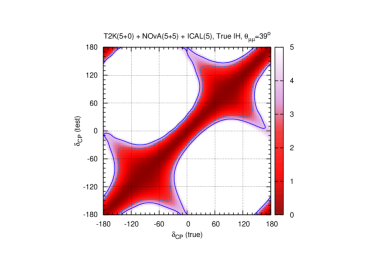
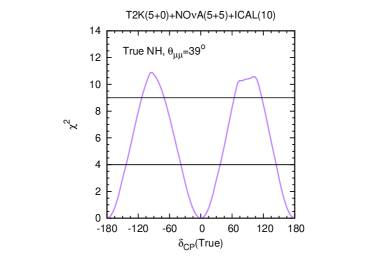
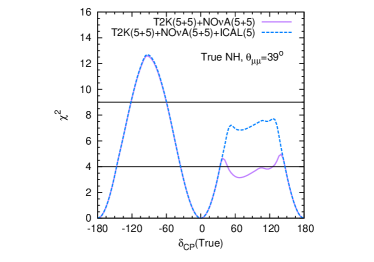
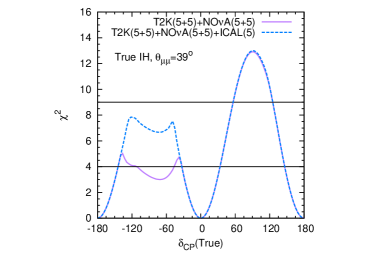
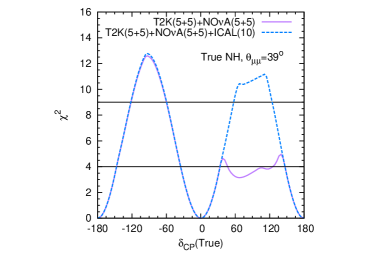
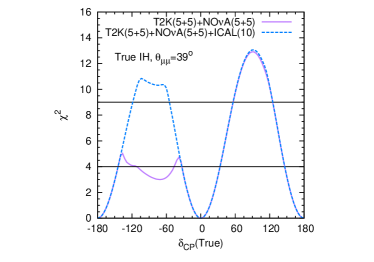
Fig.16 shows the CP violation discovery and 90/95 C.L. precision for NOA (5+5) + T2K (5+0) + ICAL (5 years). The discovery is also given for NOA (3+3). for , , true NH (left panel) and true IH (right panel). Fig.17 plots the CP violation discovery for NOA (5+5) + T2K (5+0) with ICAL (10 years). The discovery plots show that with the addition of 5 years of ICAL data, while the discovery in the favourable half-planes is unchanged compared to Fig.4 as expected, there is a rise of about 3-4 in the values over a significant range in the unfavourable half-planes. The figure tells us that the unfavourable half-plane still exhibits a hierarchy- degeneracy and has discovery minima with the wrong hierarchy, but the combination of the hierarchy sensitivity of ICAL (5 years) raises the discovery potential to about 2.5 over the central part of the unfavourable half-plane for the NOA (5+5) case, i.e. in the range (true IH) or (true NH). With NOA (3+3), the discovery potential reaches up to 2.5 for maximal CP violation in both half-planes when ICAL 5 years data is added. From Fig.17, it can be seen that 10 years of ICAL data provides a complete resolution of the hierarchy- degeneracy and the discovery potential goes up to 3 for maximal CP violation in both favourable and unfavourable half-planes.
Regarding the precision, it may be recalled from Fig.4 (lower row) that with NOA (5+5) + T2K (5+0) alone, the 90/95 C.L. allowed regions include some islands in the off-axis region, i.e. with in the UHP and in the LHP for true NH and vice versa for true IH. These correspond to the CP minima occurring with the wrong hierarchy due to the hierarchy- degeneracy. From the precision plots in Fig.16, it can be observed that these wrong-hierarchy solutions go away at both 90 and 95 C.L. when atmospheric neutrino information from ICAL (5 years) is combined, since this degeneracy is resolved by the addition of hierarchy sensitivity from ICAL. Thus the combination of atmospheric neutrino experiments with NOA /T2K can aid the potential for measurement of the long-baseline experiments by curtailing the allowed range, and for this purpose ICAL data of 5 years is enough to exclude the wrong-hierarchy solutions up to 95 C.L. or about 2.
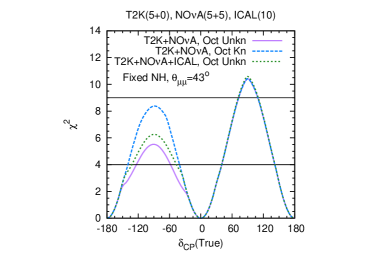
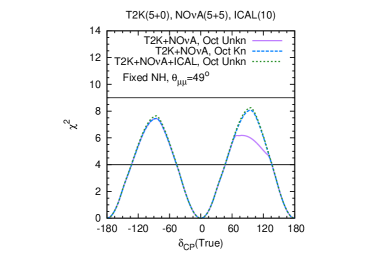
We also study what happens to the octant- degeneracy when ICAL is combined with NOA and T2K. Fig.18 shows the CP violation discovery potential of NOA (5+5) + T2K (5+0) with and without ICAL (10 years) as a function of true for true for and a fixed NH, with a marginalization over . Comparing with Fig.13, we see that the wiggle in the range corresponding to the octant- degeneracy is reduced in amplitude and restricted to the range when ICAL data is added. In Fig.19, the discovery potential of NOA + T2K with and without ICAL (10 years) is plotted as a function of true for (left panel) and (right panel) with and without a marginalization over the octant, for and a fixed NH. These values of lie within the range of unresolved octant- degeneracy, even with the combination of ICAL, but an improvement in the discovery is seen in the unfavourable half-plane in each case when ICAL is added. Since the drop due to the octant degeneracy is greater for than for , the addition of ICAL data entirely overcomes the degeneracy and compensates for the drop in the case, while for there is only a partial improvement in the even when ICAL data is added.
The effect of ICAL information on the octant- degeneracy is more modest than that for the hierarchy- degeneracy since the octant sensitivity of ICAL is not as good as its hierarchy sensitivity Chatterjee et al. (2013). It is still helpful to an extent since, like the hierarchy sensitivity, the octant sensitivity is nearly independent of .
VI.3 CP sensitivity of T2K (5+5) with NOA (5+5) and ICAL 5 years (2024) or 10 years (2028)
Finally, we examine the benefits of adding ICAL to the projected combination of T2K (5+5) + NOA (5+5). Fig.5 showed that while this combination provides good discovery potential () over the central part of the favourable half-plane, the unfavourable half-plane still suffers from the hierarchy- degeneracy and barely reaches a discovery potential of 2 over its central region. Further, the wrong-hierarchy solutions in the precision figure get ruled out at 90 C.L. but not at 95 C.L.
In Fig.20 we plot the CP violation discovery and 95 C.L. precision for NOA (5+5) +T2K (5+5) + ICAL (5 years). Fig.21 depicts the discovery potential for ICAL (10 years). The figures illustrate that with the addition of 5 years of ICAL data, the discovery potential in the unfavourable half-plane is improved to about 2.7 over the range (true IH) or (true NH), even though the hierarchy- degeneracy is still present. The favourable half-plane, as expected, is unaffected by the addition of ICAL. Also, the small off-axis allowed regions at 95 C.L. in the precision plot for T2K (5+5) + NOA (5+5) get excluded when ICAL (5 years) is added. Hence the combination of ICAL constrains with a higher level of sensitivity. With 10 years of ICAL data, the hierarchy- degeneracy is fully resolved and the discovery potential of the NOA +T2K+ICAL combination achieves values above 3 over the ranges as well as , i.e. in both the favourable and unfavourable half-planes for both hierarchies. Thus the addition of ICAL can provide a more consistent signature of CP violation and a more constrained measurement of .
VII Conclusions
Measuring CP violation in the lepton sector is one of the most challenging problems today. We have performed a systematic chronological study of the CP sensitivity of the current and upcoming long-baseline experiments T2K and NOA and the atmospheric neutrino experiment with a prototype of ICAL@INO. We analyze the synergies between these set-ups which may aid in CP violation discovery and a precision measurement of . This has been done for different combinations of these experiments which will be achievable at progressive points in time in the near future. The main role of the atmospheric data is to rule out the wrong hierarchy solutions which increases the CP sensitivity in the unfavourable parameter regions for T2K/NOA . Usually the analysis of CP sensitivity is done assuming the hierarchy/octant to be known –in which case the wrong hierarchy/wrong octant solutions are excluded a priori. We show how a realistic atmospheric neutrino experiment can achieve this and quantify the exposure which enables one to disfavour the wrong hierarchy and/or wrong octant solutions. Below we list the salient features of our results.
Study of synergies and parameter dependence:
-
•
While the CP sensitivity principally arises from the appearance channel of NOA /T2K, the appearance and disappearance channels are synergistic due to their different dependences on . depends on through the quantity , while only has a dependence. Thus their combination gives a CP sensitivity significantly higher than the sum of sensitivities of the two channels.
-
•
The results for a combination of T2K and NOA display hierarchy- degeneracy. This is manifested as a drop in the CP violation discovery potential in the unfavourable half-plane of , i.e. the UHP ()for true NH and the LHP () for true IH.
-
•
There is also a degeneracy of with the octant. However because of significant octant sensitivity of the T2K + NOA combination, this occurs over a restricted range of around the maximal value. For example, for a T2K (5+0) + NOA (5+5) combination, the degeneracy with the octant occurs over the range The degeneracy shows up as a drop in the discovery potential in LHP for true LO () and in the UHP for true HO ().
-
•
Although a non-zero is essential for any measurement of , large values of this parameter can also impede the CP sensitivity Hiraide et al. (2006). This is because of the presence of the independent leading term in , which can act as a background for the sub-dominant dependent term. However we note that for smaller values of the CP-discovery and hence increases with . On the other hand, for larger values of the CP-discovery which decreases with . The discovery attains its highest value in the range . This tells us that the range of provided by nature lies in an optimal region which is favourable for CP sensitivity with such experiments.
Chronological study:
In Table 1 we summarize the maximum values of CP violation discovery potential in the unfavourable half-plane of true , and the percentage of true values capable of giving a CP violation discovery signal at 2 and 3, for different combinations of the experiments T2K, NOA and ICAL at progressive points of time over the next 15 years. The following observations can be made from these results:
-
•
By 2016, T2K is expected to have an effective 5-year run with 1021 pot/year. We consider the cases of a (5+0) versus a (3+2) run, and find that with T2K alone, a (3+2) run provides a better CP sensitivity than a neutrino only (5+0) run, due to the complementary behaviour of the neutrino and antineutrino probabilities which partially resolves the hierarchy- degeneracy in the favourable half-plane of .
-
•
By 2020, NOA will complete a (3+3) run. We combine this with the T2K results for (3+2) and (5+0) and find that the combination offers similar CP sensitivity in both cases. This is because NOA , with its combined neutrino-antineutrino run, helps in resolving the hierarchy- degeneracy in the favourable half-plane and overrides the necessity of resolving it with T2K. Thus a neutrino-only T2K run proves to be as efficient towards CP sensitivity as a combined (3+2) run when it is taken in tandem with NOA . In this way the combination of T2K and NOA provides a synergy, apart from the improved sensitivity of the combination purely due to the increased statistics and exposure.
-
•
By 2024, NOA may have a (5+5) run. Combining this with T2K (5+0) adds to the CP sensitivity due to the higher NOA exposure, and can provide a CP violation discovery potential of up to 3 in the favourable half-plane and up to 2 at some points in the unfavourable half-plane. The precision determination is also improved but still displays some additional allowed regions in corresponding to the wrong-hierarchy solutions.
-
•
We also look at an extended (5+5) run of T2K, and consider it with NOA (5+5). In this case the CP violation discovery potential rises well above 3 for maximal CP violation in the favourable half-plane. The unfavourable half-plane gives a discovery signal of 2 over parts of the true range, but the discovery minima still occur with the wrong hierarchy. In the precision plots, the wrong-hierarchy allowed regions are ruled out at 90 C.L. but not at 95 C.L.
Experiment (timeline) max in UVHP FVHP fraction for CPV T2K (3+2) (2016) T2K (5+0) (2016) 0.8 T2K (3+2) + NOA (3+3) (2020) 7.5 T2K (5+0) + NOA (3+3) (2020) 8.2 T2K (5+0) + NOA (5+5) (2024) 10.7 T2K (5+5) + NOA (5+5) (2024) 12.5 T2K (5+0) + NOA (3+3) + ICAL 5 (2024) 8.3 T2K (5+0) + NOA (5+5) + ICAL 5 (2024) 10.8 T2K (5+5) + NOA (5+5) + ICAL 5 (2024) 12.7 T2K (5+0) + NOA (5+5) + ICAL 10 (2028) 11.0 T2K (5+5) + NOA (5+5) + ICAL 10 (2028) 12.7 Table 1: Values of maximal CP violation discovery in the favourable and unfavourable half-planes (FVHP and UVHP) and percentage of true values allowing CP violation discovery at 2/3 for combinations of experiments at different chronological points. Here , and true NH. -
•
Finally we look at a combination of ICAL@INO with NOA and T2K, and find that it resolves many of the issues with degeneracy observed in the NOA +T2K results. By 2024, ICAL will have at least 5 years of data. With a T2K (5+0) + NOA (5+5) + ICAL (5 years) combination, the CP violation discovery potential still exhibits a hierarchy- degeneracy and has discovery minima with the wrong hierarchy, but due to the hierarchy sensitivity of ICAL, the discovery potential is raised to about 2.5 over the central region of the unfavourable half-plane. The favourable half-plane is unaffected by the addition of ICAL. If we consider the situation in 2028, when ICAL is expected to have 10 years of data, the T2K (5+0) + NOA (5+5) + ICAL (10 years) combination completely resolves this degeneracy and the discovery potential goes up to 3 in both the favourable and unfavourable half-planes. The wrong-hierarchy allowed regions in the precision plots that are present for T2K (5+0) + NOA (5+5) at 90 C.L. go away at both 90 and 95 C.L. with the T2K (5+0) + NOA (5+5) + ICAL (5 years) combination.
-
•
Combining NOA and T2K with ICAL (10 years) also gives a modest improvement in lifting the octant- degeneracy, reducing the range of its effect and improving the discovery potential in the unfavourable half-plane. The advantage in this case is less than for the hierarchy- degeneracy since the octant sensitivity of ICAL is not as good as its hierarchy sensitivity.
-
•
For T2K (5+5) + NOA (5+5), a combination with ICAL (5 years) improves the discovery potential to about 2.7 over the central part of the unfavourable half-plane but the hierarchy- degeneracy is still present. Also, the small off-axis allowed regions at 95 C.L. in the precision plot for T2K (5+5) + NOA (5+5) get excluded when ICAL (5 years) is added. With 10 years of ICAL data, the hierarchy- degeneracy is fully resolved and the discovery potential of the NOA +T2K+ICAL combination achieves values above 3 over the central part of both the favourable and unfavourable half-planes. Thus the addition of ICAL can provide a more consistent signature of CP violation and a more constrained measurement of .
In conclusion, the combination of T2K and NOA can provide reasonable CP sensitivity for some values of neutrino parameters but is severely compromised in this regard in other ranges. The addition of atmospheric neutrino information bearing uniform hierarchy sensitivity may be crucial in measuring and detecting CP violation in case nature has chosen the parameter values unfavourable for LBL experiments. This fact has valuable ramifications for current experiments as well as for designing future LBL experiments like LBNO Stahl et al. (2012), where the inclusion of atmospheric neutrino data can significantly influence the exposures required for giving a high CP sensitivity over all allowed parameter values.
Acknowledgements
We thank Sanjib Kumar Agarwalla and Suprabh Prakash for useful discussions.
References
- Fogli et al. (2012) G. Fogli, E. Lisi, A. Marrone, D. Montanino, A. Palazzo, et al., Phys.Rev. D86, 013012 (2012), eprint 1205.5254.
- Zhang and Ma (2013) Y. Zhang and B.-Q. Ma (2013), eprint 1310.4443.
- Christenson et al. (1964) J. Christenson, J. Cronin, V. Fitch, and R. Turlay, Phys.Rev.Lett. 13, 138 (1964).
- Aubert et al. (2001) B. Aubert et al. (BaBar Collaboration), Phys.Rev.Lett. 87, 091801 (2001), eprint hep-ex/0107013.
- Abe et al. (2001) K. Abe et al. (Belle Collaboration), Phys.Rev.Lett. 87, 091802 (2001), eprint hep-ex/0107061.
- Lee (1973) T. Lee, Phys.Rev. D8, 1226 (1973).
- Lee (1974) T. Lee, Phys.Rept. 9, 143 (1974).
- Branco et al. (2012) G. Branco, R. G. Felipe, and F. Joaquim, Rev.Mod.Phys. 84, 515 (2012), eprint 1111.5332.
- Joshipura et al. (2001) A. S. Joshipura, E. A. Paschos, and W. Rodejohann, JHEP 0108, 029 (2001), eprint hep-ph/0105175.
- Endoh et al. (2002) T. Endoh, S. Kaneko, S. Kang, T. Morozumi, and M. Tanimoto, Phys.Rev.Lett. 89, 231601 (2002), eprint hep-ph/0209020.
- Forero et al. (2012) D. Forero, M. Tortola, and J. Valle, Phys.Rev. D86, 073012 (2012), eprint 1205.4018.
- Gonzalez-Garcia et al. (2012) M. Gonzalez-Garcia, M. Maltoni, J. Salvado, and T. Schwetz, JHEP 1212, 123 (2012), eprint 1209.3023.
- Bandyopadhyay et al. (2009) A. Bandyopadhyay et al. (ISS Physics Working Group), Rept.Prog.Phys. 72, 106201 (2009), eprint 0710.4947.
- Machado et al. (2013) P. Machado, H. Minakata, H. Nunokawa, and R. Z. Funchal (2013), eprint 1307.3248.
- Agarwalla et al. (2013a) S. K. Agarwalla, S. Prakash, and S. U. Sankar (2013a), eprint 1304.3251.
- Agarwalla et al. (2012) S. K. Agarwalla, S. Prakash, S. K. Raut, and S. U. Sankar, JHEP 1212, 075 (2012), eprint 1208.3644.
- Prakash et al. (2012) S. Prakash, S. K. Raut, and S. U. Sankar, Phys.Rev. D86, 033012 (2012), eprint 1201.6485.
- Blennow et al. (2013a) M. Blennow, P. Coloma, A. Donini, and E. Fernandez-Martinez, JHEP 1307, 159 (2013a), eprint 1303.0003.
- Abe et al. (2011a) K. Abe et al. (T2K Collaboration), Phys.Rev.Lett. 107, 041801 (2011a), eprint 1106.2822.
- Ayres et al. (2004) D. Ayres et al. (NOA Collaboration) (2004), eprint hep-ex/0503053.
- Burguet-Castell et al. (2001) J. Burguet-Castell, M. Gavela, J. Gomez-Cadenas, P. Hernandez, and O. Mena, Nucl.Phys. B608, 301 (2001), eprint hep-ph/0103258.
- Huber et al. (2009) P. Huber, M. Lindner, T. Schwetz, and W. Winter, JHEP 0911, 044 (2009), eprint 0907.1896.
- Ishitsuka et al. (2005) M. Ishitsuka, T. Kajita, H. Minakata, and H. Nunokawa, Phys.Rev. D72, 033003 (2005), eprint hep-ph/0504026.
- Mena and Parke (2004) O. Mena and S. J. Parke, Phys.Rev. D70, 093011 (2004), eprint hep-ph/0408070.
- Mena et al. (2006) O. Mena, S. Palomares-Ruiz, and S. Pascoli, Phys.Rev. D73, 073007 (2006), eprint hep-ph/0510182.
- Minakata and Nunokawa (2001) H. Minakata and H. Nunokawa, JHEP 0110, 001 (2001), eprint hep-ph/0108085.
- Barger et al. (2002) V. Barger, D. Marfatia, and K. Whisnant, Phys.Rev. D65, 073023 (2002), eprint hep-ph/0112119.
- Minakata and Sugiyama (2004) H. Minakata and H. Sugiyama, Phys.Lett. B580, 216 (2004), eprint hep-ph/0309323.
- Ghosh et al. (2013a) M. Ghosh, P. Ghoshal, S. Goswami, and S. K. Raut (2013a), eprint 1306.2500.
- Gandhi et al. (2007) R. Gandhi, P. Ghoshal, S. Goswami, P. Mehta, S. U. Sankar, et al., Phys.Rev. D76, 073012 (2007), eprint 0707.1723.
- Abe et al. (2011b) K. Abe, T. Abe, H. Aihara, Y. Fukuda, Y. Hayato, et al. (2011b), eprint 1109.3262.
- Akhmedov et al. (2013) E. K. Akhmedov, S. Razzaque, and A. Y. Smirnov, JHEP 02, 082 (2013), eprint 1205.7071.
- Akiri et al. (2011) T. Akiri et al. (LBNE Collaboration) (2011), eprint 1110.6249.
- Stahl et al. (2012) A. Stahl, C. Wiebusch, A. Guler, M. Kamiscioglu, R. Sever, et al. (2012).
- Ishida (2013) T. Ishida (Hyper-Kamiokande working group) (2013), eprint 1311.5287.
- Baussan et al. (2013) E. Baussan et al. (ESSnuSB Collaboration) (2013), eprint 1309.7022.
- Ghosh et al. (2013b) M. Ghosh, P. Ghoshal, S. Goswami, and S. K. Raut (2013b), eprint 1308.5979.
- Kimura et al. (2002) K. Kimura, A. Takamura, and H. Yokomakura, Phys. Lett. B537, 86 (2002), eprint hep-ph/0203099.
- Ohlsson et al. (2013) T. Ohlsson, H. Zhang, and S. Zhou, Phys.Rev. D87, 053006 (2013), eprint 1301.4333.
- Akhmedov et al. (2004) E. K. Akhmedov, R. Johansson, M. Lindner, T. Ohlsson, and T. Schwetz, JHEP 0404, 078 (2004), eprint hep-ph/0402175.
- Cervera et al. (2000) A. Cervera, A. Donini, M. Gavela, J. Gomez Cadenas, P. Hernandez, et al., Nucl.Phys. B579, 17 (2000), eprint hep-ph/0002108.
- Freund (2001) M. Freund, Phys.Rev. D64, 053003 (2001), eprint hep-ph/0103300.
- Fogli and Lisi (1996) G. L. Fogli and E. Lisi, Phys.Rev. D54, 3667 (1996), eprint hep-ph/9604415.
- Chatterjee et al. (2013) A. Chatterjee, P. Ghoshal, S. Goswami, and S. K. Raut, JHEP 1306, 010 (2013), eprint 1302.1370.
- Barger et al. (2012) V. Barger, R. Gandhi, P. Ghoshal, S. Goswami, D. Marfatia, et al., Phys.Rev.Lett. 109, 091801 (2012), eprint 1203.6012.
- Agarwalla et al. (2013b) S. K. Agarwalla, S. Prakash, and S. U. Sankar (2013b), eprint 1301.2574.
- Huber et al. (2005) P. Huber, M. Lindner, and W. Winter, Comput.Phys.Commun. 167, 195 (2005), eprint hep-ph/0407333.
- Huber et al. (2007) P. Huber, J. Kopp, M. Lindner, M. Rolinec, and W. Winter, Comput.Phys.Commun. 177, 432 (2007), eprint hep-ph/0701187.
- Messier (1999) M. D. Messier (1999).
- Paschos and Yu (2002) E. Paschos and J. Yu, Phys.Rev. D65, 033002 (2002), eprint hep-ph/0107261.
- Itow et al. (2001) Y. Itow et al. (T2K Collaboration), pp. 239–248 (2001), eprint hep-ex/0106019.
- Patterson (2012) R. Patterson (NOA) (2012), talk given at the Neutrino 2012 Conference, June 3-9, 2012, Kyoto, Japan, http://neu2012.kek.jp/.
- Huber et al. (2002) P. Huber, M. Lindner, and W. Winter, Nucl.Phys. B645, 3 (2002), eprint hep-ph/0204352.
- Fechner (2006) M. Fechner (2006).
- Kato (2008) I. Kato (T2K Collaboration), J.Phys.Conf.Ser. 136, 022018 (2008).
- Ghosh et al. (2013c) A. Ghosh, T. Thakore, and S. Choubey, JHEP 1304, 009 (2013c), eprint 1212.1305.
- Dziewonski and Anderson (1981) A. Dziewonski and D. Anderson, Phys.Earth Planet.Interiors 25, 297 (1981).
- Blennow et al. (2013b) M. Blennow, P. Coloma, P. Huber, and T. Schwetz (2013b), eprint 1311.1822.
- Qian et al. (2012) X. Qian, A. Tan, W. Wang, J. Ling, R. McKeown, et al., Phys.Rev. D86, 113011 (2012), eprint 1210.3651.
- Ciuffoli et al. (2013) E. Ciuffoli, J. Evslin, and X. Zhang (2013), eprint 1305.5150.
- Schwetz (2007) T. Schwetz, Phys.Lett. B648, 54 (2007), eprint hep-ph/0612223.
- Blennow (2013) M. Blennow (2013), eprint 1311.3183.
- de Gouvea et al. (2005) A. de Gouvea, J. Jenkins, and B. Kayser, Phys.Rev. D71, 113009 (2005), eprint hep-ph/0503079.
- Nunokawa et al. (2005) H. Nunokawa, S. J. Parke, and R. Zukanovich Funchal, Phys.Rev. D72, 013009 (2005), eprint hep-ph/0503283.
- Raut (2013) S. K. Raut, Mod.Phys.Lett. A28, 1350093 (2013), eprint 1209.5658.
- Samanta (2009) A. Samanta, Phys.Rev. D80, 073008 (2009), eprint 0907.3978.
- Ge et al. (2013) S.-F. Ge, K. Hagiwara, and C. Rott (2013), eprint 1309.3176.
- Hiraide et al. (2006) K. Hiraide, H. Minakata, T. Nakaya, H. Nunokawa, H. Sugiyama, et al., Phys.Rev. D73, 093008 (2006), eprint hep-ph/0601258.