MAGIC reveals a complex morphology within the unidentified gamma-ray source HESS J1857+026
Abstract
Aims. HESS J1857+026 is an extended TeV gamma-ray source that was discovered by H.E.S.S. as part of its Galactic plane survey. Given its broadband spectral energy distribution and its spatial coincidence with the young energetic pulsar PSR J1856+0245, the source has been put forward as a pulsar wind nebula (PWN) candidate. MAGIC has performed follow-up observations aimed at mapping the source down to energies approaching 100 GeV in order to better understand its complex morphology.
Methods. HESS J1857+026 was observed by MAGIC in 2010, yielding 29 hours of good quality stereoscopic data that allowed us to map the source region in two separate ranges of energy.
Results. We detected very-high-energy gamma-ray emission from HESS J1857+026 with a significance of above GeV. The differential energy spectrum between GeV and TeV is well described by a power law function with and , which bridges the gap between the GeV emission measured by Fermi-LAT and the multi-TeV emission measured by H.E.S.S.. In addition, we present a detailed analysis of the energy-dependent morphology of this region. We couple these results with archival multi-wavelength data and outline evidence in favor of a two-source scenario, whereby one source is associated with a PWN, while the other could be linked with a molecular cloud complex containing an Hii region and a possible gas cavity.
Key Words.:
Acceleration of particles, Gamma-rays: ISM, ISM: clouds, Hii regions, ISM: individual objects: HESS J1857+026, pulsars: individual: PSR J1856+02451 Introduction
One of the long standing goals of very-high-energy (VHE) gamma-ray astronomy is to trace the particle populations responsible for producing TeV photons and, in so doing, to search for the sources of cosmic rays in our Galaxy. VHE gamma rays may be produced through hadronic interactions via the decay channel and by energetic electrons through inverse compton (IC) scattering on soft photon fields or via nonthermal Bremsstralung. These parent particles are thought to be energized by shock acceleration, which very likely happens in astrophysical objects such as supernova remnants (SNRs), pulsar wind nebulae (PWNe) and compact binaries. More recently, some Galactic TeV gamma-ray sources have been linked to regions of massive star formation, although these associations are complicated by the expected presence of additional objects of the aforementioned types. Finally, nearly one third of all Galactic sources, many of which were discovered through the H.E.S.S. galactic plane survey (Carrigan et al. 2013) remain unidentified and could provide new insight into these extreme astrophysical environments.
HESS J1857+026 was discovered as a source without clear associations at other wavelengths during the H.E.S.S. survey of the inner Galaxy (Aharonian et al. 2008). The source had an intrinsic extension of , with an inclination (measured counter-clockwise with respect to the RA-axis) of . A significant tail-like structure toward the north was also seen, which hinted at either a larger overall extension or a weaker but distinct northern source. The spectrum of HESS J1857+026, which covered the range of TeV, was well described by a single power law with a spectral index of .
Subsequent searches at radio wavelengths have led to the discovery of a nearby energetic pulsar, PSR J1856+0245, with a spin period of 81 ms and characteristic spin-down age of 21 kyr (Hessels et al. 2009). Given a pulsar dispersion measure (DM) of cm-3pc, the distance was estimated to be kpc based on the NE2001 model for the Galactic distribution of free electrons (Cordes & Lazio 2002). The uncertainty on this distance is not well determined and the value may vary by factors of (Hessels et al. 2009), which in turn leads to large uncertainties on the estimated size and energetics of the candidate PWN.
HESS J1857+026 was also detected at GeV energies (Neronov & Semikoz 2010; Paneque et al. 2011; Rousseau et al. 2012), although no significant pulsation from the pulsar was found in 3 years of Fermi-LAT data. Rousseau et al. (2012) extracted a spectrum assuming a point source, and fit both leptonic and hadronic models to a broadband spectral energy distribution (SED) that used the original H.E.S.S. results and preliminary results from MAGIC (Klepser et al. 2011). Their multi-wavelength SED also included an upper limit on the extended X-ray synchrotron flux based on archival Chandra X-ray data, the analysis of which was presented by Nice et al. (2013). The authors found no evidence of an X-ray PWN in the region around PSR J1856+0245 and derived a upper limit on the unabsorbed keV flux that translated into a limit on the luminosity of for an assumed distance of kpc. The extraction region used to derive this limit was an annulus centered on the pulsar with inner and outer radii of and , respectively. This extended X-ray flux upper limit implies a weak magnetic field in the case of leptonic scenarios, with best-fit values in the models of Rousseau et al. (2012) being in the order of a few G.
We present our follow-up study of the complex morphology of HESS J1857+026. Section 2 describes the observations and data analysis performed using MAGIC. We summarize the MAGIC results in Section 3. In Section 4 we describe our multi-wavelength study of this region, which makes use of archival data in the radio and infrared bands. In Section 5 we present our physical interpretation of the VHE gamma-ray and multi-wavelength results. We summarize our conclusions in Section 6.
2 Analysis with MAGIC
MAGIC is a system of two Imaging Atmospheric Cherenkov Telescopes (IACTs) located at the Observatorio Roque de los Muchachos on the Canary Island of La Palma, Spain, which has been operating in stereoscopic mode since 2009. Prior to this, MAGIC comprised a single IACT that began operating in 2004. MAGIC achieves a low trigger threshold of GeV, while its sensitivity to point-like sources is 0.8 Crab units (C.U.) above 290 GeV in 50 hours (Aleksic et al. 2012).
We observed HESS J1857+026 during July-October 2010, taking 29 hours of data, for zenith angles between . The data were taken in wobble mode by pointing the telescopes at four different pairs of pointing directions symmetric with respect to the source position, in order to obtain a more uniform and flat exposure. Two of these pairs were chosen to be at distance from the direction RA: and DEC: , while the other two were away.
The results presented here were obtained using the MARS analysis framework (Moralejo et al. 2009) and using the image ‘sum-cleaning’ algorithm (Lombardi et al. 2011), which was found to improve the performance at lower energies, close to 100 GeV. The calibrated photomultiplier signals were cleaned to reduce the effect of the night sky background light, and the resulting image shape and timing information were combined between the two telescopes for each stereoscopic event. The gamma/hadron separation and the event direction reconstruction both made use of the random forest method (Albert et al. 2008). The estimated energy of a given event was determined from the brightness of the shower images, its reconstructed impact parameter and its incidence direction, using Monte Carlo (MC) filled look-up tables. Given that HESS J1857+026 is an extended source our analysis used random forests and look-up tables that were trained using diffuse MC gamma-ray events.
The determination of excess events in the signal region accounts for geometric exposure inhomogeneities by computing the background from the corresponding wobble partner data set and extracting it at the same relative camera plane coordinates as the signal region (further details in Krause (2013)). Our skymapping procedure models the background directly from the data and in bins of azimuth, thus taking azimuthal dependencies of the off-axis exposure into account (Lombardi et al. 2011). To compute the flux, we estimated the average effective area using a diffuse MC gamma-ray data sample selected as an annulus with radii and , in order to account for variations in acceptance across the extent of the source. The resulting spectra were cross-checked in terms of the normalization of the estimated background inside the signal region by event numbers or by effective on-time with respect to the off-source regions. Furthermore, the unfolded spectrum was checked against four different spectral unfolding algorithms (Albert et al. 2007), including the so-called forward folding method, which fits the assumed spectrum by folding it with the energy response matrix and comparing the resulting distribution with the measured distribution of excess events.
3 Spectral and morphology results
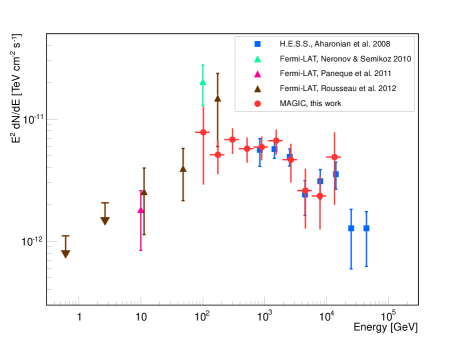
The MAGIC detection and spectrum of HESS J1857+026 were obtained using a large circular signal extraction region with a radius of , chosen to cover the entire extent of the source. Coupling this with a set of loose background rejection cuts with an MC gamma-ray efficiency of , we detected the source above GeV with a significance of , using Eq. 17 of Li & Ma (1983). The spectrum measured by MAGIC was fitted through forward folding and is well described () by a single power law of the form with index and differential flux at 1 TeV of . The MAGIC spectrum is shown in Figure 1 together with Fermi-LAT (Neronov & Semikoz 2010; Paneque et al. 2011; Rousseau et al. 2012) and H.E.S.S. (Aharonian et al. 2008) results. Our spectral points have been unfolded to correct for migration and energy biasing effects (Albert et al. 2007), therefore the errors are not independent. The measurement made by MAGIC connects those by H.E.S.S. and Fermi-LAT, providing a continuous coverage of the spectral turnover close to 100 GeV.
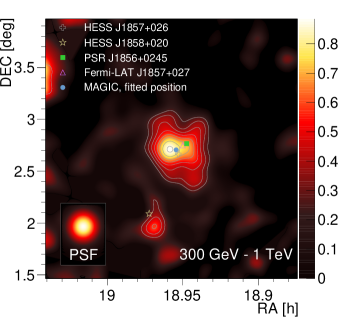
The gamma-ray flux sky maps in Figure 2 show the energy-dependent morphology of HESS J1857+026. Based on MC gamma rays weighted using a spectral index of 2.3, the median energies of the low and high energy maps are around 480 GeV and 1.7 TeV, respectively. The source HESS J1858+020 is not investigated here, given our relatively low exposure at its angular distance from the MAGIC pointing positions. In the estimated energy range of TeV, we have an instrument point spread function (PSF) of and applied a smearing kernel of such that the total PSF is , while above TeV, our instrument PSF of and smearing kernel of resulted in a total PSF of . Each of the aforementioned numbers corresponds to the value of a symmetric 2D Gaussian function. We fitted a symmetric 2D Gaussian function to the TeV gamma-ray flux map and obtained a centroid position of RA: and DEC: which is compatible with the H.E.S.S. centroid position. We also measured an intrinsic source extension of from the fit, after removing the combined effect of the instrument PSF and the applied smearing.
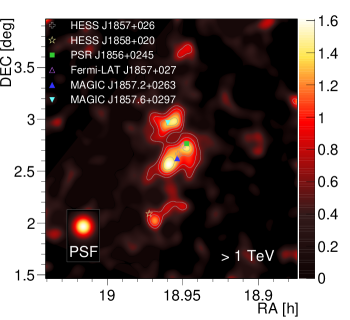
Above TeV we found that the VHE emission is due to two spatially distinct statistically significant components, which we denote MAGIC J1857.2+0263 and MAGIC J1857.6+0297, as indicated in Figure 2. Using integration radii of for MAGIC J1857.2+0263 and for MAGIC J1857.6+0297, we computed significances of and respectively, by applying Eq. 17 of Li & Ma (1983). These radii were chosen to be as large as possible without having any overlap. In order to measure the positions and intrinsic extensions of the two components, we applied an iterative procedure in which we fitted one peak at a time while including the adjacent previously fitted 2D Gaussian function into the background. The elongated source MAGIC J1857.2+0263 was fitted by a non-circular 2D Gaussian which yielded a centroid position RA: and DEC: and intrinsic extensions of and along its major and minor axes, respectively, with the major axis having an inclination of counter-clockwise with respect to the RA-axis. MAGIC J1857.6+0297 was fitted by a circular 2D Gaussian which gave a mean position: RA: and DEC: and was compatible with a point source.
We also tried to extract spectra around MAGIC J1857.2+0263 and MAGIC J1857.6+0297 using integration radii of and , respectively. The limited event statistics above TeV and the inability to resolve the two peaks at lower energies made it difficult to extract spatially-resolved spectra. We estimate that the respective differential fluxes of MAGIC J1857.2+0263 and MAGIC J1857.6+0297 are and of the total differential flux at TeV, which was measured from a circular region with of radius of and centered on RA: and DEC: . We also determined a spectral index of for MAGIC J1857.2+0263, which is compatible with that obtained for the entire region.
4 Multi-wavelength view
While we expect MAGIC J1857.2+0263 to be associated with PSR J1856+0245, the origin of the VHE emission from MAGIC J1857.6+0297 is unidentified and we analyzed archival multi-wavelength data to look for possible counterparts. At radio wavelengths we used the 21 cm continuum and atomic hydrogen (Hi) line emission data from the Very Large Array (VLA) Galactic Plane Survey (VGPS) (Stil et al. 2006). At mm wavelengths we used the molecular line emission data from the Galactic ring survey (GRS) (Jackson et al. 2006) to trace the molecular hydrogen (H2) in this region. Finally, we examined m images from the Spitzer Galactic Legacy Infrared Midplane Survey Extraordinaire (GLIMPSE) Legacy Project (Benjamin et al. 2003). Further details regarding these data sets and our analysis are given in Appendix A.
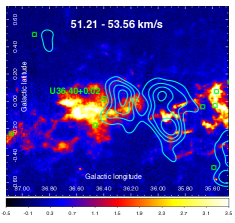

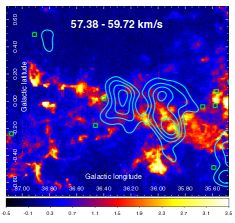
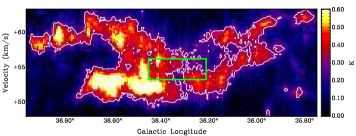
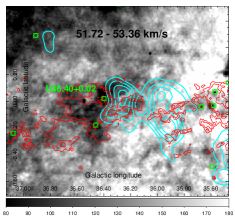
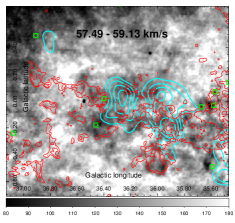
From the GRS data cube we computed the average emission spectrum over Galactic longitudes of to and Galactic latitudes of to , finding two prominent peaks at kinematic local standard of rest (LSR) velocity () km s-1 and km s-1. We associate these peaks with three molecular gas clouds in the catalog of Roman-Duval et al. (2009): G036.59-00.06, G036.74-00.16 and G036.49-00.16, with kinematic distances of kpc, kpc and kpc, respectively. Most of the emission from G036.49-00.16 is outside the contour of MAGIC J1857.6+0297, which disfavors it as a counterpart. Figure 3 shows the molecular line emission toward MAGIC J1857.6+0297 for a range of velocities that span those of G036.59-00.06 and G036.74-00.16. The range km s-1 shows mainly the emission from G036.59-00.06, while at larger kinematic distances the range of km s-1 shows emission from both G036.74-00.16 and G036.59-00.06.
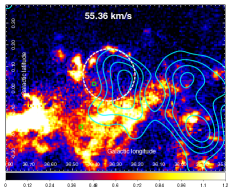
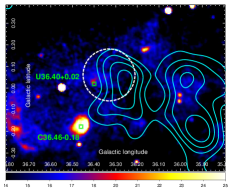
Star formation takes place in the dense cores of massive molecular clouds, and this leads to a natural connection between molecular clouds and Hii regions. The molecular gas properties of Hii regions were explored by Anderson et al. (2009), and their kinematic distances were determined by Anderson & Bania (2009) using the Galactic rotation curve of McClure-Griffiths & Dickey (2007). We searched these catalogs for Hii regions close to the direction of MAGIC J1857.6+0297, finding two candidate counterparts. The first is the compact Hii region C36.46-0.18, has a radio recombination line velocity of km s-1 (Lockman 1989) and a fitted molecular gas velocity of km s-1, which corresponds to a distance of kpc (Anderson & Bania 2009). Hence it is likely associated with the molecular cloud G036.49-00.16 ( km s-1) and we consider it unrelated to the VHE emission. The second candidate is the ultra-compact Hii region U36.40+0.02. Observations of H emission from this region determined a velocity of km s-1 and a corresponding near kinematic distance of kpc (Watson et al. 2003), assuming the Galactic rotation curve of Brand & Blitz (1993). H2CO absorption line measurements by Watson et al. (2003) indicated the presence of molecular clouds at km s-1 and at km s-1. U36.40+0.02 has a fitted molecular gas velocity of km s-1 with corresponding near kinematic distance of kpc (Anderson & Bania 2009), and hence is likely to be associated with the cloud G036.59-00.06 ( km s-1).
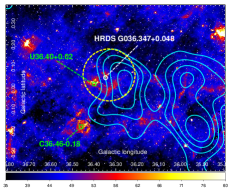
The velocity ranges of km s-1 and km s-1 in Figure 3 were selected to illustrate the two prominent emission peaks in the molecular gas complex surrounding U36.40+0.02. Between them, in the range of km s-1, we discovered an incomplete shell-like structure coincident with the direction of MAGIC J1857.6+0297. Furthermore, the Galactic longitude-velocity and latitude-velocity plots in Figure 6 of Appendix B show a perturbed spatial and velocity structure in the side of the cloud G036.59-00.06, in a region that roughly corresponds to the directions and velocity channels over which this feature is visible. In particular, the latitude-velocity signature indicates that the partial shell spans km s-1 in velocity space. Figure 4 shows a single GRS velocity channel at km s-1 that provides a close-up view of what could be a gas cavity or wind-blown bubble.
In Figure 4 we also show the 8 m emission, which primarily traces emission from polycyclic aromatic hydrocarbons (PAHs) heated by UV starlight. These carbon molecules are found in photodissociation regions (PDRs), which interface the ionized matter in Hii regions and the molecular gas of their parent clouds. The 8 m emission from U36.40+0.02, which was originally called IRAS 18551+0302 (Beichman et al. 1988), shows a possible diffuse component that extends toward the center of the proposed gas cavity. A second, more compact, component corresponds to the newly discovered Hii region HRDS G036.347+0.048 (Bania et al. 2012). While a kinematic distance has not been determined for this source, its hydrogen radio recombination line (Hn) spectrum yielded a of km s-1, so it is not physically related to U36.40+0.02. A survey of IRAS sources using the high-density gas tracer provided a velocity of km s-1 for IRAS 18551+0302 (Bronfman et al. 1996). This measurement likely traces the gas clump seen in the range of km s-1 of Figure 3. Ammonia emission, which traces high density ( cm-3) gas, was also detected by the Red MSX Source (RMS) survey (Urquhart et al. 2011), in which the source, MSX6C G036.4057+00.0230, had a NH3 (,) velocity of km s-1. The authors also detected H2O maser emission, which indicates on-going star formation. This was found over the velocity range km s-1 with the peak emission at km s-1, which is just below the range of km s-1 shown in Figure 3.

In Figure 5 we display the Hi 21 cm line emission from the VGPS over three velocity ranges that approximately correspond to those of Figure 3. The most compact Hi absorption features, produced against strong background continuum emission (Kuchar & Bania 1990), can be either galactic (e.g. Hii regions) or extragalactic in origin. The velocity ranges km s-1 and km s-1 exhibit absorption from cold neutral atomic hydrogen that is associated with a molecular cloud absorbing against more distant warm 21 cm emitting gas (e.g. see Roman-Duval et al. (2009)). Cold, optically thick Hi can form in the dense parts of molecular clouds through the dissociation of by penetrating cosmic rays. Goldsmith & Li (2005) found that its resulting self-absorption features tend to correlate with peaks in the emission. We note, however, that the dark region located within the yellow dashed circle shown in Figure 5 does not spatially coincide with any bright emission in the same velocity range, nor with any strong background continuum source (see Figure 4). This feature may be explained as self-absorption by cold atomic gas components surrounding the molecular cloud. These are expected to form via the photodissociation of by interstellar UV photons (Jackson et al. 2002). Such optically thick Hi may also trace that is not detected in , or alternatively, it may point to a strong shock induced depletion of the dust grains, which provide photoelectric heating and facilitate formation (see Gibson (2010), and references therein). Finally, the feature could also be a real void in the atomic gas. We note that the possible presence of OB stars would lead to a natural connection between such a cavity and the surrounding shell-like feature.
5 Discussion
The broadband SED of HESS J1857+026 in Figure 1 exhibits a strong turnover at energies close to 100 GeV. This may be attributed to the IC peak expected from a leptonic scenario, although Rousseau et al. (2012) showed that the SED could also be modeled in terms of gamma-ray emission with a hadronic origin. Here we consider whether the proposed PWN scenario can adequately explain the morphology of HESS J1857+026 observed with HESS, MAGIC and Fermi-LAT.
While we find that the source is significantly extended with respect to our PSF in the energy range of TeV, no significant extension was found by Rousseau et al. (2012) using Fermi-LAT data for energies above 10 GeV. The MAGIC TeV intrinsic extension of however, is comparable to the size of the instrument PSF (% containment radius) of Fermi-LAT above 10 GeV, and this may explain the non-detection of an intrinsic extension for this source using Fermi-LAT. Indeed Acero et al. (2013) recently specified a 99% confidence level upper limit of on the extension of this source. Comparing with H.E.S.S., the intrinsic extension measure of in their energy range is consistent with our TeV extension measurement. Furthermore, if we only attribute the PWN emission above 1 TeV to MAGIC J1857.2+0263, its size of is in good agreement with the H.E.S.S. result, although it is not clear to what extent the north tail-like emission, which is seen in the H.E.S.S. skymap and may correspond to MAGIC J1857.6+0297, influenced their 2D Gaussian fit.
By itself, the MAGIC energy-dependent morphology would favor a leptonic PWN scenario in which lower energy electrons can diffuse out to larger distances from the pulsar, but only if we consider MAGIC J1857.2+0263 in the TeV map of Figure 2 as an independent source that becomes less compact at TeV. This implies that the fainter MAGIC J1857.6+0297 emission, which we only resolve above TeV, is unrelated to PSR J1856+0245. This is because if MAGIC J1857.6+0297 was due to the PWN electrons, its distance from the pulsar would be pc, where is the distance to PSR J1856+0245, and this would make the entire emission region more extended above TeV than below. Moreover, if MAGIC J1857.6+0297 did indeed trace the same PWN as MAGIC J1857.2+0263, the apparent hole between these emission regions makes it less likely that both originate from the IC scattering of ambient photons on the same electron population.
While we do not consider any sub-structure within MAGIC J1857.2+0263 to be significant, we note that PSR J1856+0245 is located close to one end of its major axis. Using the observed angular elongation of MAGIC J1857.2+0263 we can estimate the physical length of the PWN emission region to be pc. The VHE gamma-ray emission of a PWN traces a relic electron population accumulated over its lifetime. If we consider the characteristic spin-down age of PSR J1856+0245 ( kyr) and assume a typical velocity of km s-1, the offset resulting from its proper motion would be at most pc. This maximum value corresponds to the extreme case in which the velocity direction is perpendicular to the line of sight. However, as outlined by Gaensler & Slane (2006), the morphology of middle-aged PWN can be strongly influenced by the complex interaction between the PWN and the reverse shock of its SNR. This can distort the PWN morphology and cause an offset in the position of the pulsar with respect to the center of VHE emission. Therefore the observed morphology of MAGIC J1857.2+0263 may indicate that such evolutionary effects have played some role in its elongated appearance.
The nature of the VHE emission from MAGIC J1857.6+0297 remains a mystery, although our targeted multi-wavelength study provides some clues to its origin. The shell-like morphology of the channel maps seen in Figures 3, coupled with the corresponding signatures of perturbed gas in Figure 6, points to the presence of a cavity or wind-blown bubble of radius pc that coincides with the direction of the VHE gamma-ray emission peak. Here we consider possible scenarios in which the proposed cavity and the nearby ultra-compact Hii region U36.40+0.02, which is embedded in this molecular gas complex, are linked to MAGIC J1857.6+0297. That the peak of the TeV emission does not spatially correspond to the emission peaks in any of the velocity ranges shown in Figure 3 would argue against a hadronic origin, where molecular hydrogen acts as target matter for the accelerated hadrons. The emission could therefore have a leptonic origin, where accelerated electrons may IC scatter on the IR to UV photon fields of U36.40+0.02. We do not, however, exclude a hadronic origin due to the possible presence of cold, dense atomic gas within the proposed cavity, which could also act as target material for accelerated hadrons (e.g. see Fukui et al. (2012)).
A leptonic scenario that may explain the radio data has the VHE emission originating from a PWN whose progenitor star was in an OB association formed within U36.40+0.02, the stellar winds of which created the cavity. As outlined in de Jager & Djannati-Ataï (2008), this could then facilitate an initial unimpeded expansion of the PWN, allowing for weaker magnetic fields that would result in lower levels of synchrotron cooling for the VHE gamma-ray emitting electrons. A similar scenario was also proposed by Bock & Gvaramadze (2002) to explain the possible association of the pulsar PSR B1706-44 with SNR G343.1-2.3, which are candidate counterparts of the extended source HESS J1708-443 (Abramowski et al. 2011). Bock & Gvaramadze (2002) suggested that in this case, the massive progenitor star escaped its molecular cloud and produced a wind-blown bubble in the less dense ISM together with a wind-driven cavity in the parent cloud. They also speculated that the subsequent SN blast wave then interacted on one side with the shell of the bubble and with the parent cloud on the other side. In the case of MAGIC J1857.6+0297, additional high-resolution multi-wavelength data at radio wavelengths and in X-rays will be necessary to fully test such a scenario.
An alternative source of particle acceleration to explain the observed VHE emission could be the combined effect of the strong stellar winds themselves. For instance, VHE gamma rays may be produced by particles accelerated in the colliding winds of early-type (O, early B, Wolf-Rayet) star binary systems, although Reimer et al. (2006) showed that the spectra of such systems are expected to suffer from strong absorption above GeV due to pair production in the surrounding photon fields. Given that U36.40+0.02 and the surrounding dense molecular gas host regions of on-going star formation, as evidenced by the H2O maser emission, the VHE emission could instead stem from particles accelerated to multi-TeV energies at the shocks produced by outflows from massive protostars (Araudo et al. 2008; Bosch-Ramon et al. 2010). Since the kinetic luminosity of one such jet is expected to be around , a collection of these objects would also be required to explain the VHE emission.
6 Conclusions
MAGIC has performed observations of the TeV PWN candidate source HESS J1857+026 in order to better understand its complex morphology. We have also extended the VHE spectrum of the source down to 100 GeV, thus bridging the gap between the earlier spectral measurements of H.E.S.S. and those obtained more recently with Fermi-LAT. Assuming that the observed VHE gamma-ray emission is produced by energetic electrons via the IC channel, their energy-dependent diffusion would dictate a more extended PWN about PSR J1856+0245 when going down in energy from the multi-TeV regime to the range covered by Fermi-LAT. Our study of the energy-dependent morphology has revealed for the first time that this is is not the case, with the source becoming more extended above 1 TeV. Based on this finding we have proposed a two-source scenario for the separated and statistically significant peaks in emission that we detected above 1 TeV, which we have called MAGIC J1857.2+0263 and MAGIC J1857.6+0297. We then interpret MAGIC J1857.2+0263 as the emission from the relic PWN of PSR J1856+0245. We expect that the elongated shape of the emission above 1 TeV as well as its offset position from the pulsar are signatures of complex PWN evolutionary processes, which involve an interaction with the SNR reverse shock, while the initial pulsar velocity could also play a role.
We have used archival multi-wavelength data at radio and infra-red wavelengths to search for possible counterparts of MAGIC J1857.6+0297. We found a possible association with an ultra-compact Hii region located at kpc and its neighboring molecular clouds. The morphology of molecular gas in this region suggests that a cavity or wind-blown bubble may be present just behind the Hii region and in the same direction as the peak of the VHE emission. Assuming that MAGIC J1857.6+0297 is indeed associated with this cloud complex, the overall lack of overlap with the most dense parts of the molecular clouds hints at a leptonic origin for the VHE gamma-ray emission. A hadronic origin is not excluded, however, due to the possible presence of an atomic gas cloud within the proposed cavity. We have outlined alternative scenarios that could explain the proposed link between the gamma-ray emission and this molecular cloud complex. They include a PWN whose progenitor star created a cavity in the cloud prior to its SN explosion, particle acceleration based on the combined effects of strong stellar winds from massive stars, or the acceleration of particles in the outflows of massive protostars. More targeted multi-wavelength data will be needed, especially in X-rays, in order to characterize this interesting region and test whether it really is the source of the TeV gamma rays.
Acknowledgements.
We would like to thank the Instituto de Astrofísica de Canarias for the excellent working conditions at the Observatorio del Roque de los Muchachos in La Palma. The support of the German BMBF and MPG, the Italian INFN, the Swiss National Fund SNF, and the Spanish MICINN is gratefully acknowledged. This work was also supported by the CPAN CSD2007-00042 and MultiDark CSD2009-00064 projects of the Spanish Consolider-Ingenio 2010 programme, by grant 127740 of the Academy of Finland, by the DFG Cluster of Excellence “Origin and Structure of the Universe”, by the Croatian Science Foundation Project 09/176, by the DFG Collaborative Research Centers SFB823/C4 and SFB876/C3, and by the Polish MNiSzW grant 745/N-HESS-MAGIC/2010/0.References
- Abramowski et al. (2011) Abramowski, A., et al. (H.E.S.S. Collaboration) 2011, A&A, 528, 143
- Acero et al. (2013) Acero, F., et al. (Fermi-LAT Collaboration) 2013, ApJ, 773, 77
- Aharonian et al. (2008) Aharonian, F., et al. (H.E.S.S. Collaboration) 2008, A&A, 477, 353
- Albert et al. (2007) Albert, J., et al. (MAGIC Collaboration) 2007, Nucl. Instr. Meth. A, 583, 494
- Albert et al. (2008) Albert, J., Aliu, E., Anderhub, H., et al. 2008, Nucl.Instrum.Meth., A588, 424
- Aleksic et al. (2012) Aleksić, J., et al. (MAGIC Collaboration) 2012, Astropart. Phys., 35, 435
- Araudo et al. (2008) Araudo, A.T., Romero, G.E., Bosch-Ramon, V., et al. 2008, IJMPD, 17, 1889
- Anderson & Bania (2009) Anderson, L.D., Bania, T.M. 2009, ApJ, 690, 706
- Anderson et al. (2009) Anderson, L.D., Bania, T.M., Jackson, J.M., et al. 2009, ApJS, 181, 255
- Bania et al. (2012) Bania, T.M., Anderson, L.D., & Balser, D.S. 2012, ApJ, 759, 96
- Beichman et al. (1988) Beichman, C.A., Neugebauer, G., Habing, H.J., et al. 1988, IRAS Catalogs and Atlases, Vol.1: Explanatory Supplement (Pasadena: JPL)
- Benjamin et al. (2003) Benjamin, R.A., Churchwell, E., Babler, B.L., et al. 2003, PASP, 115, 953
- Bock & Gvaramadze (2002) Bock, D.C.-J., Gvaramadze, V.V. 2002, A&A, 394, 533
- Bosch-Ramon et al. (2010) Bosch-Ramon, V., Romero, G.E., Araudo, A.T., et al. 2010, A&A, 511, 8
- Brand & Blitz (1993) Brand, J., Blitz, L. 1993, A&A, 275, 67
- Bronfman et al. (1996) Bronfman, L., Nyman, L.-A., & May, J. 1996, A&AS, 115, 81
- Carrigan et al. (2013) Carrigan, S., Brun, F., & Chaves, R.C.G., et al., Proc. 33rd ICRC 2013 (arXiv:1307.4690v2)
- Clemens et al. (1985) Clemens, D.P. 1985, ApJ, 295, 422
- Cordes & Lazio (2002) Cordes, J.M., Lazio, T. J. W. 2002, preprint (arXiv:astro-ph/0207156)
- de Jager & Djannati-Ataï (2008) de Jager, O.C., Djannati-Ataï A. 2008, preprint (arXiv:astro-ph/0803.0116)
- Fukui et al. (2012) Fukui, Y., Sano, H., Sato, J., et al. 2012, ApJ, 746, 82
- Gaensler & Slane (2006) Gaensler, B.M., Slane, P.O. 2006, ARA&A, 44, 17
- Goldsmith & Li (2005) Goldsmith, P. F., Li, D. 2005, ApJ, 622, 938
- Gooch (1996) Gooch, R.E. 1996, ”Karma: a Visualisation Test-Bed”, in ADASS V, ASP Conf. Series vol. 101, ed. G.H. Jacoby & J. Barnes, ASP
- Gibson (2010) Gibson S. J. 2010, ”Cold Atomic Gas in the CGPS and Beyond”, in Astronomical Society of the Pacific Conf. Series vol. 438, p 111, ed. R. Kothes, T. L. Landecker, & A. G. Willis, ASP
- Hessels et al. (2009) Hessels, J.W., Nice D.J., Gaensler B.M., et al. 2008, ApJ, 682, L41
- Jackson et al. (2002) Jackson, J.M., Bania, T.M., Simon, R., et al. 2002, ApJ , 163, 145
- Jackson et al. (2006) Jackson, J.M., Rathborne, J.M., Shah, R.H. et al. 2006, ApJ Suppl., 163, 145
- Joye & Mandel (2003) Joye, W. A., Mandel, E. 2003, Astronomical Data Analysis Software and Systems XII ASP Conference Series, Vol. 295, p.489, ed. H. E. Payne, R. I. Jedrzejewski, & R. N. Hook
- Kennel & Coroniti (1984) Kennel, C.F., Coroniti, F.V. 1984, Ap.J., 283, 694
- Klepser et al. (2011) Klepser, S., Krause, J., & Doro, M., et al., Proc. 32nd ICRC 2011 (arXiv:1109.6448v1)
- Krause (2013) Krause, J.D.G. 2013, Ludwig-Maximilians-Universität München, Ph.D. Thesis http://nbn-resolving.de/urn:nbn:de:bvb:19-155655
- Kuchar & Bania (1990) Kuchar, T. A., Bania, T. M. 1990, Ap.J., 352, 192
- Li & Ma (1983) Li, T.-P., & Ma, Y.-Q. 1983, ApJ, 272, 317
- Lockman (1989) Lockman, F.J. 1989, ApJS, 71, 469
- Lombardi et al. (2011) Lombardi, S., Berger, K., Colin, P., et al., Proc. 32nd ICRC 2011 (arXiv:1109.6195)
- McClure-Griffiths & Dickey (2007) McClure-Griffiths, Dickey, J. M. 2007, ApJ, 671, 427
- Moralejo et al. (2009) Moralejo, A., Gaug, M., Carmona, E., et al., Proc. 31st ICRC 2009 (arXiv:0907.0943)
- Neronov & Semikoz (2010) Neronov, A., Semikoz, D. 2010, (arXiv:1011.0210v1)
- Nice et al. (2013) Nice, D. J. , Altiere, E., Bogdanov, S., et al. 2013, ApJ, 772, 50
- Paneque et al. (2011) Paneque, D., et al. 2011, Sources in the Fermi Sky Above 10 GeV, Rome
- Reimer et al. (2006) Reimer, A., Pohl, M., Reimer, O. 2006, ApJ, 644, 1118
- Roman-Duval et al. (2009) Roman-Duval, J., Jackson, J. M., Heyer, M., et al. 2009, ApJ, 699, 1153
- Rousseau et al. (2012) Rousseau, R., Grondin, M.-H., Van Etten, A., et al. 2012, A&A, 544, A3
- Sault et al. (1995) Sault, R. J., Teuben, P. J., & Wright, M. C. H. 1995, ASPC, 77, 433
- Stil et al. (2006) Stil, J.M., Taylor, A.R., Dickey, J.M., et al. 2006, AJ, 132, 1158
- Urquhart et al. (2011) Urquhart, J. S., Morgan, L. K., Figura, C. C., et al. 2011, MNRAS, 418, 1689
- Watson et al. (2003) Watson, C., Araya, E., Sewilo, M., et al. 2003, ApJ, 587, 714
Appendix A Multi-wavelength data
Here we provide a technical description of the multi-wavelength data used in section 4. The VGPS Hi data (Stil et al. 2006) consists of continuum images with angular resolution of and an rms noise of K, while the Hi line images also have an angular resolution of , a spectral resolution of km s-1 and an rms noise of K per channel ( km s-1). For the data, the GRS survey Jackson et al. (2006) employed a grid spacing of , and had an angular resolution of and a spectral resolution of km s-1, with rms noise of K. Finally, the m GLIMPSE data (Benjamin et al. 2003) has arcsecond-scale resolution.
Appendix B Avergae emission
Figure 6 shows Galactic longitude-velocity and latitude-velocity plots of emission in the direction of a possible gas cavity that is discussed in Section 4.