Accretion onto planetary mass companions of low-mass young stars
Abstract
Measurements of accretion rates onto planetary mass objects may distinguish between different planet formation mechanisms, which predict different accretion histories. In this Letter, we use HST/WFC3 UVIS optical photometry to measure accretion rates onto three accreting objects, GSC06214-00210 b, GQ Lup b, and DH Tau b, that are at the planet/brown dwarf boundary and are companions to solar mass stars. The excess optical emission in the excess accretion continuum yields mass accretion rates of to /yr for these three objects. Their accretion rates are an order of magnitude higher than expected from the correlation between mass and accretion rates measured from the UV excess, which is applicable if these wide planetary mass companions formed by protostellar core fragmentation. The high accretion rates and large seperation from the central star demonstrate the presence of massive disks around these objects. Models for the formation and evolution of wide planetary mass companions should account for their large accretion rates. High ratios of H luminosity over accretion luminosity for objects with low accretion rates suggest that searches for H emission may be an efficient way to find accreting planets.
Subject headings:
stars: pre-main sequence — planetary systems: protoplanetary disks — stars: low-mass, brown dwarfs — accretion, accretion disks1. INTRODUCTION
In recent years, many young objects with planetary masses have been directly imaged at distances of tens to a few hundred AU from the central star (e.g. Neuhäuser et al., 2005; Itoh et al., 2005; Kraus et al., 2008; Marois et al., 2008; Kraus & Ireland, 2012; Quanz et al., 2013). The formation of these planetary mass companions may occur by planetary core formation followed by vigorous gas accretion, by gravitational instabilities within the disk, or by uneven fragmentation of the collapsing protostellar core. These formation mechanisms each predict different accretion histories, which lead to different contraction timescales and luminosities at ages Myr (Spiegel & Burrows, 2012; Mordasini, 2013). Since younger objects are brighter and therefore more easily detected, the uncertain formation and accretion history leads to significant uncertainties in derived masses of directly imaged exoplanets.
If very low mass companions have similar disk fractions as solar mass stars and have accretion rates that are expected for their mass, then their formation may be consistent with the low-mass tail of the IMF resulting from protostellar core fragmentation. A similar approach established that free floating brown dwarfs likely form by the collapse of a protostellar core, similar to solar mass stars (e.g. White & Basri, 2003; Muzerolle et al., 2003; Mohanty et al., 2005; Joergens et al., 2013). On the other hand, planetary mass objects that form by core accretion or by disk gravitational instabilities may have different accretion and disk properties. Core accretion models for giant planet formation predict that for a few Myr, the accretion rates of planetary companions should be very large and may even dominate the flux for a few Myr (Spiegel & Burrows, 2012; Mordasini, 2013).
Previously, accretion has been detected onto two very low mass companions of solar mass stars based on emission in the Paschen- line (e.g. Seifahrt et al., 2007; Bowler et al., 2011; Bonnefoy et al.., 2013). The line luminosities may then be converted to accretion rate using established correlations (Natta et al., 2006), however the uncertainties and scatter in the correlations introduce significant uncertainties in the resulting accretion rates, especially beyond the mass accretion rate regime over which the correlation was calculated. In this Letter, we use broadband optical HST/WFC3 photometry to directly measure the accretion rate of very low-mass companions to the pre-main sequence stars GSC 06214-00210, GQ Lup, and DH Tau. The accretion luminosity is measured directly from the excess line and continuum emission, following the approach of Herczeg & Hillenbrand (2008). The use of photometry to obtain accretion rates is similar to the approach of Hartmann et al. (1998) and White & Ghez (2001).
| WFC3 | Mag | Fluxa | Error | |
|---|---|---|---|---|
| Filter | s | (erg cm-2 s-1) | ||
| GSC6214-210 b | ||||
| F336W | 2400 | 21.9 | 5.55E-18 | 1.4% |
| F390W | 480 | 22.1 | 8.16E-18 | 1.6% |
| F475W | 320 | 21.9 | 4.23E-18 | 5.5% |
| F555W | 240 | 22.3 | 4.62E-18 | 6.2% |
| F625W | 140 | 20.8 | 1.13E-17 | 3.2% |
| (F625W)b | 21.3 | 7.33E-18 | 3.2% | |
| F656N | 2380 | 15.7 | 7.08E-16 | 0.35% |
| F673N | 800 | 21.5 | 4.66E-18 | 7.2% |
| F775W | 80 | 20.2 | 1.05E-17 | 2.9% |
| F850LP | 50 | 18.4 | 3.32E-17 | 2.0% |
| -4.65 | ||||
| -5.03 | ||||
| EWHα | Å | |||
| GQ Lup b | ||||
| F336W | 400 | 19.2 | 6.77E-17 | 1.6% |
| F390W | 50 | 20.1 | 5.42E-17 | 2.0% |
| F475W | 40 | 20.0 | 2.61E-17 | 5.2% |
| F555W | 30 | 20.2 | 3.19E-17 | 3.5% |
| F625W | 20 | 18.9 | 6.88E-17 | 8.0% |
| (F625W) | 19.2 | 5.03E-17 | 8.9% | |
| F656N | 250 | 15.9 | 5.92E-16 | 3.9% |
| F673N | 160 | 19.0 | 4.84E-17 | 15.3% |
| F775W | 40 | 17.8 | 9.60E-17 | 2.9% |
| F850LP | 20 | 16.2 | 2.75E-16 | 1.8% |
| -2.91 | ||||
| -4.69 | ||||
| EWHα | Å | |||
| DH Tau b | ||||
| F336W | 1400 | 24.2 | 6.90E-19 | 30% |
| F390W | 360 | 24.9 | 6.62E-19 | 20% |
| F475W | 280 | 24.3 | 4.85E-19 | 9.0% |
| F555W | 160 | 24.5 | 5.98E-19 | 7.2% |
| F625W | 100 | 23.0 | 1.51E-18 | 5.7% |
| (F625W) | 23.1 | 1.35E-18 | 6.6% | |
| F656N | 1200 | 19.0 | 3.48E-17 | 3.4% |
| F673N | 500 | 23.0 | 1.23E-18 | 21% |
| F775W | 80 | 20.2 | 1.07E-17 | 2.7% |
| F850LP | 40 | 18.0 | 5.16E-17 | 1.8% |
| -5.40 | ||||
| -6.19 | ||||
| EWHα | Å | |||
| aObserved fluxes not corrected for extinction. | ||||
| Listed luminosities are corrected for extinction. | ||||
| b F625W fluxes in () are fluxes with H | ||||
| emission subtracted. | ||||
| Object | Sep. (′′) | PA (deg) | d (pc) | (K) | () | Ref. | |||||
| GSC 06214 | 0.2 | 2700 | 14 | -4.7 | -11.0 | 1 | |||||
| -00210 b | 2200 | -3.16 | 15 | -4.6 | -10.8 | - | |||||
| GQ Lup b | 1.5 | -2.25 | 6.5 | 24 | -2.9 | -9.3 | 2,3 | ||||
| 2400 | -2.24 | 31 | -2.9 | -9.3 | - | ||||||
| DH Tau b | 0.7 | -2.70 | 11 | -5.4 | -11.5 | 2,4 | |||||
| 2200 | -2.82 | 11 | -5.3 | -11.3 | - | ||||||
| For each object, the first line refers to literature , , , and . The second line is measured here. | |||||||||||
| The and are measured for the photospheric parameter corresponding to each line. | |||||||||||
| For a description of the uncertainty in see §3 | |||||||||||
| References: (1)Bowler et al. (2011) (2)Patience et al. (2012), (3)Seifahrt et al. (2007), (4)Itoh et al. (2005) | |||||||||||
2. OBSERVATIONS
We used HST/WFC3 UVIS2 to obtain optical photometry of GQ Lup b on 25 Feb. 2012, GSC 06214-00210 b on 22 Feb 2012, and DH Tau b on 22 Jan 2012 in HST program GO 12507 (P.I. A. Kraus). The high spatial resolution of HST is typically needed to resolve the compnents at optical wavelengths. The reduced and flatfielded images were downloaded from the MAST archive for analysis. The observation log and extracted fluxes are listed in Table 1.
2.1. Sample Selection and Properties
The total dataset consists of optical imaging of the 12 planetary mass companions to young solar mass stars that had been identified as of Feb. 2011, when the proposal was submitted. In this paper, we analyze three objects, GQ Lup b (Neuhäuser et al., 2005), GSC 06214-00210 b (Kraus et al., 2008), and DH Tau b (Itoh et al., 2005), that show excess emission in H and in the U-band. A subsequent paper will describe the full sample. Emission in Pa, an accretion diagnostic, has previously been detected from GSC 06214-00210 b and DH Tau b (Bowler et al., 2011; Bonnefoy et al.., 2013). Pa emission was detected in one of three near-IR spectra of GQ Lup b (Seifahrt et al., 2007; McElwain et al., 2007; Lavigne et al., 2009).
The properties of the three planetary mass companions are listed in Table 2. The extinctions of the companion are assumed to be equal to that of the primary. The extinctions to the accreting stars GQ Lup and DH Tau are calculated from optical spectra by Herczeg & Hillenbrand (2014). The extinction to the non-accreting star GSC06214-210 is calculated here from the R-J color. Extinction curves applied here assume (Fitzpatrick & Massa, 1990). The distances and ages of GSC06214-00210, GQ Lup and DH Tau are assumed to be that of their parent clouds: Upper Sco OB Association at 145 pc (de Zeeuw et al., 1999) and 5–12 Myr (Preibisch et al., 2002; Pecaut et al., 2012), Lupus 1 at 155 pc (Lombardi et al., 2008) and 3 Myr (Alcala et al., 2014), and Taurus at 145 pc (Torres et al., 2009) and 1–2 Myr (e.g. Luhman, 2004), respectively. The listed separations and position angles are calculated from the median of our measurements for each filter with the plate scale of 0.040 arcsec/pixel.
2.2. Source Extraction
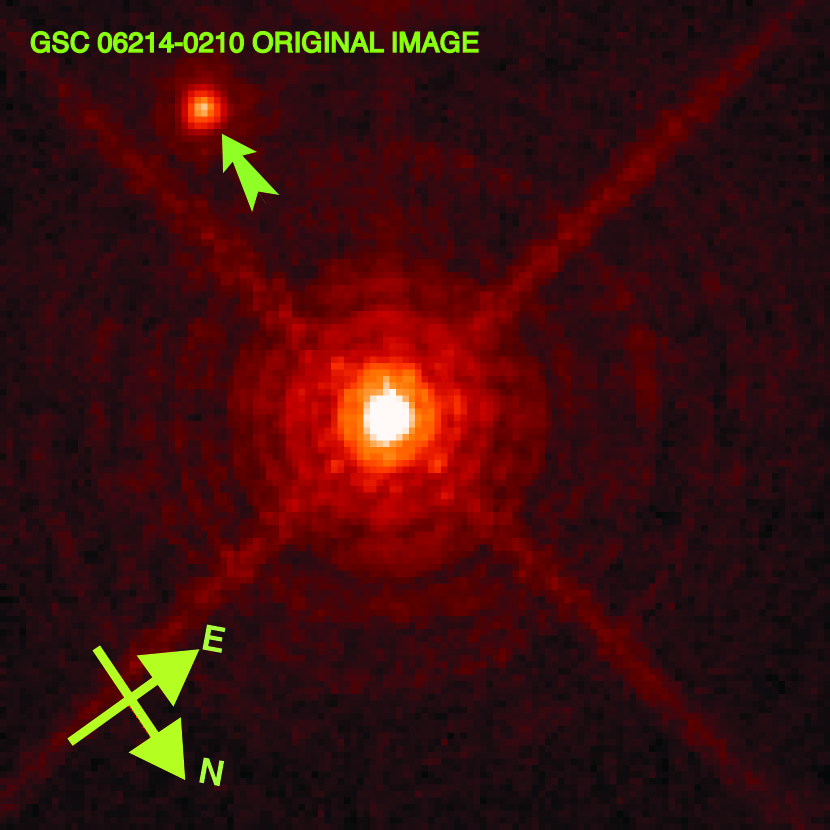
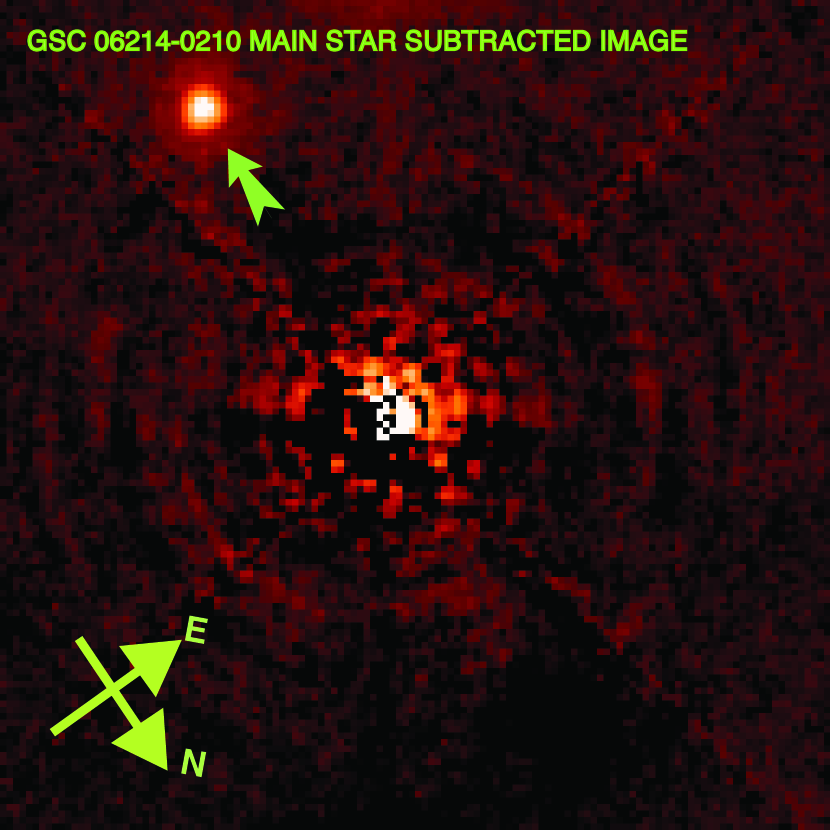
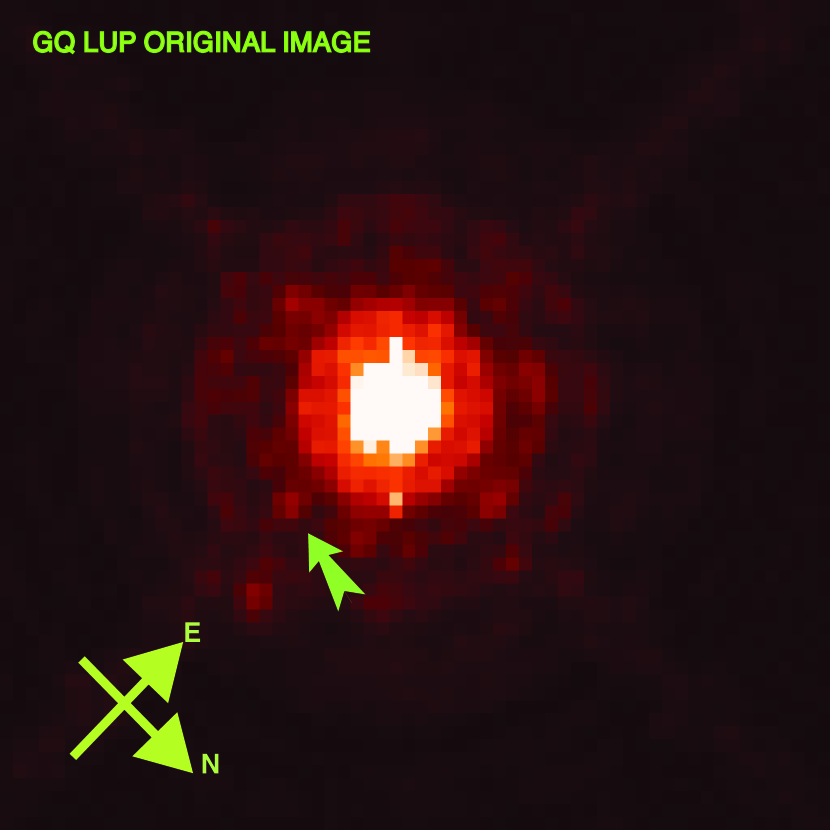
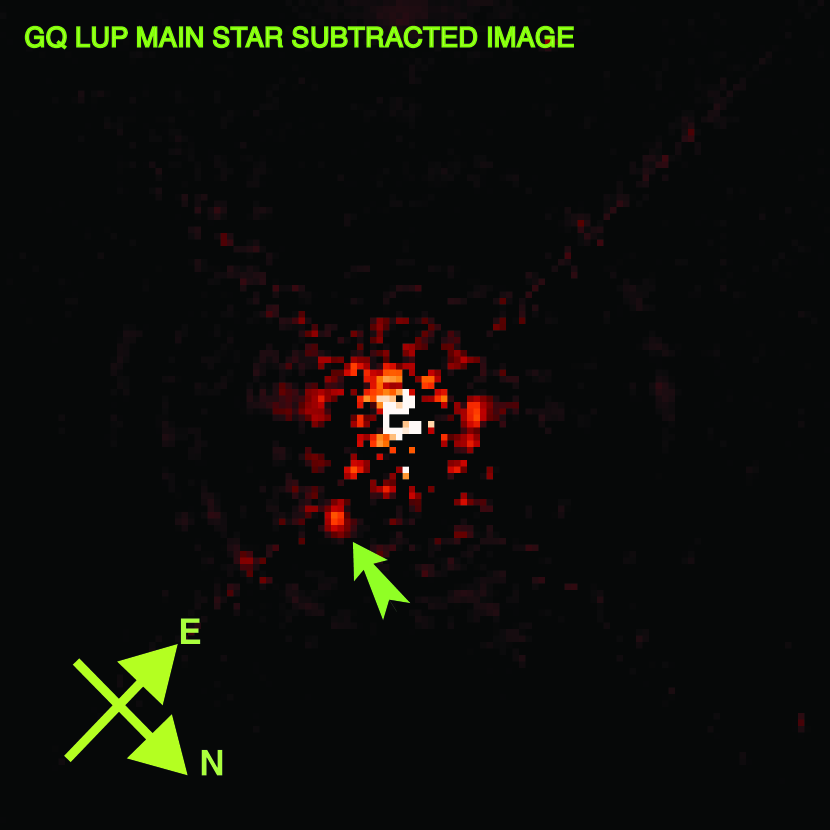
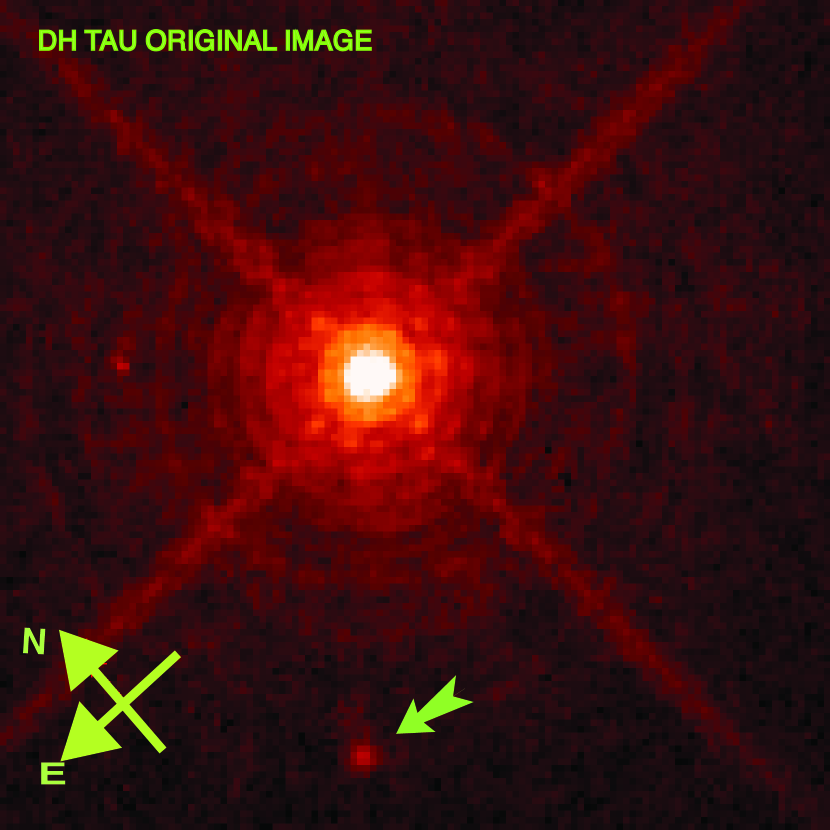
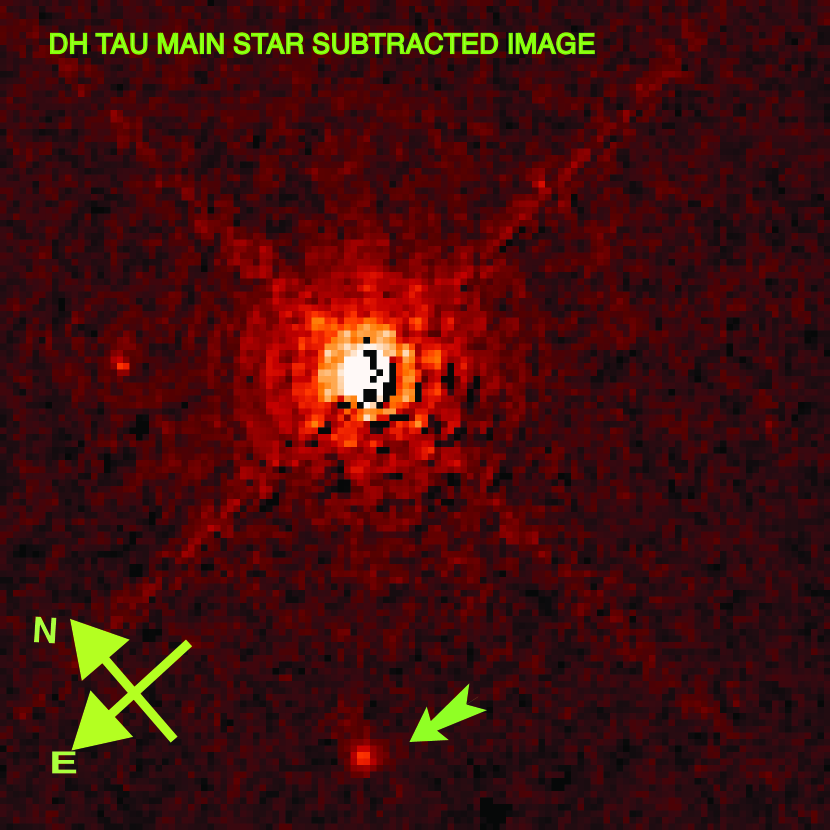
The images consist of bright emission from the primary star and faint emission from the companion. Isolated stars in the field are used to synthesize a template point spread function (psf) in each image. For the GSC 06214-00210 images obtained with the F656N, F673N, F850LP filters, the template psf is first scaled to the primary and subtracted from the image, leaving only the faint companion. For other images of GSC 06214-00210 A and all the images of GQ Lup A and DH Tau A, the primary stars are heavily saturated and poorly fit with the template. The saturated spot is assumed to be symmetric about the x and y axis and rotate the stellar image to subtract out the primary. Fig. 1 demonstrates our psf subtraction for the F656N observations of all three objects.
After the primary flux is subtracted, the flux in the secondary
component measured by fitting the spot with the template psf. The
template brightness was measured from aperture photometry and
converted to a flux based on the aperture correction and flux
conversion listed in the WFC3
manual111http://www.stsci.edu/hst/wfc3/documents/handbooks/
currentIHB/c06_uvis07.html#391868.
The extraction apertures have radii as large as 30 pixels ()
pixels for images with bright secondaries well separated from the
primary, to as little as 3 pixels () for faint images. The
fluxes of the psfs are then corrected by applying the flux-aperture radius curve
from the WFC3 manual.
The photometry of the companion is then calculated by fitting the psf template to the image of the companion. GQ Lup b and GSC06214-0210 b are located close to the diffraction spikes, which are avoided in the 2D fits to the image. The uncertainties are calculated from statistical error and fluctuation of the background in an annular region around the primary star.
The final photometric results and uncertainties are listed in Table 1. The H fluxes are calculated by convolving a flux above the model fit with the filter transmission curve to obtain the measured flux. The approximate equivalent widths are calculated by dividing the measured H flux by the average flux in the F625W and F673N filters.
A faint object is detected in only the F656N image of DH Tau, with flux of ergs/cm2/s/Å, a separation of and a position angle of 46.37∘ to relative to the primary star. This object has upper limits of and ergs/cm2/s/Å in the F775W and F850LP filters. A faint object is also found at a similar relative position to DI Tau in the same image, indicating that both detections are likely artifacts.
3. Results
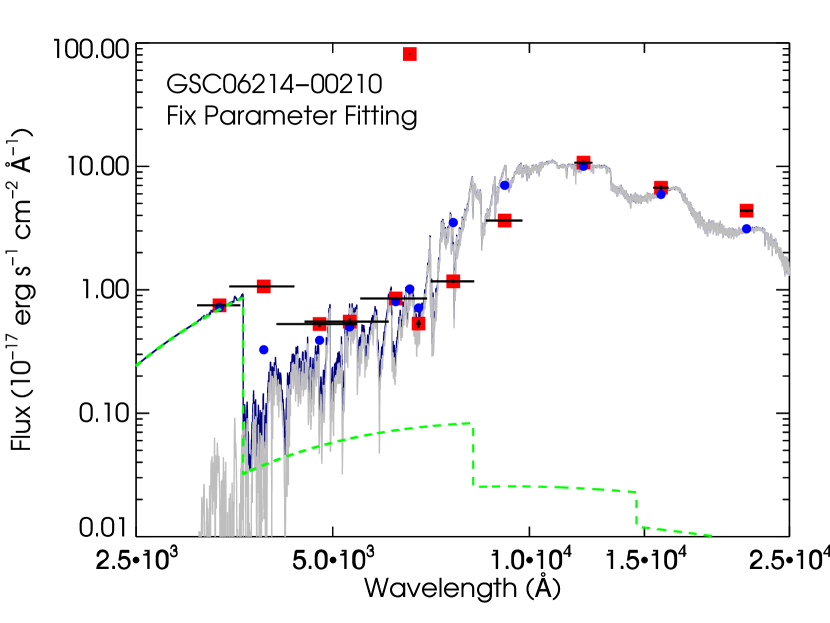
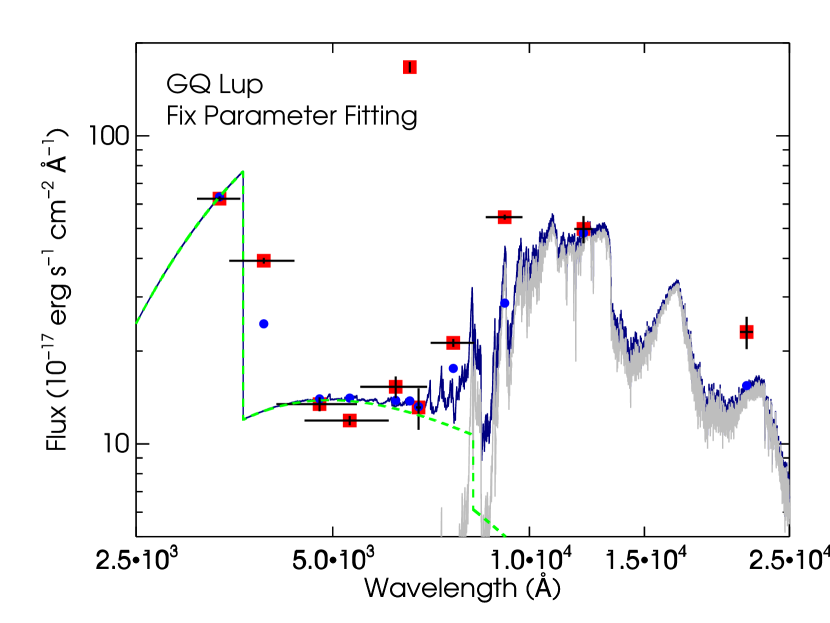
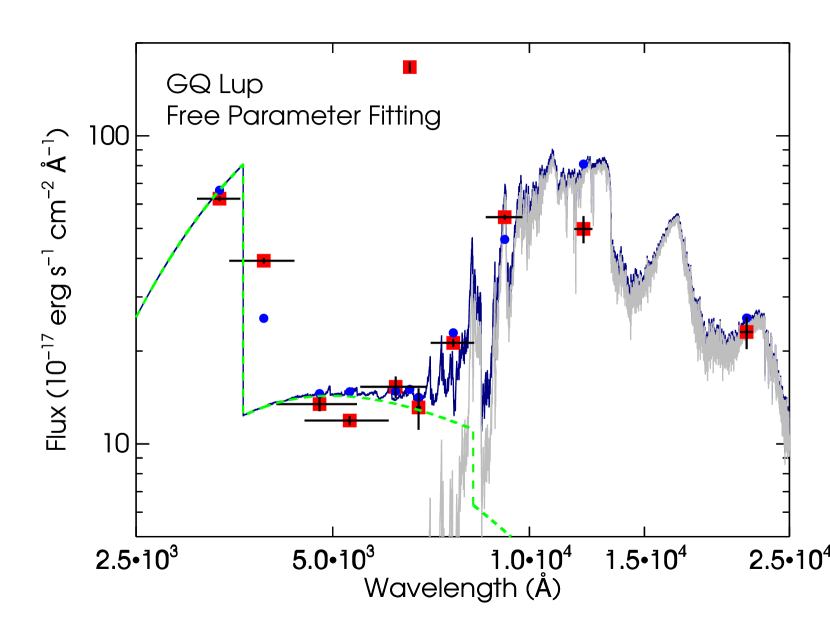
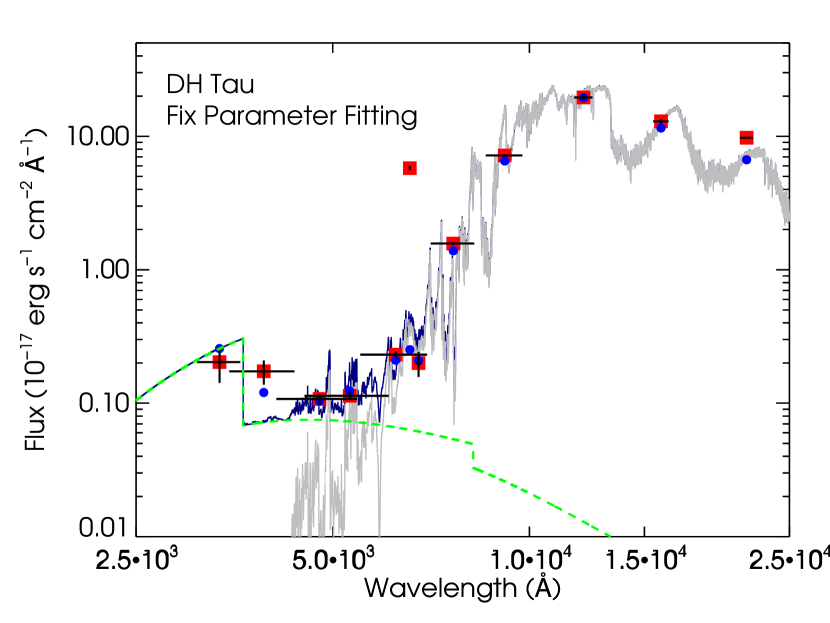
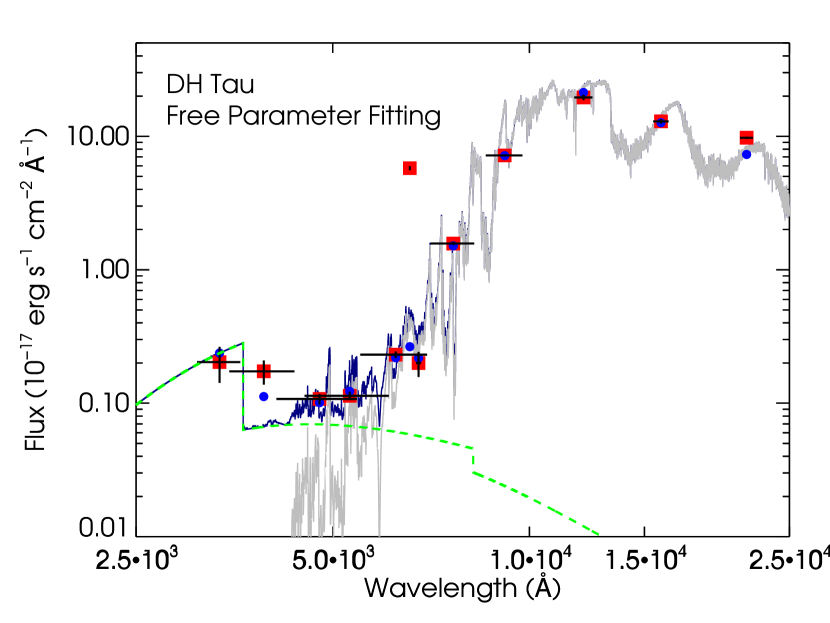
Fig. 2 shows our optical photometry combined with JHK photometry of GQ Lup and DH Tau from Patience et al. (2012) and GSC0 6214-00210 from Bowler et al. (2011). The sources are all brightest at red wavelengths, as expected for very low mass sources. However, the optical fluxes are relatively flat with wavelength, and higher in the F330W and F390W filters than at longer wavelengths. The emission in the narrow-band F656N filter is much brighter than the nearby spectral regions because of H emission, which also contributes 10%, 25%, and 77% of the photons in the broad-band F625W filter for GQ Lup, FW Tau, and GSC 06214-0210, respectively.
The spectrophotometry is explained as the combination of a photosphere from a very low mass object and an accretion spectrum. Accretion is characterized by excess optical emission in the H Paschen continuum, a stronger excess in the H Balmer continuum shortward of 3700 Å, and strong emission in H lines (see, e.g., Calvet & Gullbring, 1998; Herczeg et al., 2009). The brightness of emission in the F330W filter is interpreted as the excess Balmer continuum emission. Emission in high Balmer lines and Ca II H & K likely explains the bright emission in the F390W filter, relative to longer wavelengths. Other optical lines may be strong enough to contaminate emission in other filters (e.g. Bowler et al., 2014), but are assumed to be negibible. In particular, the F673N filter is consistent with expectations of the photospheric flux, indicating at most a minimal contribution from the [S II] 6725 Å doublet.
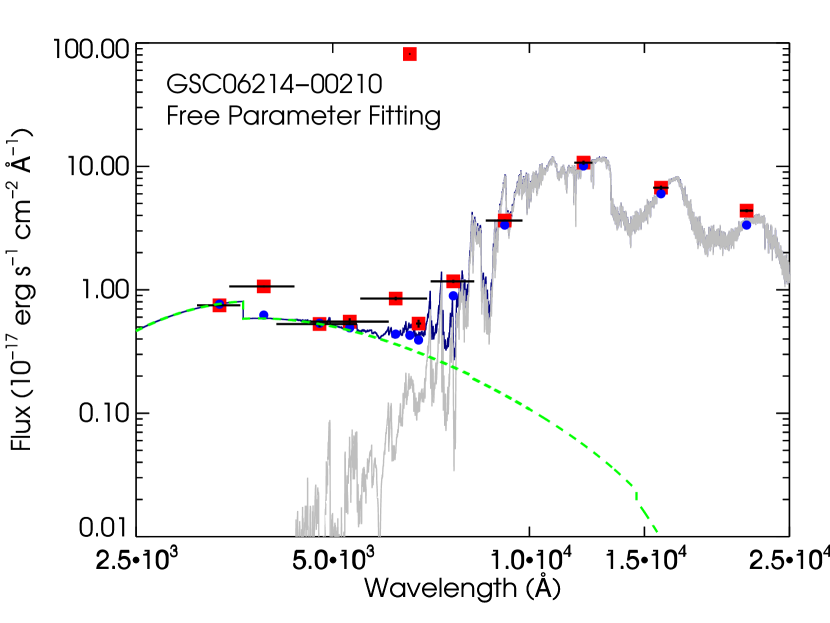
The photometry is modeled as the sum of the object photosphere and an accretion spectrum. Synthetic photometry for the photosphere is obtained from the BT-Settl grid with CIFIST opacities (Allard et al., 2012). The accretion spectrum is assumed to be flat, in erg cm-2 s-1 Å-1, with wavelength for all filters longer than 4000 Å, following Herczeg & Hillenbrand (2014). The bolometric correction to convert the excess accretion continuum is calculated from the pure hydrogen slab models developed by Valenti et al. (1993). These slab models are less physically realistic than shock models (Calvet & Gullbring, 1998; Ingleby et al., 2013), but both approaches provide similar bolometric corrections to obtain the final accretion luminosity.
These model spectra are then combined to reproduce the combined optical/near-IR photometry using fits with two different methods. In the first set of fits, the photospheric luminosities are fixed using JHK photometry and effective temperatures are fixed to the values obtained from near-IR spectra (Table 2). The only free parameter is the excess luminosity of the slab. In the second set of fits, the temperature, photospherivc luminosity, and excess accretion luminosity are all treated as free parameters. The best fit effective temperatures and luminosities are listed in Table 2. Radii and the photospheric luminosities of the three object are calculated by scaling the BT-Settl synthetic spectra to the observed SED. The uncertainty in radius is derived from the uncertainties in extinction and distance. The range in acceptable mass is set by fitting with pre-main sequence evolution model following Fig.5 in Bowler et al. (2011).
The spectral fits to DH Tau b and GSC 06214-0210 b are well matched to most of the observed photometric points. Possible K band excesses of 0.3-0.4 mag. could be explained by emission from the warm disk, similar to the L-band excess around GSC 06214-00210 (Ireland et al., 2011). Alternatively, young substellar and planetary mass objects tend to be systematically redder than model spectra because of the gravity dependence of dust grain sizes and the height of clouds (e.g. Marley et al., 2012).
The J-band and F850LP photometry of GQ Lup b have similar fluxes, which is not expected from very cool objects and is poorly fit with the model spectra. In fits with luminosity and temperature as free parameters, no K-band excess is detected by the J-band flux is severely overestimated by the models. This discrepancy is unlikely to be explained by excess line emission in the F850LP filter, because in that case more lines would have been detected in the near-IR spectra. Large photometric variability is often detected in accreting T Tauri stars (e.g. Herbst et al., 1994) and may affect the non-simultaneous comparison between the optical and near-IR photometry. The small separation between GQ Lup A and its companion makes the primary star subtraction challenging and could introduce photometric errors.
The effective temperatures measured here differ by a few hundred K from the litearture values. The fits of synthetic spectra to near-IR spectra (Patience et al., 2012, e.g.) should yield more accurate temperatures than our fits to optical+near-IR photometry. However, both temperatures are listed in case the depth of molecular bands is affected by low gravity in ways that are not yet accounted for in the models, in which case broadband SED fits would yeild better temperatures. Spectral features may be weakened by any veiling from the disk in the K-band and, for GQ Lup, possible J-band veiling from the accretion flow. Accretion luminosities and rates are similar for both approaches and are listed separately in Table 1.
The total accretion luminosity, is calculated by adding excess continuum emission from the slab, and the excess line emission, in this case H, . The contribution of line emission to accretion rate measurements has been ignored in all previous publications. Following Gullbring et al. (1998), the accretion rate is obtained by
| (1) |
The accretion luminosities and rates are listed in table 1. The extinction uncertainty, here assessed as mag., dominates the factor of uncertainty in accretion luminosity. The factor of 3–5 uncertainty in accretion rate includes uncertainties in the radius and temperature. A detailed description of errors is discussed in Herczeg & Hillenbrand (2008). The uncertainty in extinction measurements introduces large errors in accretion luminosity and rate. For GQ Lup b, an assumed extinction of mag. would yield and .
4. Discussion
Accretion is detected in both the H line and in excess optical continuum emission from DH Tau b, GSC 06214-00210 b, and GQ Lup b. Accretion had been previously detected for all three objects in Pa emission, although this emission was undetected in some spectra of GQ Lup b. For GSC 06214-00210 b, the accretion luminosity measured here (when including H luminosity) of is similar to the measured from Pa by Bowler et al. (2011), although our direct measurements have much smaller error bars.
The accretion rates calculated here demonstrate that these objects have their own disks. The separations (100–300 AU) of the companion objects to their primaries are too large to support such high accretion rates. Moreover, there is no evidence to indicate the presence of a primordial disk around the primary star GSC 06214-00210.
These sources are at the brown dwarf-planet mass boundary, are among the lowest mass sources with accretion measured directly from excess optical spectra, and are the lowest mass companions to stellar primary stars with measured accretion rates. Previous detections of accretion onto very low mass objects has been diagnosed through emission lines (e.g. Bowler et al., 2011; Joergens et al., 2013), which are indirect probes of accretion rate, and directly from the Balmer jump for several free-floating brown dwarfs (e.g. Herczeg et al., 2009; Rigliaco et al., 2012).
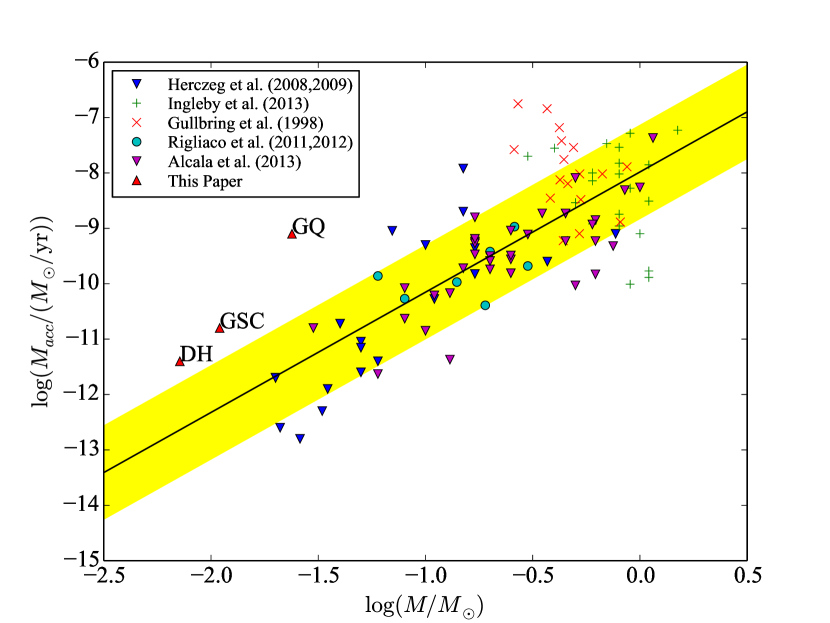
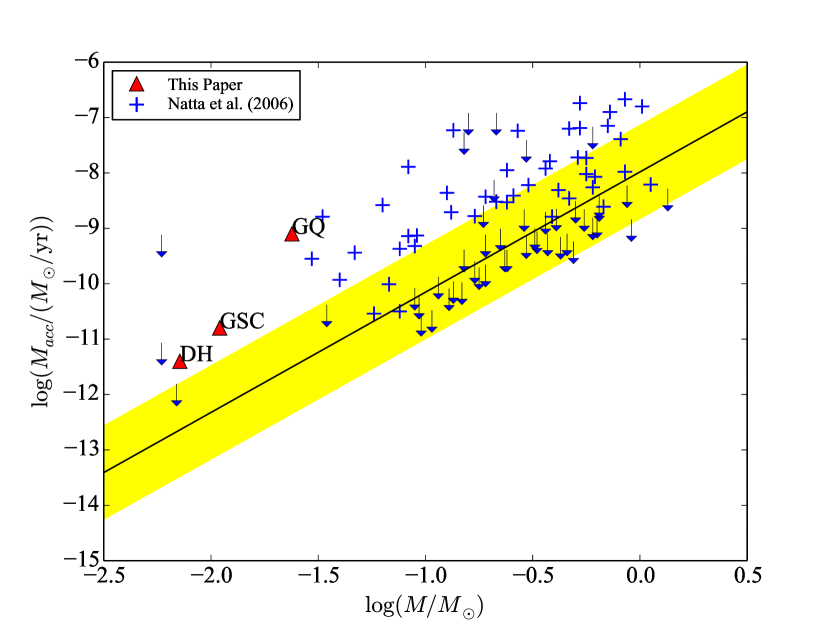
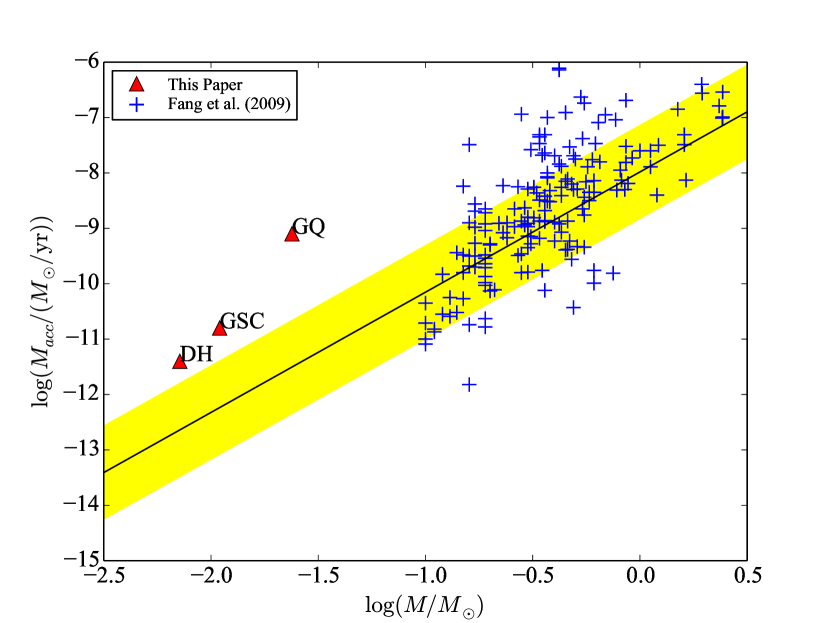
Figure 3 shows correlations between mass and accretion rate, as measured directly from excess Balmer continuum emission and indirectly from line luminosities. The accretion rates measured here are more than one order of magnitude higher than expected from the correlations obtained for accretion rates measured directly from excess Balmer continuum emission (Gullbring et al., 1998; Herczeg & Hillenbrand, 2008; Herczeg et al., 2009; Rigliaco et al., 2011, 2012; Ingleby et al., 2013; Alcala et al., 2014) and separately for accretion rates measured indirectly from optical lines (Fang et al., 2009). This offset is not detected when comparing our accretion rates to those measured for stars in Oph from Pa and Br (Natta et al., 2006). However, the Oph accretion rates at low object mass are anomalous relative to other studies, either because the objects are younger or because of methodological differences. Moreover, half of the stars in Oph with disks have only upper limits in accretion luminosity. While differences in ages can complicate these comparisons, the high accretion rates are consistent with literature values only if the objects have the same age as Oph and are therefore younger than the stars in their parent associations. Although upper limits of our non-detections should be considered, our program was complete for every known planetary mass companion at the time of proposal submission and these three objects are all high outliers in accretion rate.
These results suggest that wide planetary mass companions have higher accretion rates than expected for objects formed from the fragmentation of a protostellar core. If correct, then models for their formation and evolution models for the formation and evolution should account for these high accretion rates and the survival of their disks. Since core accretion is unlikely to form planets at such large radii in the disk, the systematically high accretion rates suggests either formation by gravitational instability or different disk evolution between single planetary mass objects/brown dwarfs versus those around stellar mass objects.
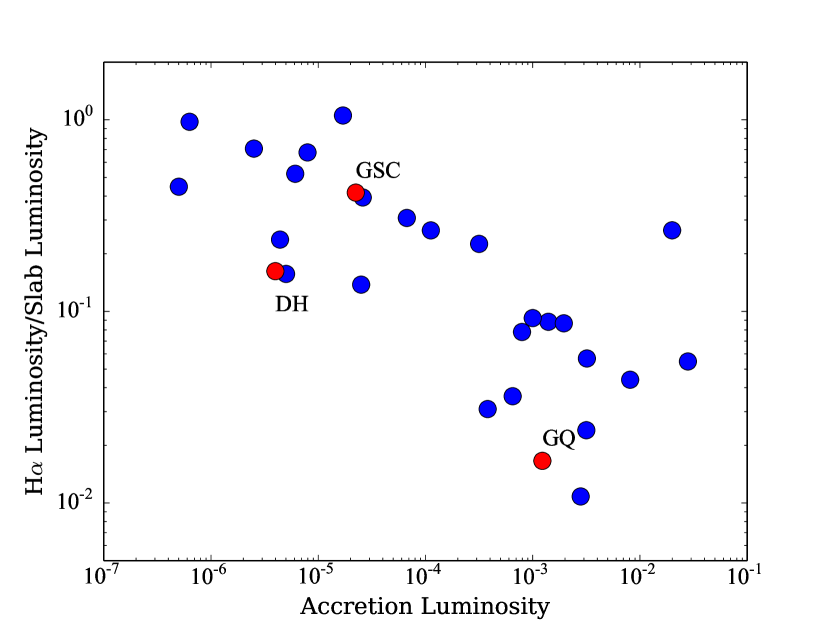
In previous studies, the accretion rate has been calculated from only the luminosity from the continuum emission. The H luminosity is usually negligible for solar mass stars. For GQ Lup b and DH Tau b, the H luminosity is 5% of the accretion continuum luminosity. However, for GSC 06214-0210 b, H luminosity is equivalent to the total slab luminosity and accounts for 50% of the total accretion luminosity. Fig. 3 shows the ratio of H luminosity to accretion continuum luminosity from our work and from literature values (Herczeg & Hillenbrand, 2008; Herczeg et al., 2009; Rigliaco et al., 2011, 2012), when measured simultaneously. The percentage of accretion luminosity that escapes in H increases with lower accretion luminosities, possibly because of lower opacities and temperatures in the accretion shock and accretion funnel flow. Especially for low-mass objecst with high ratios, the accretion luminosities may be underestimated if Ly is significantly brighter than H. Unfortunately, Ly emission from CTTSs is difficult to observe because of line-of-sight H I absorption (Schindhelm et al., 2012). Indeed, the one high point in among solar mass stars is TW Hya, which has an Ly luminosity of , or 0.5 and 2 (Herczeg et al., 2004).
The strength of H emission suggests an alternate method to search for forming protoplanets. The accretion continuum is spread over a large wavelength region, so the contrast between the primary and an accreting secondary star is still high. However, if 10-50% of the accreting flux is produced in a single line, then the contrast between the star and any accreting companion becomes much smaller. Targeted searches for H emission from companions may be a powerful technique to find proto-Jupiters that are undergoing their main phase of gas accretion. Indeed, Close et al. (2014) recently used the new Magellan Adaptive Optics system to detect H emission and calculate accretion onto the faint companion around HD 142527.
acknowledgements
We thank the anonymous referee for useful suggestions that helped to clarify our analysis and results. GJH is supported by the Youth Qianren program in China. Based on observations associated with HST GO program 12507 and made with the NASA/ESA Hubble Space Telescope, obtained at STScI, which is operated by AURA, Inc., under NASA contract NAS 5-26555.
References
- Alcala et al. (2014) Alcala, J.N., Natta, A., Manara, C.F., et al. 2014, A&A, 561, 2
- Allard et al. (2012) Allard, F., Homeier, D., & Freytag, B. 2012, Royal Society of London Philosophical Transactions Series A, 370, 2765
- Bonnefoy et al.. (2013) Bonnefoy, M., Chauvin, G., Lagrange, A.-M., et al. 2013, A&A, accepted. astro-ph://1306.3709
- Bowler et al. (2011) Bowler, B.P., Liu, M.C., Kraus, A.L., Mann, A.W., & Ireland, M.J. 2011, ApJ, 743, 148
- Bowler et al. (2014) Bowler, B.P., et al. 2014, FW Tau paper
- Calvet & Gullbring (1998) Calvet, N., & Gullbring, E. 1998, ApJ, 509, 802
- Close et al. (2014) Close, L., Follette, K.B., Males, J.R., Puglisi, A., Xompero, M., Apai, D., et al. ApJL, accepted, astro-ph://1401.1273
- Comeron (2008) Comeron, F. 2008, in The Lupus Clouds, Handbook of Star Forming Regions, Vol. II, ed. B. Reipurth (San Francisco, CA: ASP), 295
- de Zeeuw et al. (1999) de Zeeuw, P.T., Hoogerwerf, R., de Bruijne, J.H.J., Brown, A. G. A., Blaauw, A., 1999, AJ, 117, 354
- Fang et al. (2009) Fang, M., van Boekel, R., Wang, W., Carmona, A., Sicilia-Aguilar, A., & Henning, Th. 2009, A&A, 504, 461
- Fitzpatrick & Massa (1990) Fitzpatrick, E.L., & Massa, D. 1990, ApJS, 72, 163
- Gullbring et al. (1998) Gullbring, E., Hartmann, L., Briceno, C., & Calvet, N. 1998, ApJ, 492, 323
- Hartmann et al. (1998) Hartmann, L., Calvet, N., Gullbring, E., & D’Alessio, P. 1998, ApJ, 495, 385
- Herbst et al. (1994) Herbst, W., Herbst, D.K., Grossman, E.J., & Weinstein, D. 1994, AJ, 108, 1906
- Herczeg et al. (2004) Herczeg, G.J., Wood, B.E., Linsky, J.L., Valenti, J.A., & Johns-Krull, C.M. 2004, ApJ, 607, 369
- Herczeg & Hillenbrand (2008) Herczeg, G.J., & Hillenbrand, L.A. 2008, ApJ, 681, 594
- Herczeg et al. (2009) Herczeg, G.J., Cruz, K.L., & Hillenbrand, L.A. 2009, ApJ, 696, 1589
- Herczeg & Hillenbrand (2014) Herczeg, G.J., & Hillenbrand, L.A. 2014, ApJ, submitted
- Ingleby et al. (2013) Ingleby, L., Calvet, N., Herczeg, G., et al. 2013, ApJ, 767, 112
- Ireland et al. (2011) Ireland, M.J., Kraus, A., Martinache, F., et al. 2011, ApJ, 726, 113
- Itoh et al. (2005) Itoh, Y., Hayashi, M., Tamura, M., et al. 2005, ApJ, 620, 984
- Joergens et al. (2013) Joergens, V., Bonnefoy, M., Liu, Y., et al. 2013, A&A, 558, L7
- Kraus et al. (2008) Kraus, A.L., Ireland, M.J., Martinache, F., & Lloyd, J.P. 2008, ApJ, 679, 762
- Kraus & Ireland (2012) Kraus, A.L., & Ireland, M.J. 2012, ApJ, 745, 5
- Lavigne et al. (2009) Lavigne, J.-F., Doyon, R., Lafreniere, D., Marois, C., & Barman, T. 2009, ApJ, 704, 1098
- Loinard et al. (2007) Loinard, L., Torres, R.M., Mioduszewski, A.J., Rodriguez, L.F., Gonzalez-Lopezlira, R.A., Lachaume, R., Vazquez, V., & Gonzalez, E. 2007, ApJ, 671, 546
- Lombardi et al. (2008) Lombardi, M., Lada, C.J., Alves, J. 2008, A&A, 489, 143
- Luhman (2004) Luhman, K.L. 2004, ApJ, 617, 1216
- Marois et al. (2008) Marois, C., Macintosh, B., Barman, T., et al. 2008, Science, 322, 1348
- Marley et al. (2012) Marley, M.S., Saumon, D., Cushing, M., Ackerman, A.S., Fortney, J.J., Freedman, R. 2012, ApJ, 754, 135
- Mordasini (2013) Mordasini, C. 2013, A&A, 558, 113
- McElwain et al. (2007) McElwain, M.W., Metchev, S.A., Larkin, J.E., et al. 2007, ApJ, 656, 505
- Muzerolle et al. (2003) Muzerolle, J., Hillenbrand, L., Calvet, N., Briceno, C., & Hartmann, L. 2003, ApJ, 592, 266
- Mohanty et al. (2005) Mohanty, S., Jayawardhana, R., & Basri, G. 2005, ApJ, 626, 498
- Natta et al. (2006) Natta, A., Testi, L., & Randich, S. 2006, A&A, 452, 245
- Neuhäuser et al. (2005) Neuhäuser, R., Guenther, E.W., Wuchterl, G., Mugrauer, M., Bedalov, A., & Hauschildt, P.H. 2005, A&A, 435, 13
- Patience et al. (2012) Patience, J., King, R.R., De Rosa, R.J., et al. 2012, A&A, 540, 85
- Pecaut et al. (2012) Pecaut, M.J., Mamajek, E.E., & Bubar, E.J. 2012, ApJ, 746, 154
- Preibisch et al. (2002) Preibisch, T., Brown, A.G.A., Bridges, T., Guenther, E., & Zinnecker, H. 2002, AJ, 124, 404
- Preibisch & Mamajek (2008) Preibisch, T., & Mamajek, E. 2008, in Handbook of Star Forming Regions, Vol. 2, The Southern Sky, ed. B. Reipurth (ASP Monograph Publications, Vol. 5; San Francisco, CA: ASP), 235
- Quanz et al. (2013) Quanz, S.P., Amara, A., Meyer, M.R., Kenworthy, M.A., Kasper, M., & Girard, J.H. 2013, ApJ, 766, L1
- Rigliaco et al. (2011) Rigliaco, E., Natta, A., Randich, S., et al. 2011, A&A, 526, 6
- Rigliaco et al. (2012) Rigliaco, E., Natta, A., Testi, L., et al. 2012, A&A, 548, 56
- Schindhelm et al. (2012) Schindhelm, E., France, K., Herczeg, G.J., et al. 2012, ApJ, 756, L23
- Spiegel & Burrows (2012) Spiegel, D.S., & Burrows, A. 2012, ApJ, 745, 174
- Valenti et al. (1993) Valenti, J.A., Basri, G., & Johns, C.M. 1993, ApJ, 106, 2024
- Seifahrt et al. (2007) Seifahrt, A., Neuhäuser, R., & Hauschildt, P.H. 2007, A&A, 463, 309
- Torres et al. (2009) Torres, R. M., Loinard, L., Mioduszewski, A. J., Rodrïuez, L. F., 2009, ApJ, 698, 242
- White & Ghez (2001) White, R.J., & Ghez, A.M. 2001, ApJ, 556, 265
- White & Basri (2003) White, R.J., & Basri, G. 2003, ApJ, 582, 1109