The Relation between the Radial Temperature Profile in the Chromosphere and the Solar Spectrum at Centimeter, Millimeter, Sub-millimeter, and Infrared Wavelengths
Abstract
Solar observations from millimeter to ultraviolet wavelengths show that there is a temperature minimum between photosphere and chromosphere. Analysis based on semi-empirical models locate this point at about 500 km over the photosphere. The consistency of these models has been tested by means of millimeter to infrared observations.
In the present work, we show that variations of the theoretical radial temperature profile near the temperature minimum impacts the brightness temperature at centimeter, submillimeter, and infrared wavelengths, but the millimeter wavelength emission remains unchanged. We found a region between 500 and 1000 km over the photosphere that remains hidden to observations at the frequencies under study in this work.
keywords:
Sun: chromosphere — Sun: radio radiation — Sun: infrared — methods: numerical — radiative transfer — stars: chromospheres1 Introduction
Compared to the solar radius, the chromosphere is a thin region in the upper solar atmosphere where, as a function of formation height, spectral lines (e.g., Ca ii and Mg ii) change from absorption to emission [Athay and Thomas (1961)]. Additionally, it has been found that molecular CO bands (between 2.1 and 15.5 m) and infrared, millimeter, and sub-millimeter continuum emission are produced in that region [Hagen (1957), Ayres (1978), Uitenbroek (2000), Avrett (2003)]. The standard interpretation of the solar radio emission (from meters to sub-millimeter waves) states that the main contributor to the emission is the Bremsstrahlung process in Local Thermodynamic Equilibrium (LTE) and predicts that the observed effective height of flux emission formation depends on frequency [Shibasaki, Alissandrakis, and Pohjolainen (2011)].
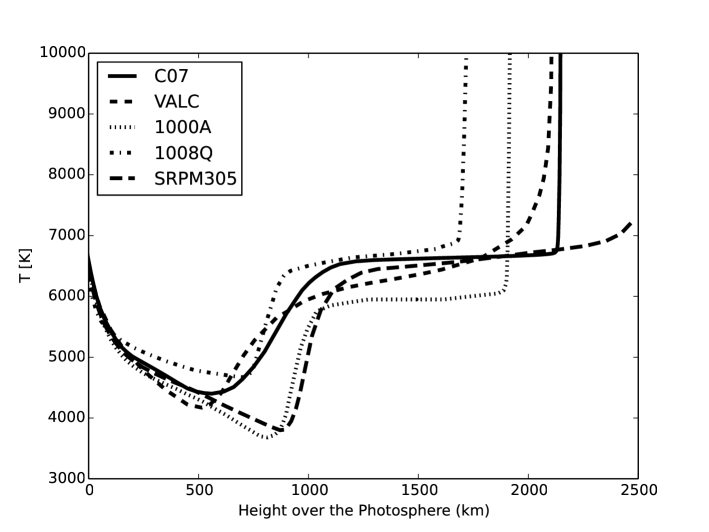
In general, semi-empirical models assume a one-dimensional approach to the physical conditions of the chromosphere. This category includes the models VALC from \inlinecite1981ApJS…45..635V, SRPM305 from \inlinecite2006ApJ…639..441F, C07 from \inlinecite2008ApJS..175..229A, and the cold [1000A], and hot [1008Q] models from \inlinecite2011JGRD..11620108F. These models provide the best theoretical fit so far achieved to the observed spectra and represent a good approximation because the horizontal scale is larger than the vertical scale of the elements under study [Fontenla et al. (2006)]. All models share a common feature: a region where the atmosphere reaches a temperature minimum, where the temperature gradient is inverted and the radial temperature increases gradually outward until the so-called Transition Region (Figure \irefminimumTemperatures2.eps). These 1D semi-empirical models show that radiation at low frequencies emerges from high atmospheric layers [Avrett and Loeser (2008)], indicating a close correlation between the observed brightness temperature () and the radial temperature profiles. Such a correlation has been observed not only in the Sun, but also in other stars [Liseau et al. (2013)]. Whilst the mentioned models provide the best representation of the high atmospheric layers, there are still significant inconsistencies between observed brightness temperature () and synthetic spectra at millimeter-IR regimes [Vernazza, Avrett, and Loeser (1981), Avrett and Loeser (2008), De la Luz, Lara, and Raulin (2011)], in particular at GHz, and at sub-millimeter and infrared frequencies, in the interval from 400 to 3000 GHz. Since the region of temperature minimum has long been thought of as the location where infrared to millimeter emission originates, we consider convenient to explore the effects of modifying the temperature structure of several semi-empirical models on the spectrum at this wavelength in this regime.
In this work, we improve the code PakalMPI [De la Luz et al. (2010)] to compute the physical conditions (pressure, temperature, and density) in hydrostatic equilibrium of the solar chromosphere. We compute the absorption and emission processes from millimeter to infrared wavelengths in the solar chromosphere using the C07 model (we have used the C07 model as a reference because its temperature structure represents an approximate average of the rest of the models) with two modifications, in which we artificially modify the temperature, using as threshold the minimum and maximum temperature reported in the models C07, VALC, SRPM305, 1000A, and 1008Q. We add 270 K and substract 720 K in the radial temperature profile around the temperature minimum.
The modifications are aimed at testing the diagnostic capabilities of the centimeter-infrared emission, using the Chromospheric Solar Millimeter-wave Cavity or CSMC [De la Luz, Raulin, and Lara (2013)] to trace the properties of the temperature minimum region and at establishing the role of the morphology of the temperature minimum in the discrepancy between the observed and the synthetic spectrum at the frequencies under study. In section \irefmodel we define the model under study and the modifications in the temperature minimum region; in section \irefcomputations we show the convergence test made to our code and we explain the numerical computations of the physical parameters of the solar atmosphere; in section \irefresults we present the results and finally, in section \irefconclusions, the conclusions and remarks are given.
2 The Models
model
As a representative case, we have choosen the C07 model because its temperature minimum (4400 K) is between the range of values reported by the VALC (4170 K), SRPM305 (3800 K), 1000A (3680 K), and 1008Q (4670 K) models.
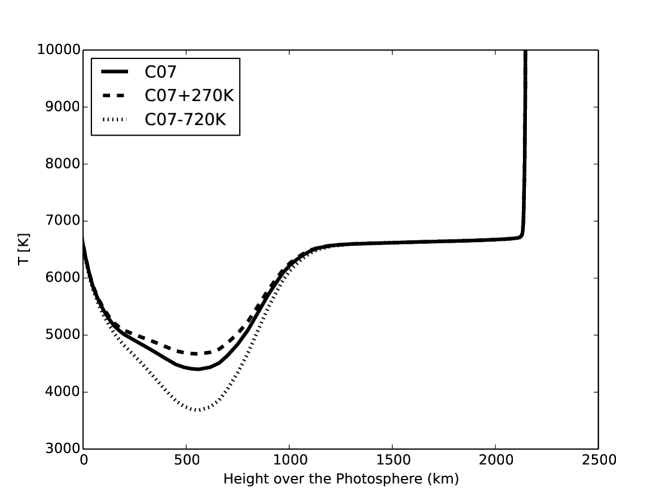
We modified the temperature profiles adding to the C07 model a Gaussian function, with amplitudes of +270 K (this model is called C07+270K) and -720 K (C07-720K), a half width at half maximum of 522 km, and centered close the temperature minimum at a height of 560 km over the solar photosphere.
Note that the height selection corresponds to the region commonly associated with the layer where the mm to IR spectral properties are sculpted (see Figure \ireftemperature.png).
3 Computations
computations We improved PakalMPI [De la Luz et al. (2010)] in order to include the computations of density and pressure in a stratified atmosphere. We followed the mathematical theory by \opencite1973ApJ…184..605V using our approximation for the hydrogen departure coefficient (the parameter) by \inlinecite2011ApJ…737….1D taking into account 20 ionic species at different ionization stages. The code uses the radial temperature profile as a reference and modifies the density profile to stabilize the pressure in order to ensure the hydrostatic equilibrium. As the variables are inter dependent, several iterations are needed until the equilibrium is reached, starting from a set of initial values close to the possible solution. We found that the initial C07 profiles of density and pressure profiles convergence to an atmosphere in hydrostatic equilibrium for both the C07+270K and C07-720K models.
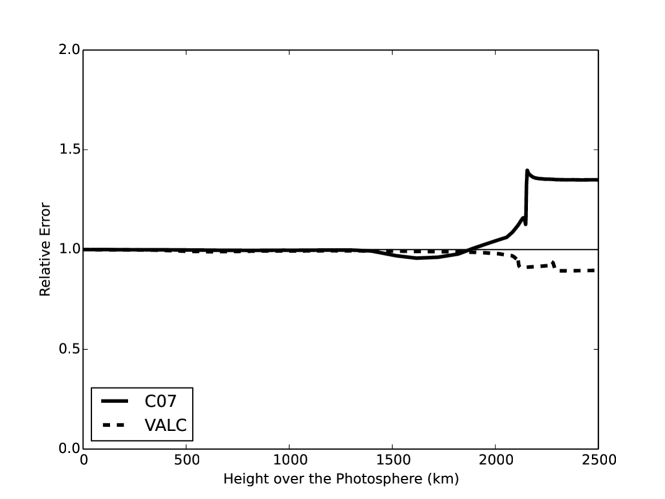
To test the numerical stability of our code, we performed the following computations: we used a pre-equilibrated model as input model (temperature, density and pressure), then the result is compared (divided) by the input model. Since we are using an approximation for the parameter from VALC model, we tested our code with both C07 and VALC. In the case of VALC model the average relative error for the density is around 4%. However, the relative error of the C07 model is almost zero up to a height of 2150 km over the photosphere, then the relative error increases to 36% (Figure \irefrelative_error). The main differences in density above 2150 km are most probably due to our approximation of the parameter (see details in \opencite2011ApJ…737….1D). For the case of VALC, the errors are low (as expected) because we are using the same values, but for the case of the C07 model the differences in the dynamic space (temperature and density) with respect to VALC produce an under abundance of gas. We, nevertheless, would like to remark that the analysis presented in this work is focused at altitudes lowers than 2150 km, therefore the results are not affected by this inconsistency at the highest layers.
We also used the code PakalMPI to solve the radiative transfer equation and compute the emission and absorption processes for each model between 2 GHz ( cm) and 10 THz ( m). The height km corresponds to the photosphere and increases outward. In all the computations, three opacity functions are included: Classical Bremsstrahlung [Kurucz (1979)], H- [Zheleznyakov (1996)], and Inverse Bremsstrahlung [Golovinskii and Zon (1980)].
We also calculated the local emission efficiency defined as
| (1) |
where is the local optical depth. The local emission efficiency ranges between 0 (optically thin) and 1 (optically thick). In the first case (), the atmosphere is not efficient in generating or absorbing radiation while in the second case () the atmosphere may be approximated by a black body at the frequencies under study (for details, see \opencite2013ApJ…762…84D). Finally, we computed the brightness temperature in the same spectral range.
4 Results
results
We analyzed the most important physical quantities related with the emission/absorption processes: the hydrogen density and its ionization state the electronic density, the local opacity, the optical depth and the brightness temperature. The global behavior of the chromospheric models in terms of the altitude are ilustrated in Figures \irefhydrogen.eps to \irefelecrons.eps.
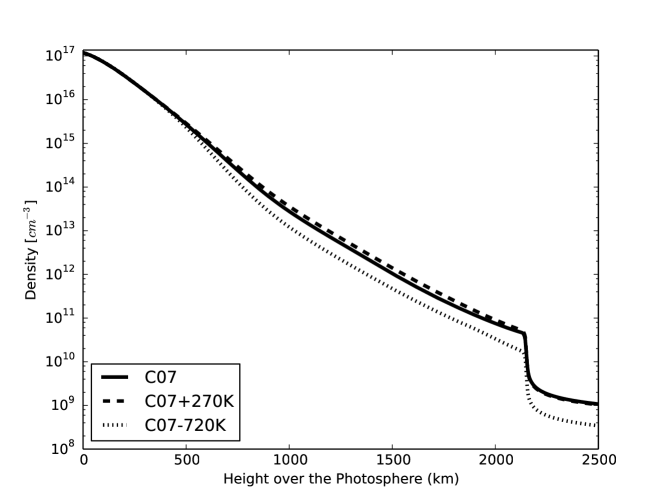
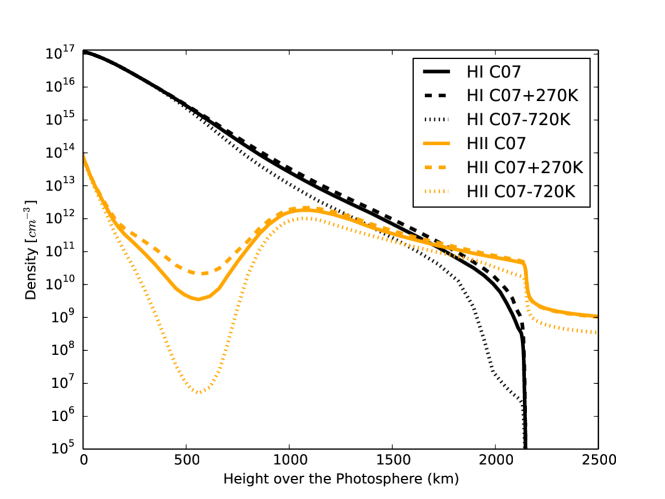
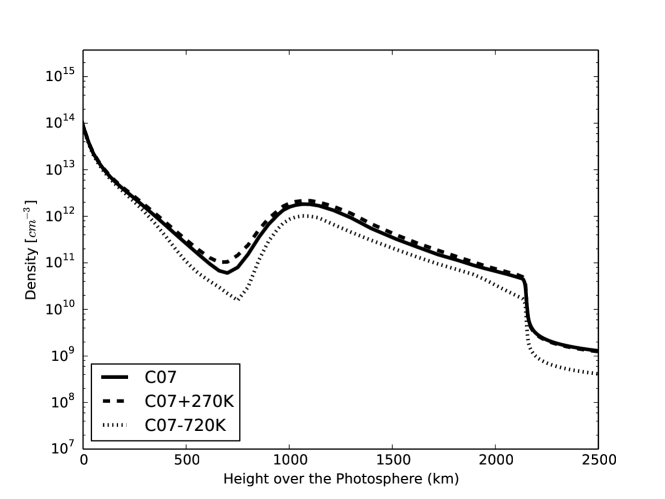
Figure \irefhydrogen.eps shows the variation of the total gas density with altitude for the three models; C07, C07+270K, and C07-720K. We found that along the first 500 km the models are very similar. However, above this height, a dependence with temperature minimum region is observed, such that the density decreases for lower values of the temperature minimum region (C07-720K) or increase at higher temperatures (C07+270K) with respect to the C07 model. In Figure \irefHI.eps we show individual neutral hydrogen (HI) and proton (HII) densities for the three models. Note that, at about 2200 km over the photosphere, hydrogen becomes fully ionized, as a consequence of the temperature increment towards the transition region. In the region between 100 and 1000 km over the photospere a decrement in the proton density is observed, the lower temperature model (C07 - 720K) being the most affected. The electronic density is plotted in Figure \irefelecrons.eps, that shows a characteristic region of high density, between 800 and 2200 km, and a decrement in the profile between 200 and 1000 km over the photosphere. In this region, free electrons in our approximation are produced by ionization of hydrogen as well as 19 other ionic species. Pakal calculates the electronic densities allowing LTE departure for hydrogen only. The rest of the species is considered in LTE.
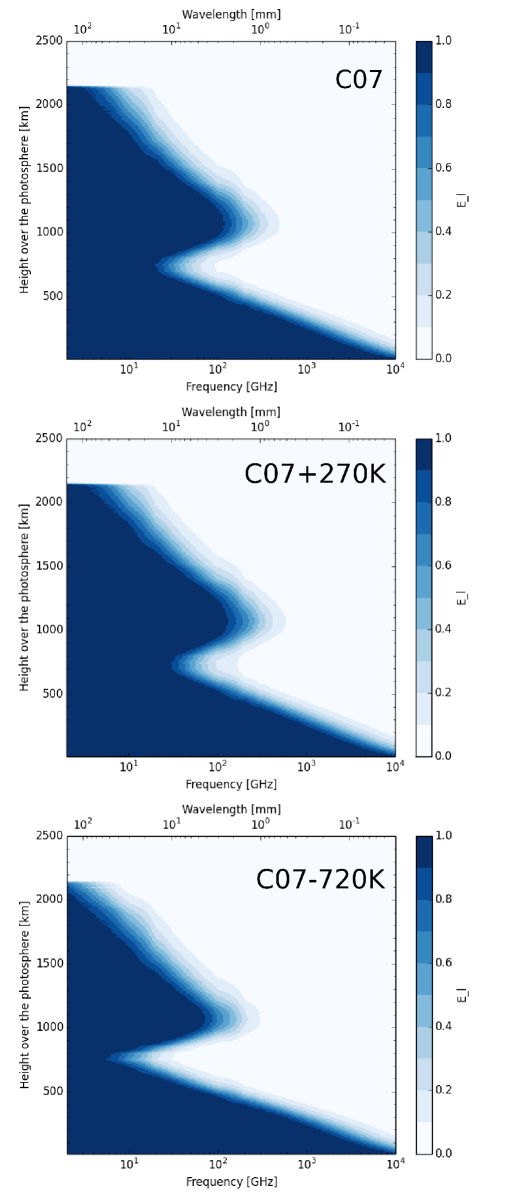
Following the analysis presented in \inlinecite2013ApJ…762…84D, we found that the CSMC is present in the C07, C07+270K, and C07-720K models as displayed in the upper, middle and bottom panels of figure \irefC07.eps, respectively. It is interesting to note that for lower values of the temperature minimum the CSMC appears at lower frequencies, and the second optically thick region (peak) of the CSMC is present in the three models.
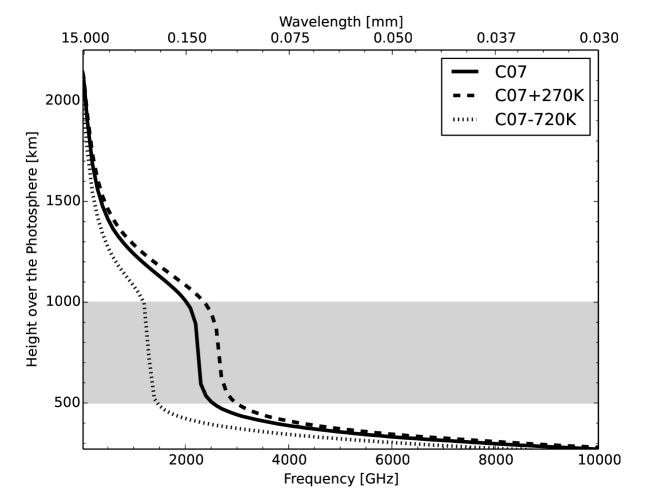
In order to analyze the tomography properties of the radio-infrared interval, we computed the height where the atmosphere becomes optically thick (), which provides an estimate of the altitude where the emission originates.
These results are illustrated in Figure \irefnuvsheightwt1.eps, where we show that the region between 500 and 1000 km over the photosphere (gray rectangle on the plot) remains hidden to observations at radio-infrared wavelengths.
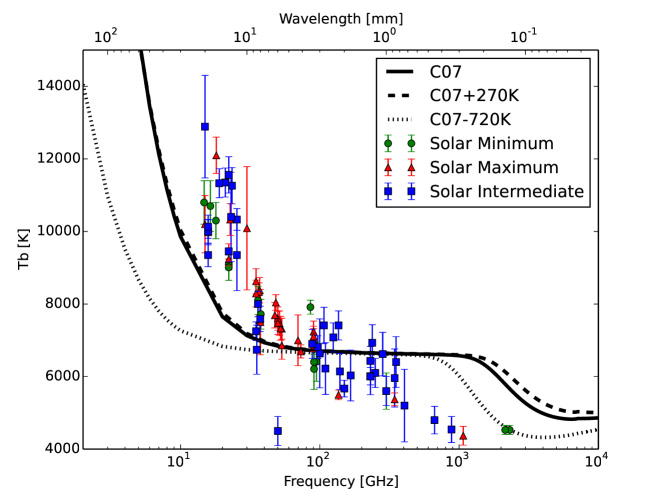
Figure \irefspectrum.eps shows the synthetic spectra for the three models together with the observed data collected from \inlinecite2004A&A…419..747L. We show that the modifications in the region of the temperature minimum impact the radio, submillimetr, and infrared frequencies, while the millimeter region remains unchanged.
5 Conclusions
conclusions
We know that Bremsstrahlung and the H- opacity dominate the absorption of the solar chromosphere at radio - infrared frequencies [De la Luz, Lara, and Raulin (2011)]. At altitudes greater than 500 km, Bremsstrahlung is the major contributor of the total opacity. However, at about this altitude, the temperature drops under the ionization temperature threshold for hydrogen atom. This results in a low number of ions and electrons that finally produce a locally thin atmosphere (the CSMC). Outward, the temperature rises again and at 6000 K the atmosphere becomes again locally optically thick, creating a second region of emission (the peak of the CSMC) at altitudes between 800 and 1500 km over the photosphere.
The peak of the CSMC is responsible of the drop of the optical depth at about 500 km as depicted in Figure \irefnuvsheightwt1.eps. This decrease creates a hidden region for the observations at radio-infrared frequencies covering altitudes from 500 to 1000 km over the photosphere.
In spite of not being directly accessible to observations, the impact of the temperature minimum morphology can be ascertained at other adjacent spectral windows. We have seen that, while does not change even under significant modifications of the depth of the temperature minimum, the effects of these modifications are noteworthy at centimeter, sub-millimeter and infrared bands. The changes in can be ascribed to two main reasons: for the case of the infrared region, the radial temperature is the responsible of the change of their H- opacity while the gas density is the responsible of the change of the Bremsstrahlung opacity at centimeter and submillimeter frequencies. We found that in order to reduce the discrepancies between models and observations, that are evident in the frequency interval 400 GHz–3 THz (submillimeter region), the local Bremsstrahlung opacity in the peak of emission of the CSMC should be reduced, not the temperature minimum value. However, a decrease in temperature causes a decrease in density at higher altitudes and also results in the decrease of the brightness temperature at centimeter wavelengths.
According to the behavior depicted in Figure \irefnuvsheightwt1.eps, the morphology of the temperature minimum cannot reduce the discrepancies between observations and theory. To this aim, a variety of solutions or combinations of them can be proposed, all of which require a decrease of the frequency of the CSCM peak: (i) increasing the radial temperature profile at these altitudes, (ii) including other processes such as the Farley-Buneman instability [Fontenla, Peterson, and Harder (2008)] that reduce the electronic density or the number of ions at these altitudes, (iii) changing the geometric symmetry as the plain parallel approximation might not be correct at the location of the peak of the CSMC, (iv) include magnetic structures as suggested by [Patsourakos, Gouttebroze, and Vourlidas (2007), Vourlidas et al. (2010)].
Acknowledgements
CGGC is grateful to FAPESP (Proc. 2009/18386-7). CGGC is level 2 fellow of CNPq and Investigador Correspondiente (CONICET). This work was partially funded by Conacyt grant CB2009-134985.
References
- Athay and Thomas (1961) Athay, R.G., Thomas, R.N.: 1961, Physics of the solar chromosphere.
- Avrett (2003) Avrett, E.H.: 2003, The Solar Temperature Minimum and Chromosphere. In: Pevtsov, A.A., Uitenbroek, H. (eds.) Current Theoretical Models and Future High Resolution Solar Observations: Preparing for ATST, Astronomical Society of the Pacific Conference Series 286, 419.
- Avrett and Loeser (2008) Avrett, E.H., Loeser, R.: 2008, Models of the Solar Chromosphere and Transition Region from SUMER and HRTS Observations: Formation of the Extreme-Ultraviolet Spectrum of Hydrogen, Carbon, and Oxygen. ApJS 175, 229 – 276. doi:10.1086/523671.
- Ayres (1978) Ayres, T.R.: 1978, Center-to-limb behavior of first-overtone vibration-rotation transitions of solar carbon monoxide. ApJ 225, 665 – 673. doi:10.1086/156527.
- De la Luz, Lara, and Raulin (2011) De la Luz, V., Lara, A., Raulin, J.-P.: 2011, Synthetic Spectra of Radio, Millimeter, Sub-millimeter, and Infrared Regimes with Non-local Thermodynamic Equilibrium Approximation. ApJ 737, 1 – +. doi:10.1088/0004-637X/737/1/1.
- De la Luz, Raulin, and Lara (2013) De la Luz, V., Raulin, J.-P., Lara, A.: 2013, The Chromospheric Solar Millimeter-wave Cavity Originates in the Temperature Minimum Region. ApJ 762, 84. doi:10.1088/0004-637X/762/2/84.
- De la Luz et al. (2010) De la Luz, V., Lara, A., Mendoza-Torres, J.E., Selhorst, C.L.: 2010, Pakal: A Three-dimensional Model to Solve the Radiative Transfer Equation. ApJS 188, 437 – 446. doi:10.1088/0067-0049/188/2/437.
- Fontenla, Peterson, and Harder (2008) Fontenla, J.M., Peterson, W.K., Harder, J.: 2008, Chromospheric heating by the Farley-Buneman instability. A&A 480, 839 – 846. doi:10.1051/0004-6361:20078517.
- Fontenla et al. (2006) Fontenla, J.M., Avrett, E., Thuillier, G., Harder, J.: 2006, Semiempirical Models of the Solar Atmosphere. I. The Quiet- and Active Sun Photosphere at Moderate Resolution. ApJ 639, 441 – 458. doi:10.1086/499345.
- Fontenla et al. (2011) Fontenla, J.M., Harder, J., Livingston, W., Snow, M., Woods, T.: 2011, High-resolution solar spectral irradiance from extreme ultraviolet to far infrared. Journal of Geophysical Research (Atmospheres) 116, 20108. doi:10.1029/2011JD016032.
- Golovinskii and Zon (1980) Golovinskii, P.A., Zon, B.A.: 1980, Bremsstrahlung during collision of electrons with negative ions. Zhurnal Tekhnicheskoi Fiziki 50, 1847 – 1851.
- Hagen (1957) Hagen, J.P.: 1957, The structure of the solar chromosphere from centimetre-wave radio observations. In: van de Hulst, H.C. (ed.) Radio astronomy, IAU Symposium 4, 263.
- Kurucz (1979) Kurucz, R.L.: 1979, Model atmospheres for G, F, A, B, and O stars. ApJS 40, 1 – 340. doi:10.1086/190589.
- Liseau et al. (2013) Liseau, R., Montesinos, B., Olofsson, G., Bryden, G., Marshall, J.P., Ardila, D., Bayo Aran, A., Danchi, W.C., del Burgo, C., Eiroa, C., Ertel, S., Fridlund, M.C.W., Krivov, A.V., Pilbratt, G.L., Roberge, A., Thébault, P., Wiegert, J., White, G.J.: 2013, Centauri A in the far infrared. First measurement of the temperature minimum of a star other than the Sun. A&A 549, L7. doi:10.1051/0004-6361/201220776.
- Loukitcheva et al. (2004) Loukitcheva, M., Solanki, S.K., Carlsson, M., Stein, R.F.: 2004, Millimeter observations and chromospheric dynamics. A&A 419, 747 – 756. doi:10.1051/0004-6361:20034159.
- Patsourakos, Gouttebroze, and Vourlidas (2007) Patsourakos, S., Gouttebroze, P., Vourlidas, A.: 2007, The Quiet Sun Network at Subarcsecond Resolution: VAULT Observations and Radiative Transfer Modeling of Cool Loops. ApJ 664, 1214 – 1220. doi:10.1086/518645.
- Shibasaki, Alissandrakis, and Pohjolainen (2011) Shibasaki, K., Alissandrakis, C.E., Pohjolainen, S.: 2011, Radio Emission of the Quiet Sun and Active Regions (Invited Review). Sol. Phys. 273, 309 – 337. doi:10.1007/s11207-011-9788-4.
- Uitenbroek (2000) Uitenbroek, H.: 2000, The CO Fundamental Vibration-Rotation Lines in the Solar Spectrum. II. Non-LTE Transfer Modeling in Static and Dynamic Atmospheres. ApJ 536, 481 – 493. doi:10.1086/308933.
- Vernazza, Avrett, and Loeser (1973) Vernazza, J.E., Avrett, E.H., Loeser, R.: 1973, Structure of the Solar Chromosphere. Basic Computations and Summary of the Results. ApJ 184, 605 – 632.
- Vernazza, Avrett, and Loeser (1981) Vernazza, J.E., Avrett, E.H., Loeser, R.: 1981, Structure of the solar chromosphere. III - Models of the EUV brightness components of the quiet-sun. ApJS 45, 635 – 725. doi:10.1086/190731.
- Vourlidas et al. (2010) Vourlidas, A., Sanchez Andrade-Nuño, B., Landi, E., Patsourakos, S., Teriaca, L., Schühle, U., Korendyke, C.M., Nestoras, I.: 2010, The Structure and Dynamics of the Upper Chromosphere and Lower Transition Region as Revealed by the Subarcsecond VAULT Observations. Sol. Phys. 261, 53 – 75. doi:10.1007/s11207-009-9475-x.
- Zheleznyakov (1996) Zheleznyakov, V.V. (ed.): 1996, Radiation in Astrophysical Plasmas, Astrophysics and Space Science Library 204.