751
Stellar populations in the ELT perspective
Abstract
We discuss the impact that the next generation of Extremely Large Telescopes will have on the open astrophysical problems of resolved stellar populations. In particular, we address the interplay between multiband photometry and spectroscopy.
keywords:
Galaxies: dwarf — Galaxies: Local Group — Galaxies: individual (Carina) — Galaxies: stellar content — Stars: evolution — Techniques: photometric1 Introduction
The Astronomical Community (AC) is planning the science of three Extremely Large Telescopes (ELTs): Giant Magellan Telescope (GMT)111www.gmto.org, Thirty Meter Telescope (TMT)222www.tmt.org and the European Extremely Large Telescope (E-ELT)333www.eso.org/public/teles-instr/e-elt/. These facilities will have a relevant impact on the cutting-edge technology adopted to build large ground-based telescopes. The transition from the 8-10m class telescopes to the 30-40m class telescopes before being a ”stylistic departure” is a ”paradigm shift” in their realization. The reasons are manifold.
Adaptive Optics– The ELTs plan to have either at first light or during operations different flavors of Adaptive Optics systems: ranging from Ground Layer Adaptive Optics (GLAO) to Single Conjugate Adaptive Optics (SCAO) to Multi Conjugate Adaptive Optics (MCAO) and to Multi-Object Adaptive Optics (MOAO). These challenging instruments shaked off their pioneering laboratory phase and are now producing very interesting results in many astrophysical fields. The Multiconjugate Adaptive optics Demonstrator (MAD, Marchetti et al. 2006) available at VLT provided a new view of the central regions of Globular Clusters (GCs) (Ferraro et al., 2009; Bono et al., 2010), of massive stars (Crowther et al., 2010) and star forming regions (Selman et al., 1999). The First Light Adaptive Optics (FLAO, Esposito et al. 2012) systems available at LBT provided very high quality images not only of extra-solar planets (Esposito et al., 2013), but also for accretion disks (Rodigas et al., 2012) and on the NIR Color-Magnitude Diagram (CMD) of GCs (Monelli et al., 2013). More recently, the adaptive optics system developed at GEMINI using both natural guide stars and lasers, the Gemini Multi-Conjugate Adaptive Optics System (GEMS, Rigaut et al. 2012), provided the opportunity to investigate GCs (NGC 288), open clusters (NGC 2362) and nearby galaxies (Neichel et al. 2013; AO4ELT3444http://ao4elt3.sciencesconf.org/).
New theoretical and empirical framework– The new facilities will provide a wealth of new photometric and spectroscopic data. Once again the reduction and the analysis of these data will require a profound change in the strategy and in the algorithms currently adopted to perform PSF photometry (DAOPHOT, Stetson 1994; ROMAFOT, Buonanno et al. 1983; Starfinder, Diolaiti et al. 2000) and to measure equivalent widths (Fitline, François et al. 2003) or in spectrum synthesis (MOOG, Sneden 1973; ATLAS, Sbordone et al. 2004) abundance analysis. The same applies to the new techniques for integral field spectroscopy that have been developed to deal with spectroscopic data cubes collected with Integral Field Units (SAURON, Jeong et al. 2012; Kamann et al. 2013). Theoretical predictions (stellar evolutionary models, pulsation models, atmosphere models dynamical models, Salaris 2012; Bono et al. 2013) and cosmological simulations (Millennium simulation, Springel et al. 2005; Pandey et al. 2013) will also need extensive evolution. This applies to the physical and numerical assumptions currently adopted to simulate real phenomena and to the parameter space they are covering.
Science drivers– However, the conceptual jump appears even more relevant if we account for the scientific impact that E-ELT will have on open astrophysical problems. It is difficult to find a single astrophysical field that will not be affected by ELTs. They range from new constraints on fundamental physic constants (Martins et al., 2013) to measure the expansion of the universe in real time (Liske et al., 2008) to the reionization of the universe (Pentericci et al., 2011) to the formation and evolution of galaxies (Puech, 2010) to resolved and unresolved stellar populations (Caffau et al., 2012) to protoplanetary disks (Bast et al., 2013) and to the characterization of extrasolar planets (Lovis & Mayor, 2007).
2 The link between photometry and spectroscopy
In the following we discuss the impact that deep multiband photometry and spectroscopy will have on nearby stellar populations.
2.1 Age metallicity degeneracy
One of the most long-standing and deceptive problems in dealing with stellar populations in nearby stellar systems is the so-called age-metallicity relation. The key problem is that a stellar population can attain redder colors either by an increase in metal content (Sandage, 1953) or by an increase in age or in mean reddening (Fanelli et al., 1988). The problem becomes even more severe when dealing with unresolved stellar populations (Worthey, 1994). The difficulty is a consequence of the fact that broad- and medium-band photometry together with spectral indices are affected by an intrinsic degeneracy in the case of complex stellar populations (Percival & Salaris, 2009). The observational scenario is further complicated by the evidence that these stellar systems are also characterized by a complex star formation history and probably by changes in the initial mass function. However, new indices have been recently suggested to partially overcome the degeneracy, and in particular to single out the impact of the different astrophysical parameters (van Dokkum & Conroy, 2012).
Obviously, the age-metallicity degeneracy does not apply to nearby resolved stellar populations for which we can clearly identify the main-sequence turn-off (MSTO) of the different stellar populations. However, even for these systems we still have a problem of age/metallicity degeneracy along the Red Giant Branch (RGB). Precise multi-band photometry allows us to separate RGB from Asymptotic Giant Branch (AGB) stars (Stetson et al., 2011). However, stellar populations with different metallicity distributions and/or different age distributions are located along the same RGB.
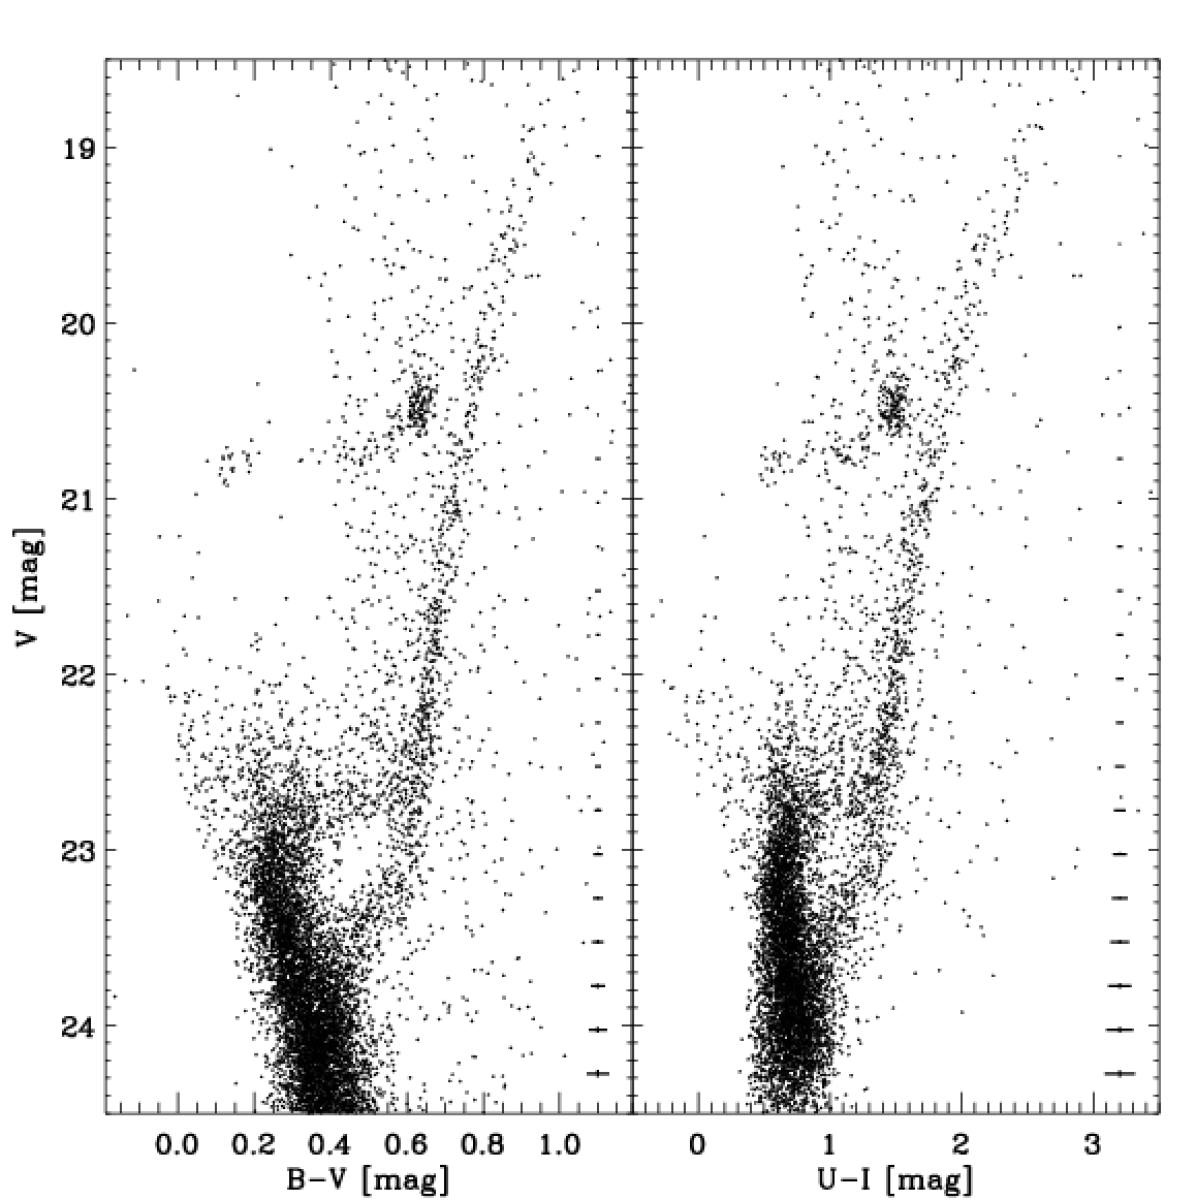
The typical stellar system in which the above degeneracy is clearly present is the dwarf spheroidal galaxy Carina. This galaxy experienced at least three different stars formation episodes (see left panel of Fig. 1): an old one (t12 Gyr) associated with the faint subgiant branch (SGB) located at 23.5 and 0.5; an intermediate-age one (t-6–8 Gyr) associated with the bright SGB located at 22.7 and 0.45; and a young one (t1 Gyr) associated with the bright end of the MS located at 22.4 and 0.15.
Data plotted in the left panel of Fig. 1 show that the quoted stellar populations do form in the , CMD a very well defined RGB in which the width in color is mainly due to photometric error (21.5, 0.02). It goes without saying that the use of colors covering a broad range in wavelengths typically help to disentangle the different subpopulations. However, data plotted in the right panel of Fig. 1 show that even in the , CMD the width in color along the RGB is still caused by photometric errors (21.5, 0.03). Note that candidate Carina stars plotted in the CMDs of Fig. 1 were selected using the , color-color plane (Bono et al., 2010).
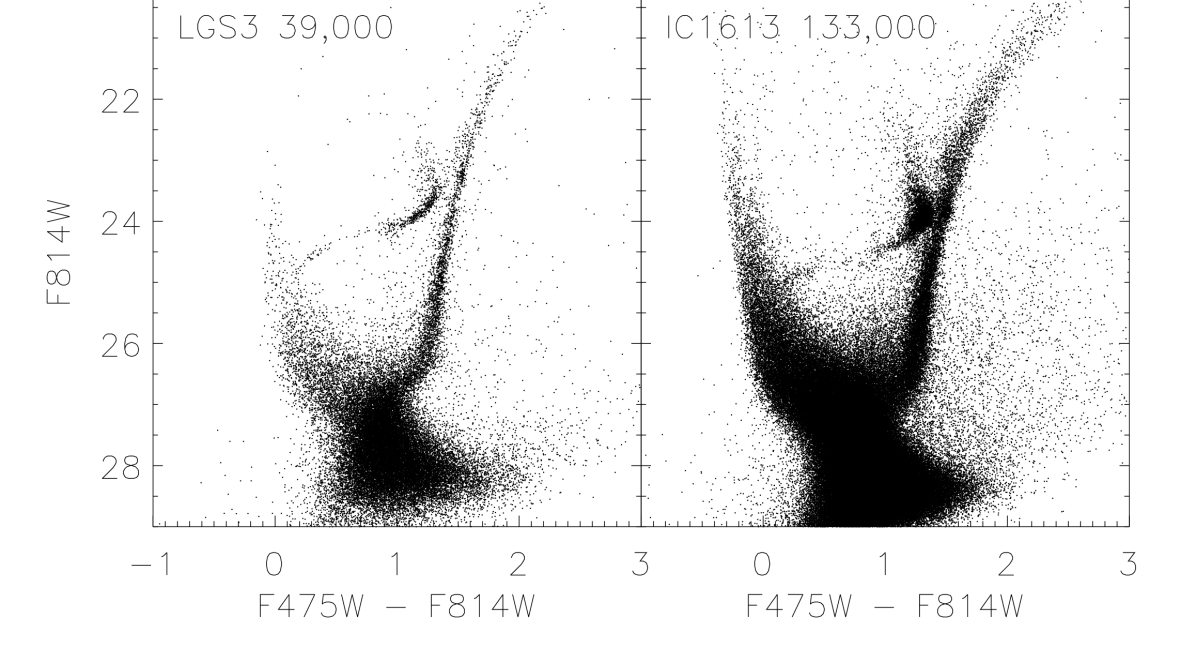
The above empirical scenario also applies to several dwarf galaxies in the Local Group (LG). Fig. 2 shows the F814W, F475W–F814W CMD of LG dwarfs, based on space images collected with the Advanced Camera for Surveys Wide Field Channel on board the Hubble Space Telescope. The top panels display the CMD of two isolated dSphs: Tucana (left) and Cetus (right). Detailed Star Formation Histories (SFH) of the former system indicate that its stellar content is dominated by a single, old (121 Gyr) and metal-poor SF event (Monelli et al., 2010). The CMD of the latter isolated dwarf shows quite similar features (Monelli et al., 2010). However, Tucana shows two well-defined bumps along the RGB, suggestive of double peaked metallicity distribution. This empirical evidence is supported by the pulsation properties of RR Lyrae stars, showing different period-distributions and different mean magnitudes (Bernard et al., 2008). On the other hand, Cetus shows a single RGB bump and its RR Lyrae display homogeneous pulsation properties. In spite of the above stark differences the two RGBs appear quite similar.
Data plotted in the bottom panels of Fig. 2 show the CMDs of the transition galaxy LGS3 and of the dwarf irregular IC1613. The morphology of the old, horizontal branch (HB) stars and of the intermediate-mass red clump (RC) stars indicates that the quoted stellar systems experienced SF activity over a broad range in ages. The former galaxy has had an intense SF event from 13.5 to 8.5 Gyr ago (Hidalgo et al., 2011), while IC1613 has had an undergoing SF activity during the last 12 Gyr. The recent SF event in this system is supported by the well populated young main sequence (Bernard et al., 2010) and by the large number of classical Cepheids (Freedman et al., 2009). Note that the accurate and deep ACS/WFC photometry does not allow us to identify the MSTOs of the different subpopulations.
The above evidence indicates that precise and deep multiband photometry for which possible systematic uncertainties in relative and absolute photometric zero-points have been constrained at the level of a few hundredths of magnitude are still affected by the age/metallicity degeneracy along the RGB. This means that current age estimates (Lemasle et al., 2012) of stars located along the RGB need to be cautiously treated, since current empirical and theoretical (mixing length treatment, Salaris & Cassisi 2008) uncertainties affect not only the absolute, but also the relative age estimates along the RGB.
2.2 The index and spectroscopy
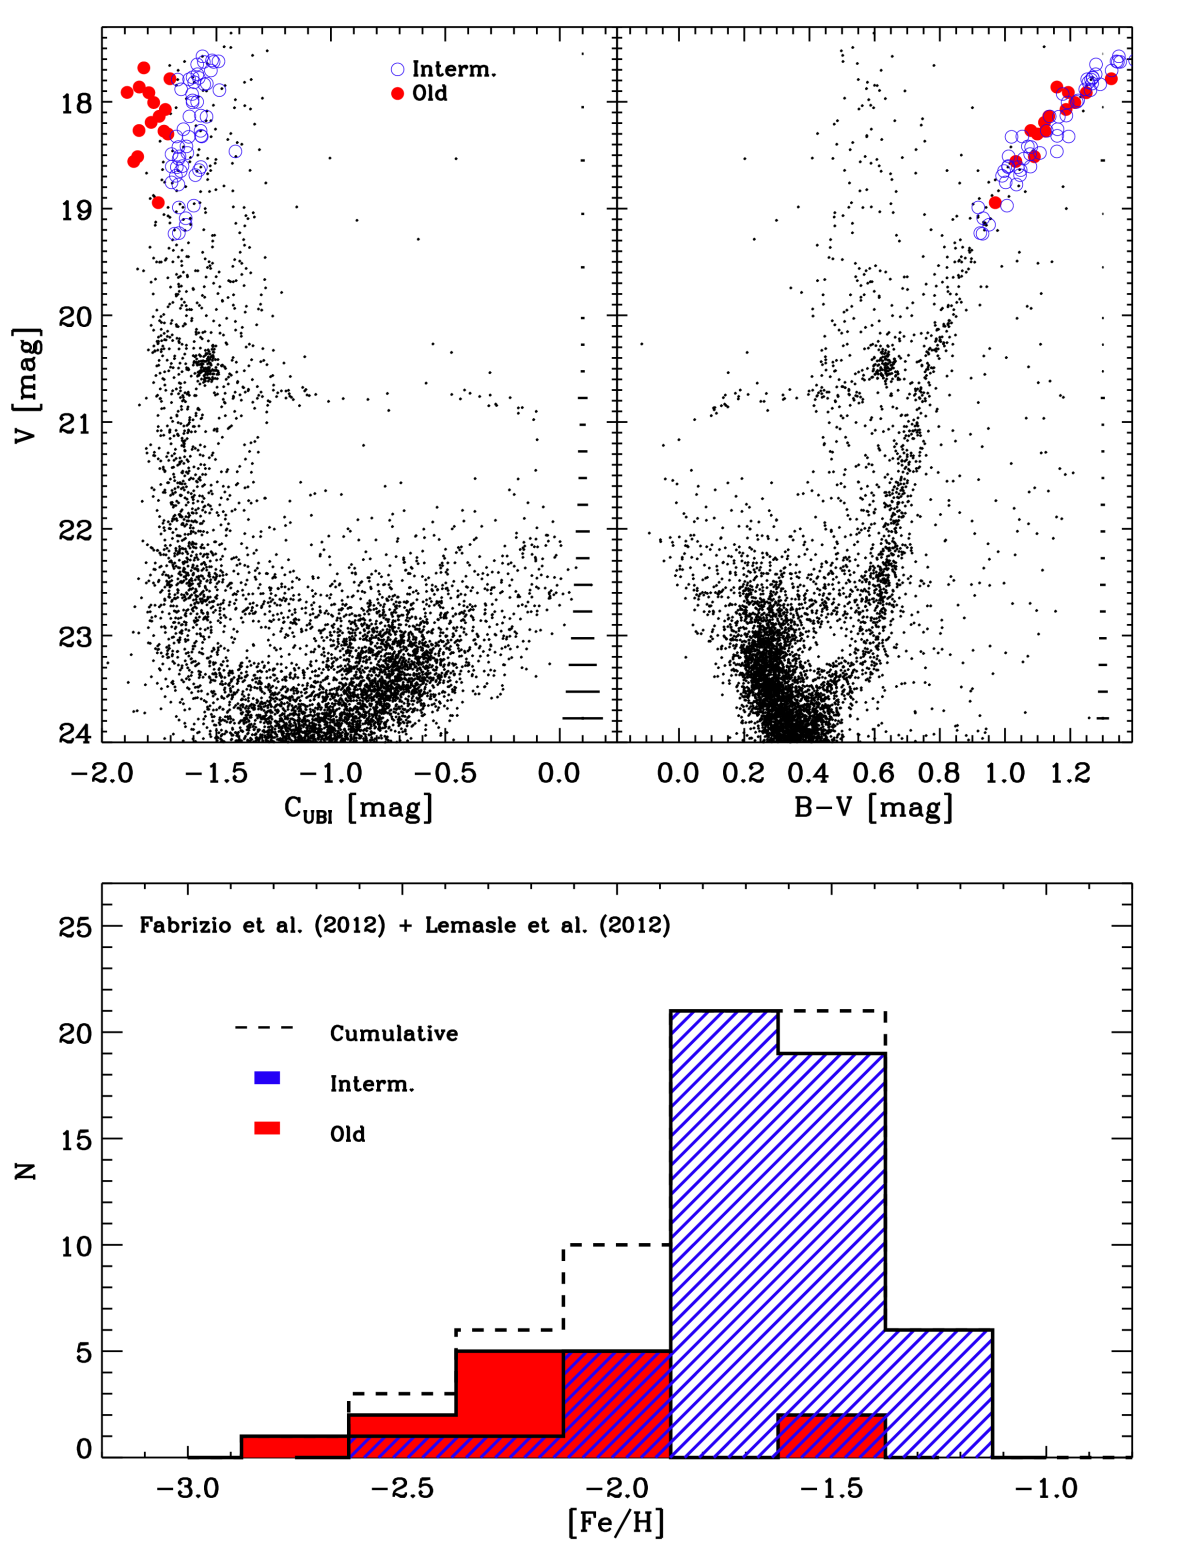
It came as a surprise that the pseudo-color =()–() introduced by Monelli et al. (2013) to separate multi-populations in GCs can also play a crucial role in disentangling the age-metallicity degeneracy in nearby dwarf galaxies. Data plotted in the top left panel of Fig. 3 show the , CMD of Carina. Note that the index switches hot stars from the left to the right of the CMD. It is worth mentioning that the index appears to be quite sensitive to the metal abundance, and indeed RGB stars separate into different subgroups. The bluer ones are associated with the old population, while the redder ones are associated with the intermediate-age population (Monelli et al., 2014). This working hypothesis is supported by a good sample of RGB stars for which accurate iron abundances based on high-resolution spectra are available (Fabrizio et al., 2012). The filled and the open circles mark the position of the Carina stars associated to the old and to the intermediate-age sub-population. Interestingly enough, the same objects do not show any significant difference in color in the canonical , CMD (top right panel of Fig. 3).
The bottom panel of Fig. 3 shows the cumulative metallicity distribution based on iron abundances provided by Fabrizio et al. (2012) and by Lemasle et al. (2012) for 68 RGB stars (dashed line). The use of the index allow us to constrain the mean metallicity and the spread in metallicity of both the old (dark grey area) and the intermediate-age (hatched area) subpopulations. We found that the weighted mean metallicity of the old population is –1.810.02, while its spread is 0.47. On the other hand, the intermediate-age population has a mean metallicity of –1.500.01 and a spread of 0.29. Current findings are still hampered by the limited sample of spectroscopic measurements, but they suggest that the two sub-populations are characterized by different metallicity distributions. This preliminary evidence indicates that the chemical enrichment history of Carina appears to be much more complex than currently assumed.
The use of the index and fiber multi-object spectrographs available at the 8m class telescopes will provide the opportunity to constrain the chemical enrichment of RGB stars in LG dwarfs down to 21–22 mag. However, the CMDs plotted in Figures 1 and 3 show that a detailed analysis of the chemical enrichment does require large star samples covering the entire body of the nearby galaxies.
A key advantage of nearby stellar systems is that they can fully exploit the intrinsic multiplexity of current and future generations of MOS. This means that LG dwarfs are optimal targets for MOS equipped with both high-resolution and medium-resolution fibers. The former ones can be used for bright RGs to constrain the chemical enrichment of both iron and -elements, while the latter to constrain the kinematics. Note that dwarf galaxies are characterized by a low surface brightness. This means that, when moving from the innermost to the outermost regions the density of galaxy stars decrease quite rapidly. This means that to properly trace the radial velocity profile, and in particular the dispersion of the radial velocity, in nearby dwarfs it is mandatory to use either SGB or Main Sequence (MS) stars.
The above circumstantial evidence provides solid constraints concerning spectral resolution and wavelength coverage for future MOS at ELTs. An optical, seeing limited, high-resolution (R15,000–20,000) spectrograph should reach, in a plausible amount of observing time, a limiting magnitude of 24–25 mag. This will enable high-resolution spectroscopy of RGB and helium burning stars (HB, RC) over a significant fraction of LG dwarfs. The simultaneous use of both low- (R1000–2000) and medium-resolution (R4000–5000) fibers down to a limiting magnitude of 27–28 means the possibility to provide accurate radial velocity measurements for SGB and MS stars in the same targets. The need for 3D radial velocity and dispersion velocity maps with a precision of 1–2 km s-1 means hundreds of targets per radial bin, and in turn several thousands of targets per galaxy. The above requirements suggest a multiplexity between low/medium and high-resolution fibers of the order of 400–500.
3 Conclusions and final remarks
The impact that ELTs will have on astrophysics and cosmology can be more easily traced if we account for the context in which these new facilities are going to operate. The James Webb Space Telescope (JWST) is expected to be launched and operated with similar timescales. This means that accurate and very deep NIR images of primordial galaxies and galaxy luminosity functions as a function of the redshift will become available to the AC. Spectroscopic follow up to provide massive estimates of redshifts and to use independent diagnostics to constrain the star formation rate as a function of redshift together with the characterization of their stellar populations and chemical enrichment histories appears as sound complements.
Moreover, we need to take into account that GAIA will start taking data quite soon. The photometric, astrometric and spectroscopic data that GAIA will collect will provide a new view of the Milky Way and of the nearby Universe. The identification of Galactic substructures would require deeper multiband photometry and spectroscopy with ELTs.
On top of the above complementary science ELTs have already a broad range of experiments that can only be addressed with ELTs. This is the dowry that makes them the most challenging and promising opportunity for current and future generation of astronomers.
References
- Bast et al. (2013) Bast, J. E., Lahuis, F., van Dishoeck, E. F., & Tielens, A. G. G. M. 2013, A&A, 551, A118
- Bernard et al. (2008) Bernard, E. J., Gallart, C., Monelli, M., et al. 2008, ApJ, 678, L21
- Bernard et al. (2010) Bernard, E. J., Monelli, M., Gallart, C., et al. 2010, ApJ, 712, 1259
- Bono et al. (2010) Bono, G., Stetson, P. B., Walker, A. R., et al. 2010, PASP, 122, 651
- Bono et al. (2010) Bono, G., Stetson, P. B., VandenBerg, D. A., et al. 2010, ApJ, 708, L74
- Bono et al. (2013) Bono, G., Inno, L., Matsunaga, N., et al. 2013, IAU Symposium, 289, 116
- Buonanno et al. (1983) Buonanno, R., Buscema, G., Corsi, C. E., Ferraro, I., & Iannicola, G. 1983, A&A, 126, 278
- Caffau et al. (2012) Caffau, E., Bonifacio, P., François, P., et al. 2012, A&A, 542, A51
- Crowther et al. (2010) Crowther, P. A., Schnurr, O., Hirschi, R., et al. 2010, MNRAS, 408, 731
- Diolaiti et al. (2000) Diolaiti, E., Bendinelli, O., Bonaccini, D., et al. 2000, A&AS, 147, 335
- Esposito et al. (2012) Esposito, S., Pinna, E., Quirós-Pacheco, F., et al. 2012, Proc. SPIE, 8447,
- Esposito et al. (2013) Esposito, S., Mesa, D., Skemer, A., et al. 2013, A&A, 549, A52
- Fabrizio et al. (2012) Fabrizio, M., Merle, T., Thévenin, F., et al. 2012, PASP, 124, 519
- Fanelli et al. (1988) Fanelli, M. N., O’Connell, R. W., Thuan, T. X. 1988, ApJ, 334, 665
- Ferraro et al. (2009) Ferraro, F. R., Beccari, G., Dalessandro, E., et al. 2009, Nature, 462, 1028
- François et al. (2003) François, P., Depagne, E., Hill, V., et al. 2003, A&A, 403, 1105
- Freedman et al. (2009) Freedman, W. L., Rigby, J., Madore, B. F., et al. 2009, ApJ, 695, 996
- Hidalgo et al. (2011) Hidalgo, S. L., Aparicio, A., Skillman, E., et al. 2011, ApJ, 730, 14
- Jeong et al. (2012) Jeong, H., Yi, S. K., Bureau, M., et al. 2012, MNRAS, 423, 1921
- Kamann et al. (2013) Kamann, S., Wisotzki, L., & Roth, M. M. 2013, A&A, 549, A71
- Lemasle et al. (2012) Lemasle, B., Hill, V., Tolstoy, E., et al. 2012, A&A, 538, A100
- Liske et al. (2008) Liske, J., Grazian, A., Vanzella, E., et al. 2008, MNRAS, 386, 1192
- Lovis & Mayor (2007) Lovis, C., & Mayor, M. 2007, A&A, 472, 657
- Marchetti et al. (2006) Marchetti, E., Brast, R., Delabre, B., et al. 2006, Proc. SPIE, 6272, 21
- Martins et al. (2013) Martins, C. J. A. P., Ferreira, M. C., Julião, M. D., et al. 2013, arXiv:1309.7758
- Mateo et al. (2012) Mateo, M., Bailey, J. I., Crane, J., et al. 2012, Proc. SPIE, 8446,
- Monelli et al. (2010) Monelli, M., Hidalgo, S. L., Stetson, P. B., et al. 2010, ApJ, 720, 1225
- Monelli et al. (2010) Monelli, M., Gallart, C., Hidalgo, S. L., et al. 2010, ApJ, 722, 1864
- Monelli et al. (2013) Monelli, M., Milone, A. P., Stetson, P. B., et al. 2013, MNRAS, 431, 2126
- Monelli et al. (2014) Monelli, M., et al. 2014, ApJ, submitted
- Neichel et al. (2013) Neichel, B., D’Orgeville, C., Callingham, J., et al. 2013, MNRAS, 429, 3522
- Pandey et al. (2013) Pandey, B., White, S. D. M., Springel, V., & Angulo, R. E. 2013, MNRAS, 435, 2968
- Pentericci et al. (2011) Pentericci, L., Fontana, A., Vanzella, E., et al. 2011, ApJ, 743, 132
- Percival & Salaris (2009) Percival, S. M., Salaris, M. 2009, ApJ, 703, 1123
- Puech (2010) Puech, M. 2010, MNRAS, 406, 535
- Rigaut et al. (2012) Rigaut, F., Neichel, B., Boccas, M., et al. 2012, Proc. SPIE, 8447,
- Rodigas et al. (2012) Rodigas, T. J., Hinz, P. M., Leisenring, J., et al. 2012, ApJ, 752, 57
- Salaris & Cassisi (2008) Salaris, M., & Cassisi, S. 2008, A&A, 487, 1075
- Salaris (2012) Salaris, M. 2012, Ap&SS, 341, 65
- Sandage (1953) Sandage, A. R. 1953, AJ, 58, 61
- Sbordone et al. (2004) Sbordone, L., Bonifacio, P., Castelli, F., & Kurucz, R. L. 2004, MemSait, 5, 93
- Selman et al. (1999) Selman, F., Melnick, J., Bosch, G., & Terlevich, R. 1999, A&A, 347, 532
- Smith et al. (2004) Smith, G. A., Saunders, W., Bridges, T., et al. 2004, Proc. SPIE, 5492, 410
- Sneden (1973) Sneden, C. 1973, ApJ, 184, 839
- Springel et al. (2005) Springel, V., White, S. D. M., Jenkins, A., et al. 2005, Nature, 435, 629
- Stetson (1994) Stetson, P. B. 1994, PASP, 106, 250
- Stetson et al. (2011) Stetson, P. B., Monelli, M., Fabrizio, M., et al. 2011, The Messenger, 144, 32
- van Dokkum & Conroy (2012) van Dokkum, P. G., & Conroy, C. 2012, ApJ, 760, 70
- Worthey (1994) Worthey, G. 1994, ApJS, 95, 107