Quenched pinning and collective dislocation dynamics
Several experiments show that crystalline solids deform in a bursty and intermittent fashion. Power-law distributed strain bursts in compression experiments of micron-sized samples and acoustic emission energies from larger-scale specimens are the key signatures of the underlying critical-like collective dislocation dynamics - a phenomenon that has also been seen in discrete dislocation dynamics (DDD) simulations. Here we show by performing large-scale two-dimensional DDD simulations that the character of the dislocation avalanche dynamics changes upon addition of sufficiently strong randomly distributed quenched pinning centers, present e.g. in many alloys as immobile solute atoms. For intermediate pinning strength, our results adhere to the scaling picture of depinning transitions, in contrast to pure systems where dislocation jamming dominates the avalanche dynamics. Still stronger disorder quenches the critical behaviour entirely.
The origin of crackling noise SET-01 in crystal plasticity has an appealing explanation in terms of a non-equilibrium phase transition ZAI-06 ; ANA-07 ; ALA-14 : If the externally applied stress is high enough, a sample is in a regime of continous flow or yielding, while at small stress values and low temperatures one would expect the yielding activity to stop after a transient. The existence of a “yielding transition” separating these two regimes, envisaged to take place at a critical value of the applied stress and corresponding to a vanishing plastic deformation rate, would then give rise to a natural explanation for the observed scale-free avalanche dynamics UCH-09 ; DIM-06 ; CSI-07 ; WEI-97 ; MIG-01 . Such a picture has been used in analogy to other systems, including the depinning transition of domain walls in disordered ferromagnets underlying the magnetic field driven jerky domain walls motion, or the Barkhausen effect DUR-06 ; LED-02 ; ROS-09 .
The irreversible deformation process of crystalline solids is a consequence of the stress-driven motion of dislocations, line-like defects of the crystal lattice, which interact with each other via their anisotropic long-range stress fields. Due to these interactions, in combination with constraints due to the underlying crystal structure on their motion, dislocations tend to form various complicated metastable structures. Thus, the term “dislocation jamming” MIG-02 ; LAU-10 ; LIU-01 has been coined to describe their tendency to get stuck due to many-body dislocation interactions, and this mechanism is then expected to be behind the emergence of a finite yield stress in “pure” crystals, without a significant population of additional defects, such as solute atoms or the complications of e.g. grain boundaries. The character of the dislocation jamming transition in such “pure” DDD models has been analyzed from various angles MIG-02 ; LAU-10 ; LAU-12 ; ISP-11 ; ISP-14 . A recent study found ISP-14 that the scaling exhibited by the strain bursts within a two-dimensional (2) pure DDD model is fundamentally different from that expected within the mean field or high-dimensional limit of the pinning/depinning scenario FIS-98 , often assumed to describe bursty plastic deformation: 2 dislocation dynamics seems to exhibit critical signatures with “anomalous” properties not only in the proximity of the yielding transition, but also at very low external stresses. A detailed study is so far missing in three dimensions, though 3 DDD simulations of dislocation avalanches seem to reproduce partially the typical single crystal compression results CSI-07 and to be close to the mean-field case.
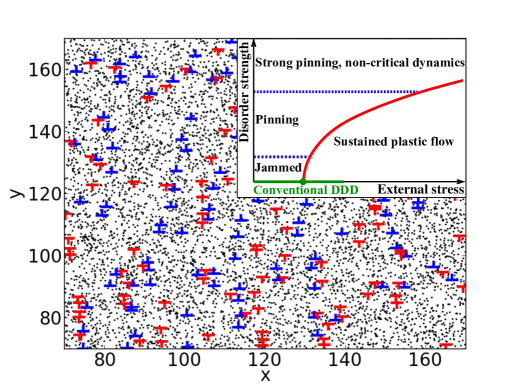
In reality, plastic deformation or dislocation glide is usually further complicated by the presence of various kinds of defects - precipitates, grain boundaries, vacancies, solute atoms - that interact with the dislocations and thus interfere with the deformation process ZAP-01 ; MOR-04 ; indeed much of metallurgy is based on the practical utilization of this phenomenon to optimize hardness or ductility COU-90 , also known well in the context of high-temperature superconductors with vortex pinning BLA-94 . Here we study the effect of disorder on collective dislocation dynamics. To this end, we generalize the standard, two-dimensional (2) DDD models GIE-95 ; MIG-08 to include a random arrangement of quenched pinning centers. This random pinning landscape could be due to e.g. solute atoms with a low mobility; however, the detailed nature of the pinning centers is irrelevant for our conclusions and in general one expects on the basis of the theory of depinning of elastic manifolds in random media that the microscopic details are not important LED-02 ; FIS-98 . A snapshot of the 2 system with pinning centers interacting with the dislocations LEY-10 is shown in Fig. 1.
The disorder immediately widens the phase diagram of the DDD models at a constant applied stress so that the (candidate) order parameter, shear rate, becomes a function of both the applied shear stress and the relative strengths of the pinning and the dislocation-dislocation interactions. For strong enough disorder, we find a yielding transition that agrees with a standard depinning scaling scenario, exhibiting the typical signatures of power-law distributions for both avalanche sizes and durations, with the cut-offs of the distributions displaying power-law divergences at a critical applied stress: yielding becomes depinning, and jamming becomes pinning. The set of critical exponents characterizing these distributions is found to be different from that of mean field depinning. With still stronger disorder, the collective behaviour disappears, as is indicated by the qualitative phase diagram in the inset of Fig. 1. A special point of the phase diagram corresponding to the low-disorder limit is given by the corresponding pure system ISP-14 , where the scaling behaviour is completely different from those of the above-mentioned two phases, where pinning plays a role. We next explore these two novel phases, in particular by considering the scaling properties of dislocation avalanches.
Results
In order to address and characterize the various aspects of collective dislocation
dynamics under the influence of disorder, we consider an extension of the standard
2 DDD model GIE-95 ; MIG-08 with single-slip geometry, with the additional
ingredient of a quenched pinning field, see Fig. 1 and Methods for
details. The model consists of edge dislocations with an equal number
of positive and negative Burgers vectors (with the blue and red symbols in Fig.
1 corresponding to the signs of the Burgers vectors, and
-1, respectively), interacting via their long-range anisotropic stress fields, and
gliding along the direction within a square simulation box of linear size .
The quenched pinning field is modelled by including randomly distributed
immobile pinning centers or solute atoms (black dots in Fig. 1),
interacting with the dislocations with an interaction strength . Overdamped
dynamics is assumed, such that the velocity of the th dislocation is
proportional to the total stress (with contributions from interactions with other
dislocations, pinning centers and the external stress) acting on it.
While not including all the details of full three-dimensional systems with flexible
dislocation lines CSI-07 , the model is expected to capture the essential
features of the crossover from jamming (dislocations getting stuck to each other)
to pinning (dislocations getting stuck to quenched pinning centers), and is simple
enough to allow collecting high quality statistics in numerical simulations, an
advantage of the 2 system over the 3 ones. We have verified that our results
presented below are robust with respect to changes in details of the pinning
potential - as expected on the account of the analogy with depinning models - and
are free of any clear finite-size effects detrimental to our results. Following the
standard procedure of DDD simulations MIG-02 , initially random arrangements
of dislocations are first let to relax in zero external stress, ,
to reach metastable arrangements. Then, the external stress is swithed on, and the
time-evolution of the system is monitored.
Depinning transition of the dislocation ensemble.
Dislocation dynamics in a disordered background is expected to be
complicated, with transients and relaxations typical of glassy systems as is the case
also for the depinning of elastic manifolds. The first issue we explore is the
response of the system to a constant external stress at zero
temperature (”constant control parameter”). In the steady state, the number of
dislocations is within a rectangular system of
linear size (with the magnitude of the Burgers vector of the dislocations).
To tune the pinning strength, we vary the number of pinning centers/solutes in the
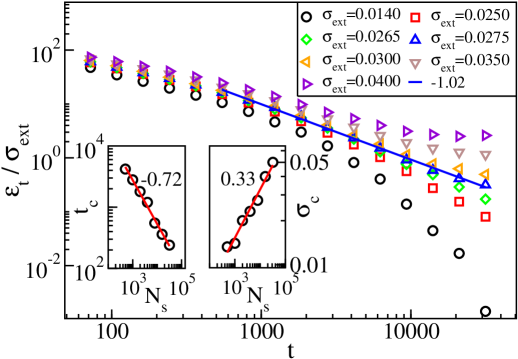
range and set . Fig. 2 shows that the
time-dependent strain rate (the “order parameter”) decays exponentially to zero
for small , while for larger a crossover to
a steady state with a non-zero -dependent can be
observed. For an intermediate, critical value
, decays as a power law of time,
, with . Thus, quenched disorder
changes the large-scale dynamics of the system, as for a pure system one obtains the
well-known 2 Andrade law exponent MIG-02 . The
-exponent has a value close to the mean-field depinning one (unity), but a
glance at the insets of Fig. 2 reveals that the collective dislocation
dynamics is not as simple as that would suggest. The cross-over time to
the power-law relaxation regime decreases with increasing number of pinning
sites, and the critical stress obviously increases with .
Important is, however, that both the scalings are power-law -like. The behavior of
implies that the dislocations sample the quenched
landscape collectively: the power-law relation is not linear in but scales
with an exponent smaller than unity, close to 1/3. This is typical of random
manifolds, as is seen from Larkin length arguments in many cases MOR-04 .
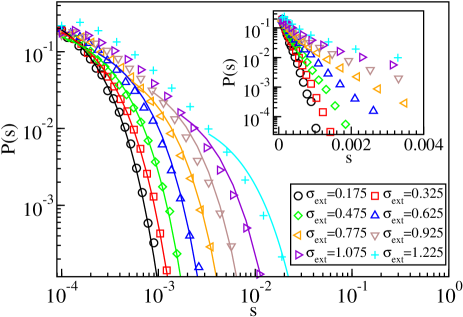
Dislocation avalanches. Then we proceed to study deformation avalanches as a typical, experimental signature of criticality. Similarly to a micro-pillar compression experiment UCH-09 ; DIM-06 or recent numerical studies of the pure DDD model ISP-14 , we apply an adiabatic stress-ramp protocol such that individual, consequtive avalanches can be identified and analyzed. Thus we can follow the evolution of the deformation bursts all the way up to the yield stress. Starting as before from a relaxed configuration, is increased at a slow constant rate (we consider -values ranging from to ), until the collective dislocation velocity increases above a small threshold value . We define an avalanche as a continuous occurrence of , and keep constant until falls again below . The total strain increment accumulated during such an avalanche is taken to be the avalanche size , and we also consider the statistics of the avalanche durations . Once and the avalanche has finished, the stress is again ramped up at a rate until the next avalanche is triggered.
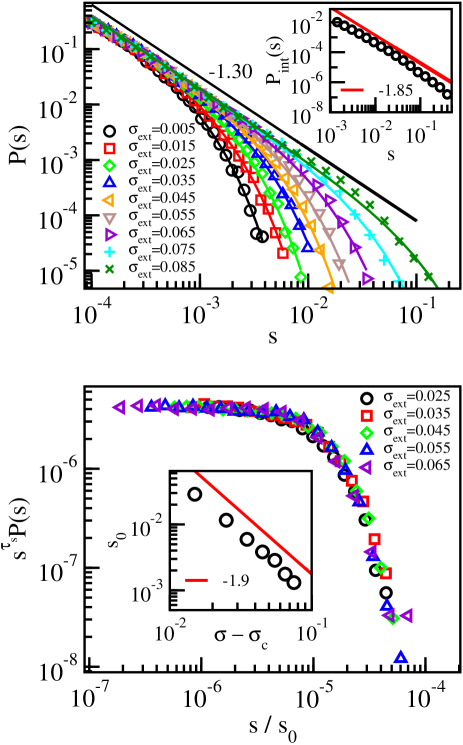
The results obtained in the limit of a small threshold value in Fig. 3 show that the data is described by the scaling
| (1) |
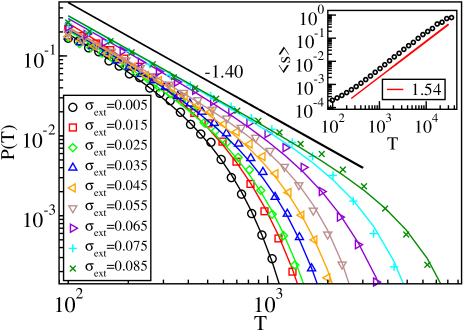
where and , with . Notice that this behaviour, while in agreement with the standard depinning scaling picture, is fundamentally different from that observed in the corresponding pure system, where is proportional to the exponential of the applied stress, , and the power law exponent has a lower value ISP-14 . We have checked that , as well as the cutoff of the distribution of slip , are independent of the system size (see Supplementary Figs. S1 and S2). The latter result is again in contrast to the pure system results, where the slip distribution cutoff was found to exhibit a power law dependence on the number of dislocations or the system size ISP-14 . Our estimates of and are close but not equal to their mean-field depinning values ( and 2, respectively) FIS-98 . The inset of the upper panel of Fig. 3 shows the stress-integrated distribution , with . obeys within errorbars the scaling relation DUR-06_2 and is also in reasonable agreement with the exponent value describing the distribution of dissipated energy during avalanches obtained from a minimal automaton model of 2 crystal plasticity SAL-11 . It is worth noting that the range in which such critical scaling applies here (for the parameters and chosen in order to reduce any “transient time” as seen in the simulations with constant external stress, and to ensure a significant difference wrt. the disorder-free system) is very wide in external stress or the control parameter, in agreement with experiments. We have checked the robustness of our results by considering three different values for , all corresponding to the “pinning” phase in Fig. 1: all cases yield the same exponent characterizing the avalanche size distributions (see Supplementary Fig. S3). Similar conclusions are reached when looking at the avalanche durations, . Again (Fig. 4), a wide scaling regime ensues. The data now indicates a -scaling with . The inset of Fig. 4 shows that the usual duration vs. size -relation of crackling noise holds, in that with LAU-06 . Both these last exponents in particular, and , have values clearly different from their mean-field depinning counterparts (2 for both and ).
Above we have shown that a depinning-like criticality can be established by fixing suitable, non-zero values for the disorder strength parameters and . Obviously, by lowering one approaches the disorder-free case of dislocation jamming. We do not look at the interesting issue how crossing the phase boundary looks like when moving from jamming to pinning (or vice versa). One would expect a kind of “Larkin length” to ensue, such that when a dislocation avalanche spans a large enough area to explore the random impurity landscape, it would show depinning-like characteristics instead of those related to jamming, consider again the insets of Fig. 2. It is a natural question to ask what happens if in the competition between long-range dislocation-dislocation interactions and the local effect of the pinning sites/solute atoms the latter starts to dominate. In Fig. 5 we show the outcome for , , such that the forces experienced by the dislocations due to quenched pinning are much larger than those due to dislocation interactions. Now, all signs of power-law like avalanche activity are absent, and an exponential distribution is found, , where and . Note that as expected, given the change of the , the avalanche sizes are now much more limited than in Fig. 3, see also Supplemetary Movies 1 and 2, showing examples of the intermediate and strong disorder cases, respectively. A similar avalanche size-limiting effect due to strong pinning has been shown for superconducting vortex avalanches OLS-97 . This result confirms the third, strong-disorder phase stipulated in the phase diagram in Fig. 1.
Discussion
In summary, we have studied the dynamics of 2 dislocation assemblies in the presence of disorder. The model has a phase diagram (see Fig. 1) that contains three phases. As a special case one has the usual disorderless one ISP-14 , and then two where quenched disorder is important: A strong disorder one where collective dynamics does not exist, and another one with critical behavior typical of the depinning of elastic manifolds, and with a set of exponents different from the mean-field limit of this class of systems, despite the long-range nature of the dislocation interactions. Our results leave fundamental questions about the phase diagram presented. We have argued that the mixing of long-range interactions and disorder leads to two new phases, one in which dislocation interactions are partly screened leading to depinning-like criticality with non-trivial exponents, and another where critical behavior is absent due to strong screening. The fundamental issues concern now the details of the phase diagram, the cross-overs from jamming to pinning and vice versa, and the precise location of the point where the jammed, pinned, and the flowing phase meet.
Which of the three phases is observed for a specific crystal should depend on the densities of dislocations and pinning centers, and on the pinning strength induced by the latter: the fluctuating dynamics of a mobile dislocation is controlled by the spatial fluctuations of the forces of different origin experienced by it as it moves, i.e. those originating from dislocation interactions (a dynamic quantity), or from interactions with the static pinning centers. For instance, decreasing the dislocation density in a system with a fixed concentration and strength of pinning centers will eventually lead to a situation where pinning forces experienced by the dislocations dominate over those due to dislocation interactions. Another consequence of adding a quenched pinning field is given by the introduction of a microscopic disorder length-scale to the otherwise scale-free dislocation system, implying that the disordered dislocation system is not in the “similitude regime” ZAI-14 : an extreme manifestation of this is given by the lack of scale invariance of the strain bursts for very strong disorder.
Our study has been confined to the 2 case for the basic reason that 3 DDD models are numerically extremely challenging. There, in the absence of disorder, mean-field -like exponents have been claimed - although stress-resolved avalanche distributions were not considered in CSI-07 - and it follows naturally from our results that one expects to find the two screened phases also there with the introduction of point-like pinning centers. In 3 systems, further complications may arise due to forest hardening: immobile dislocations on inactive slip systems could have a similar effect as our quenched pinning centers, possibly leading to pinning-dominated dislocation dynamics even in the absense of additional impurities such as solute atoms or precipitates. In BCC metals, also sufficiently strong Peierls barriers may have a similar effect. Two-dimensional systems such as colloidal crystals PER-05 may provide relevant experimental systems to directly test our results. Note that a similar set of exponents to the one observed here for the intermediate disorder strength case was found very recently in a 2 amorphous plasticity model BUD-13 , suggesting a possibility of a broad universality class of plastic deformation where microscopic details are irrelevant.
A most important practical conclusion is that the microstructure of materials with dislocation activity may induce discrete qualitative changes in the bursty dynamics: jamming or pinning. The depinning phase should give rise to usual phenomena such as thermally assisted creep CHA-00 and glassy relaxation CUG-96 which relate to the critical exponents of the transition, and where the spatial correlations (point- or line-like and so forth) of the disorder are relevant. An obvious further generalization is to time-dependent disorder such as diffusing solute fields WAN-00 , where phenomena such as the Portevin-Le Chatelier effect should ensue POR-23 ; ZAI-97 .
Methods
2D DDD model with pinning. The DDD model we study is a development to other models studied in the literature GIE-95 ; MIG-08 , with the addition of a random arrangement of quenched pinning centers. It represents a cross section ( plane) of a single crystal with a single slip geometry and straight parallel edge dislocations along the axis. The edge dislocations glide along directions parallel to their Burgers vectors , where is the magnitude and is the unit vector along the axis. Equal numbers of dislocations with positive and negative Burgers vectors are assumed, and dislocation climb is not considered: The latter is a good approximation in low temperatures KER-12 ; BAK-07 . The dislocations interact with each other through their long-range stress fields, , where , with the shear modulus and the Poisson ratio of the material. In addition, we consider a random arrangement of immobile solute atoms interacting with the dislocations via short-range interactions. To this end, we use the regularized interaction energy derived from non-local elasticity WAN-90 , expressed in polar coordinates for the th dislocation with sign as
| (2) |
where is the misfit area, , and is the atomic distance WAN-90 . This regularized form of the interaction energy removes the singularity at . Other short-range pinning potentials should lead to similar results: we have checked that this is true for Gaussian pinning centers with (see Supplementary Fig. S4). The corresponding interaction force acting on the dislocations due to a solute atom is then given by .
Thus, the overdamped equations of motion of the dislocations read
with the velocity and the sign of the th dislocation, the dislocation mobility (implicitly including effects due to thermal fluctuations), and is external stress. The dislocation-solute force decays with distance as (while the dislocation-dislocation force ), and we introduce a cut-off distance (corresponding typically to two times the average dislocation-dislocation distance) beyond which the dislocation-solute interaction is set to zero. At the cut-off distance, the dislocation-solute interaction is several orders of magnitude smaller than typical dislocation-dislocation interactions, and thus has a negligible effect on dislocation dynamics. The equations of motion are integrated with an adaptive step size fifth order Runge-Kutta algorithm, by measuring lengths in units of , times in units of , and stresses in units of , and by imposing periodic boundary conditions in the direction. Two dislocations of opposite sign with a mutual distance smaller than are removed from the system, to include a mechanism for dislocation annihilation in the model.
The simulations are started from a random initial configuration of dislocations within a square cell of linear size . These initial states are first relaxed with , to reach metastable dislocation arrangements; Fig. 1 shows a local detail of such a system. After the annihilations during the relaxation, dislocations remain. Then, an external stress is turned on, and the evolution of the system is monitored by measuring the time dependence of various quantities, such as the strain rate, . In the simulations, we consider the effect of varying both the dislocation-solute interaction strength and the solute density . In the absence of correlations, measures the relative strength of disorder, compared to the dislocation interactions. The range of values considered for the disorder is and , giving . The results are averaged over a large number of realizations for each set of parameters, ranging from 500 to 6000.
References
- (1) Sethna, J. P., Dahmen, K. A. & Myers, C. R. Crackling Noise. Nature 410, 242-250 (2001).
- (2) Zaiser, M. Scale invariance in plastic flow of crystalline solids. Adv. Phys. 55, 185-245 (2006).
- (3) Alava, M. J., Laurson, L. & Zapperi, S. Crackling noise in plasticity. Eur. Phys. J. Special Topics 223, 2353-2367 (2014).
- (4) Ananthakrishna, G. Current theoretical approaches to collective behavior of dislocations. Phys. Rep. 440, 113-259 (2007).
- (5) Uchic, M. D., Shade, P. A. & Dimiduk, D. M. Plasticity of micromater-scale single crystals in compression. Annu. Rev. Mater. Res. 39, 361-386 (2009).
- (6) Dimiduk, D. M., Woodward, C., LeSar, R. & Uchic, M. D. Scale-Free Intermittent Flow in Crystal Plasticity. Science 312, 1188-1190 (2006).
- (7) Csikor, F. F., Motz, C., Weygand, D., Zaiser, M., & Zapperi, S. Dislocation Avalanches, Strain Bursts, and the Problem of Plastic Forming at the Micrometer Scale. Science 318, 251-254 (2007).
- (8) Weiss, J. & Grasso, J.-R. Acoustic Emission in Single Crystals of Ice. J. Phys. Chem. B 101, 6113-6117 (1997).
- (9) Miguel, M.-C., Vespignani, A., Zapperi, S., Weiss, J. & Grasso, J.-R. Intermittent dislocation flow in viscoplastic deformation. Nature 410, 667-671 (2001).
- (10) Durin, G. & Zapperi, S. [The Barkhausen effect] The Science of Hysteresis [Bertotti, G. & Mayergoyz, P. (eds.)] [181-267] (Academic, Amsterdam, 2006).
- (11) Le Doussal, P., Wiese, K. J. & Chauve, P. Two-loop functional renormalization group theory of the depinning transition. Phys. Rev. B 66, 174201 (2002).
- (12) Rosso, A., Le Doussal, P. & Wiese, K. J. Avalanche-size distribution at the depinning transition: A numerical test of the theory. Phys. Rev. B 80, 144204 (2009).
- (13) Miguel, M.-C., Vespignani, A., Zaiser, M. & Zapperi, S. Dislocation Jamming and Andrade Creep. Phys. Rev. Lett 89, 165501 (2002).
- (14) Laurson, L., Miguel, M.-C. & Alava, M. J. Dynamical Correlations near Dislocation Jamming. Phys. Rev. Lett. 105, 015501 (2010).
- (15) Jamming and Rheology [Liu, A. J. & Nagel, S. R. (eds.)] (Taylor and Francis, London, 2001).
- (16) Laurson, L. & Alava, M. J. Dynamic Hysteresis in Cyclic Deformation of Crystalline Solids. Phys. Rev. Lett. 109, 155504 (2012).
- (17) Ispánovity, P. D., Groma, I., Györgyi, G., Szabó, P. & Hoffelner, W. Criticality of Relaxation in Dislocation Systems. Phys. Rev. Lett. 107, 085506 (2011).
- (18) Ispánovity, P. D. et al. Avalanches in 2D Dislocation Systems: Plastic Yielding Is Not Depinning. Phys. Rev. Lett. 112, 235501 (2014).
- (19) Fisher, D. S. Collective transport in random media: from superconductors to earthquakes. Phys. Rep. 301, 113-150 (1998).
- (20) Zapperi, S. & Zaiser, M. Depinning of a dislocation: the influence of long-range interactions. Mat. Sci. Eng. A 309-310, 348-351 (2001).
- (21) Moretti, P., Miguel, M.-C., Zaiser, M. & Zapperi, S. Depinning transition of dislocation assemblies: Pileups and low-angle grain boundaries. Phys. Rev. B 69, 214103 (2004).
- (22) Courtney, T. H. Mechanical Behavior of Materials. (McGraw-Hill, New York, 1990).
- (23) Blatter, G., Feigel’man, M. V., Geshkenbein, V. B., Larkin, A. I. & Vinokur, V. M. Vortices in high-temperature superconductors. Rev. Mod. Phys. 66, 1125 (1994).
- (24) van der Giessen, E. & Needleman, A. Discrete dislocation plasticity: a simple planar model. Modelling Simul. Mater. Sci. Eng. 3, 689 (1995).
- (25) Miguel, M.-C., Laurson, L. & Alava, M. J. Material yielding and irreversible deformation mediated by dislocation motion. Eur. Phys. J. B 64, 443-450 (2008).
- (26) Leyson, G. P. M., Curtin, W. A., Hector Jr, L. G. & Woodward, C. F. Quantitative prediction of solute strengthening in aluminium alloys. Nature Mater. 9, 750-755 (2010).
- (27) Durin, G. & Zapperi, S. The role of stationarity in magnetic crackling noise. J. Stat. Mech. P01002 (2006).
- (28) Salman, O. U. & Truskinovsky, L. Minimal Integer Automaton behind Crystal Plasticity. Phys. Rev. Lett. 106, 175503 (2011).
- (29) Laurson, L. & Alava, M. J. noise and avalanche scaling in plastic deformation. Phys. Rev. E 74, 066106 (2006).
- (30) Olson, C. J., Reichhardt, C. & Nori, F. Superconducting vortex avalanches, voltage bursts, and vortex plastic flow: Effect of the microscopic pinning landscape on the macroscopic properties. Phys. Rev. B 56, 6175 (1997).
- (31) Zaiser, M. & Sandfeld, S. Scaling properties of dislocation simulations in the similitude regime. Modelling Simul. Mater. Sci. Eng. 22, 065012 (2014).
- (32) Pertsinidis, A. & Ling, X. S. Video microscopy and micromechanics studies of one- and two-dimensional colloidal crystals. New J. Phys. 7, 33 (2005).
- (33) Budrikis, Z. & Zapperi, S. Avalanche localization and crossover scaling in amorphous plasticity. Phys. Rev. E 88, 062403 (2013).
- (34) Chauve, P., Giamarchi T., & Le Doussal, P. Creep and depinning in disordered media. Phys. Rev. B 62, 6241 (2000).
- (35) Cugliandolo, L. F., Kurchan, J. & Le Doussal, P. Large time out-of-equilibrium dynamics of a manifold in a random potential. Phys. Rev. Lett. 76, 2390 (1996).
- (36) Wang., Y., Srolovitz, D. J., Rickman, J. M. & LeSar, R. Dislocation motion in the presence of diffusing solutes: a computer simulation study. Acta Mater. 48, 2163-2175 (2000).
- (37) Portevin, A. & Le Châtelier, F. Sur un phenomene observe lors de l’essai de traction d’alliages en cours de transformation. Comp. Rend. Acad. Sci. Paris 176, 507–510 (1923).
- (38) Zaiser, M. & Hähner, P. Oscillatory Modes of Plastic Deformation: Theoretical Concepts. Phys. Stat. Sol. B 199, 267-330 (1997).
- (39) Keralavarma, S. M., Cagin, T., Arsenlis, A. & Benzerga, A. A. Power-Law Creep from Discrete Dislocation Dynamics. Phys. Rev. Lett. 109, 265504 (2012).
- (40) Bakó, B., Groma, I., Györgyi, G. & Zimányi, G. T. Dislocation glasses: aging during relaxation and coarsening. Phys. Rev. Lett. 98, 075701 (2007).
- (41) Wang, R. Non-local elastic interaction energy between a dislocation and a point defect. J. Phys. D: Appl. Phys. 23, 263 (1990).
Supplementary Information is linked to the online version of the paper
Acknowledgements
P. Ispánovity, M. Zaiser, S. Zapperi, and I. Groma are
thanked for discussions. We acknowledge the financial support of the Academy
of Finland through an Academy Research Fellowship (L.L., project no. 268302) and
the Centres of Excellence Program (project no. 251748). The numerical simulations
presented above were performed using computer resources within the Aalto University
School of Science “Science-IT” project.
Author contributions
M.O., L.L. and M.J.A designed the study. M.O. performed the numerical modelling
and data analysis. L.L. wrote the first draft of the manuscript.
All authors contributed to improve the manuscript.
Competing financial interests
The authors declare no competing financial interests.