Magnetic properties and Mott transition in the Hubbard model on the anisotropic triangular lattice
Abstract
Magnetic properties and Mott transition are studied in the Hubbard model on the anisotropic triangular lattice described by two hopping parameters and in different spatial directions using the variational cluster approximation. Taking into account Néel (AF), 120∘ Néel (spiral), and collinear (AFC) orderings, the magnetic phase diagram is analyzed at zero temperature and half-filling. We found six phases, AF-metal, AF-insulator, spiral, AFC, paramagnetic metal, and non-magnetic insulator, which is the candidate of spin liquid. Direct transitions from paramagnetic metal to AF insulator take place for , and non-magnetic insulator is realized between the paramagnetic metal and magnetic states for . Around , magnetic state (AFC or spiral) is realized above the paramagnetic metal, and as the on-site Coulomb repulsion increases, it changes to non-magnetic insulator. Implications for the -(BEDT-TTF)2Cu2(CN)3 are discussed. As for the Mott transition, the structure of the self-energy in the spectral representation is studied in detail. As increases around the Mott transition point, single dispersion evolves in the spectral weights of the self-energy, which yields the Mott gap.
pacs:
71.30.+h, 71.10.Fd, 71.27.+aI Introduction
When kinetic and Coulomb repulsion energies are competing, low dimensional materials with geometric frustration exhibit rich phenomena like superconductivity with various pairing symmetries and purely paramagnetic insulator (spin liquid), which attract a lot of experimental and theoretical interests. The organic charge-transfer salts -(BEDT-TTF) lefebvre00 ; shimizu03 ; kanoda3 ; manna are good examples of such materials, where a transition from paramagnetic metal to spin liquid (Mott transition) has been detected with X=Cu2(CN)3. kanoda3 ; manna
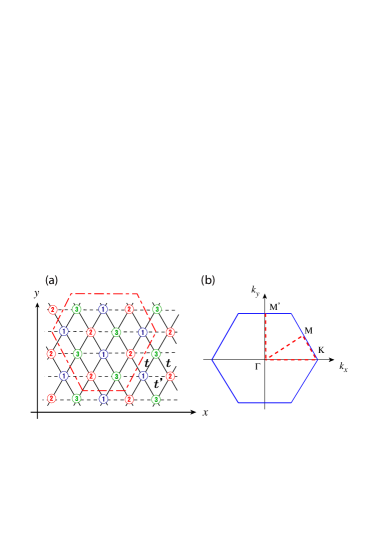
One of the important theoretical issues motivated by these experimentskanoda3 ; manna is the possibility of spin liquid phase compatible with experiments in the Hubbard model on the anisotropic triangular lattice described by the hopping , , and the on-site Coulomb repulsion (see Fig. 1(a)), which is a simple effective Hamiltonian of these materials and has been studied by various non-perturbative methods. imada ; kyung ; senechal-af ; clay ; tocchio ; Kokalj ; kawakami ; senechal ; mila ; antipov ; watanabe ; becca
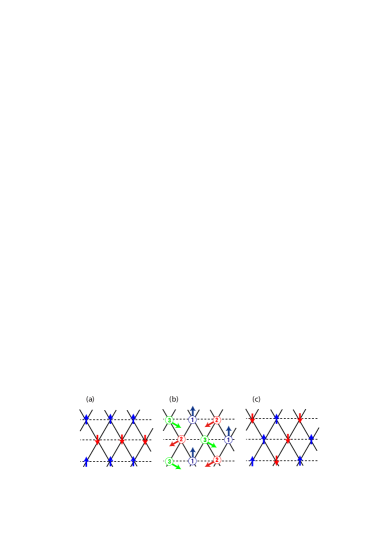
The earlier studiesimada ; kyung ; senechal-af ; clay ; tocchio ; Kokalj reported that non-magnetic insulator, which is the candidate of spin liquid, is realized near the isotropic point , however 120∘Néel (see Fig. 2 (b)), which is the most relevant magnetic ordering around , was not considered in them. Taking into account 120∘ Néel, the isotropic case is studied by the path integral renormalization group (PIRG),kawakami variational cluster approximation (VCA),senechal and using effective models,mila ; antipov where the PIRG studykawakami predicted that non-magnetic insulator is realized for , and the other studiessenechal ; mila ; antipov also suggested the existence of non-magnetic insulator phase. For example, the VCA studysenechal argued that non-magnetic insulator is realized at least at . More generic ranges of are studied including 120∘ Néel by the variational Monte Carlo (VMC),watanabe ; becca where non-magnetic insulator is not found in the region and in the older studywatanabe , while the later studybecca showed that non-magnetic insulator is not obtained at , but it is realized around for . Therefore the conclusions about non-magnetic insulator in this model are very different not only depending on the approaches but also within the same approach.
In this paper, we investigate the magnetic properties and Mott transition in the Hubbard model on the anisotropic triangular lattice using VCA,Senechal00 ; Potthoff:2003-1 ; Potthoff:2003 which is formulated based on a rigorous variational principle and exactly takes into account the short-range correlations. The 12-site cluster in the dash-dotted hexagon in Fig. 1 (a) is used and the three magnetic orderings, Néel, 120∘ Néel, and collinear in Fig. 2, which are referred to as AF, spiral, and AFC hereafter, are considered to analyze the magnetic phase diagram at zero temperature and half-filling.
We found six phases, AF-metal, AF-insulator, spiral, AFC, paramagnetic metal, and non-magnetic insulator, which is the candidate of spin liquid. AF-metal is realized for and relatively small . Direct transitions from paramagnetic metal to AF-insulator take place for around . For paramagnetic metal changes to non-magnetic insulator at , thus the (purely paramagnetic) Mott transition takes place there, and this non-magnetic insulator become magnetic state at . Around , magnetic state (AFC or spiral) is realized above the paramagnetic metal, and it changes to non-magnetic insulator as increases.
Implications of our analysis for experiments on the organic charge-transfer salts -(BEDT-TTF) are discussed. As for the Mott transition, the structure of the self-energy in the spectral representation is studied in detail. As increases around the Mott transition point, single dispersion evolves in the spectral weights of the self-energy, which gives rise to the splitting of the non-interacting band into the upper and lower Hubbard bands.
II Hubbard model on the anisotropic triangular lattice
The Hamiltonian of the Hubbard model on the anisotropic triangular lattice reads
| (1) |
where for the solid lines and for the dashed lines in Fig. 1 (a), is the on-site Coulomb repulsion, and is the chemical potential. The annihilation (creation) operator for an electron at site with spin is denoted as () and . The energy unit is set as hereafter.
In our analysis we use VCA,Senechal00 ; Potthoff:2003-1 ; Potthoff:2003 which is an extension of the cluster perturbation theorySenechal00 based on the self-energy-functional approach.Potthoff:2003 This approach uses the rigorous variational principle for the thermodynamic grand-potential written in the form of a functional of the self-energy as
| (2) |
In Eq. (2), is the non-interacting Green’s function of , is the Legendre transform of the Luttinger-Ward functional,lw and the index denotes the explicit dependence of on all the one-body operators in . The variational principle leads to the Dyson’s equation. Eq. (2) gives the exact grand potential for the exact self-energy of , which satisfies Dyson’s equation.
All Hamiltonians with the same interaction part share the same functional form of , and using that property can be evaluated for the self-energy of a simpler Hamiltonian by exactly solving it, though the space of the self-energies where is evaluated is now restricted to that of . In VCA, one uses for a Hamiltonian formed of clusters that are disconnected by removing hopping terms between identical clusters that tile the infinite lattice. For , the grand potential is expressed as a functional of as
| (3) |
where is the non-interacting Green’s function of and denotes all the one-body operators in . In Eqs. (2) and (3), is the same for a given since the interaction part is the same for and , therefore subtracting Eq. (3) from Eq. (2), we obtain
| (4) | |||||
which is a functional relation between and . In Eq. (4) and are exactly computed for by exactly solving it, thus is evaluated for the exact self-energy of , and becomes a function of expressed as
where is the exact grand potential of and the functional trace has become an integral over the diagonal variables (frequency and super-lattice wave vectors) of the logarithm of the determinant over intra-cluster indices. The frequency integral is carried along the imaginary axis and .
The variational principle is reduced to the stationary condition , and its solution and the exact self-energy of at the stationary point, denoted as , are the approximate grand-potential and self-energy of in VCA. Physical quantities, such as expectation values of one-body operators, are evaluated using the Green’s function . In VCA, the restriction of the space of the self-energies into that of is the only approximation involved and short-range correlations within the cluster are exactly taken into account since is solved exactly. A possible symmetry breaking is investigated by including in the corresponding Weiss field that will be determined by minimizing the grand-potential .
In our analysis, the 12-site cluster of the diamond shape in the dash-dotted hexagon in Fig. 1(a), which is referred to as 12D hereafter, is used to set up the cluster Hamiltonian . This cluster treats the three sub-sites 1,2, and 3 on the same footing, and has even number of sites so that energy eigenstates with total , which is satisfied for the non-magnetic ground states of the infinite system , are included as candidates of the grand states of . To study the magnetic orderings AF, spiral, and AFC, the Weiss field
| (5) |
with the spin operator is included into , where the index specifies the site in the unit cell in the sub-lattice formalism, and for spiral, and for AF and AFC. The unit vectors are oriented at 120∘ of each other for spiral, and for AF and AFC according to these spin orderings (see Fig. 2). In our analysis the pitch angle of spiral order is fixed to be 120∘ even for .
In the stationary point search of , which we denote as the grand-potential per site, the Weiss field parameter and the cluster chemical potential in are treated as the variational parameters, where should be included for the thermodynamic consistency.aichhorn During the search, the chemical potential of the system is also adjusted so that the electron density is equal to 1 within 0.1%. In general, a stationary solution with corresponding to the magnetically ordered state and that with corresponding to the paramagnetic state (PM) are obtained, and the energies per site are compared for AF, spiral, AFC, and PM to determine the ground state. The density of state per site
| (6) |
is also calculated to examine the gap, where is the number of the sites in the unit cell in the sense of the sub-lattice formalism ( for spiral, for AF and AFC, and for PM), and the integration is over the corresponding Brillouin zone. In Eq. (6), limit is evaluated using the standard extrapolation method by calculating for , , and . The numerical error after this extrapolation is estimated to be of order , so the gap is identified as the region of around where the extrapolated is less than . We also compute the magnetic order parameter per site
and the double occupancy per site
where and are the expectation values of and , respectively.
III Phase diagram
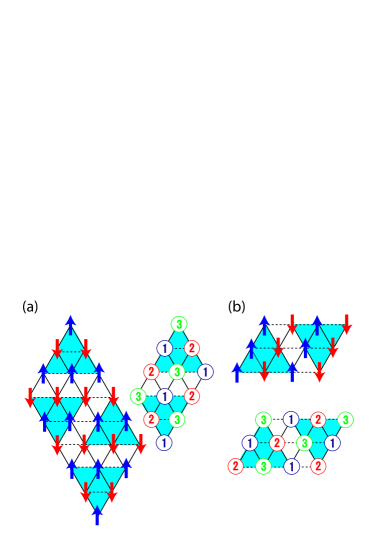
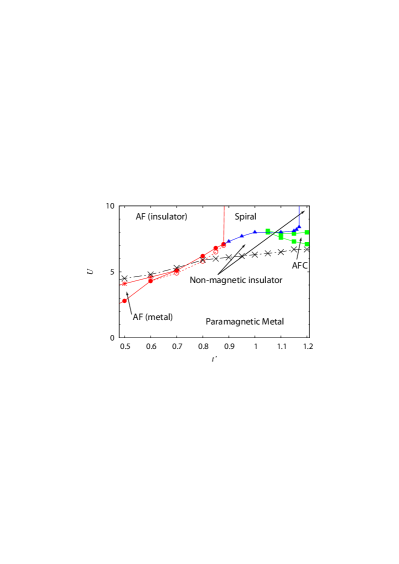
Fig. 3 shows the phase diagram at zero temperature and half-filling obtained by VCA on 12D cluster, where the filled circles, triangles, and squares correspond to the AF, spiral, and AFC transition points and the two asterisks at and denote the transition points from AF insulator to AF metal. Energetically disfavored AF solutions are obtained between the unfilled and filled circles, and except this region, energetically disfavored magnetic solutions (AF, spiral, or AFC) are not obtained inside the non-magnetic phases. The crosses are the Mott transition points computed assuming that no magnetic order is allowed (i.e. = 0). The magnetic order parameters and Mott gaps are shown in Fig. 4. Near , the magnetic transition point is relatively low and the similar phase diagram is obtained also in the mean field study.kino
Non-magnetic insulator is realized above the Mott transition line for , and it changes into magnetic states as increases. Non-magnetic insulator phase exists also for and above AFC. These non-magnetic insulator phases are the candidates of spin liquid. In Fig. 3 the line between AF and spiral phases will actually not be a phase boundary and AF will gradually change to spiral via complicated (probably incommensurate) magnetic orderings as increases. These more complicated states will give local minimums (i.e. stationary solutions) with our choice of the Weiss fields given by Eq. (5) since they will have orderings similar to AF or spiral, but their actual energies might be lower than the values computed with our Weiss fields. So these states may appear, not only as ground states, but also as energetically disfavored solutions, which may turn out to be ground states by more appropriate choice of Weiss fields. However, these energetically disfavored solutions are obtained only in the restricted region between the filled and unfilled circles in Fig. 3, and most of the non-magnetic insulator phase in that phase diagram remains stable even if these energetically disfavored solutions become ground states with complicated magnetic orderings.
For and , AFC appears in addition to spiral so the magnetic orderings in this region will have both spiral and AFC like features. Around spiral disappears and AFC remains, which suggests that in the region the correlations along direction become important, probablly because the system begins to evolve towards weakly coupled one-dimensional chains, so this region is not investigated in this study.
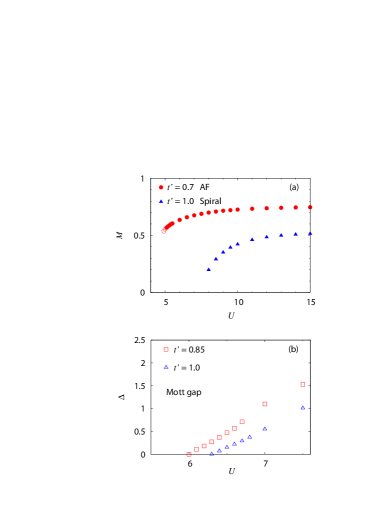
In Fig. 3, the transition from the non-magnetic to magnetic states is of the second order except for since there exists no energetically disfavored magnetic solution outside the magnetic phase except this range. If the energetically disfavored solutions in this range are magnetic ground states as is discussed above, the magnetic transition is of the second order for all . The Mott transition is of the second order since there is no energetically disfavored paramagnetic solution near the transition line and the Mott gap closes continuously at the transition point as is shown in Fig. 4 (b).
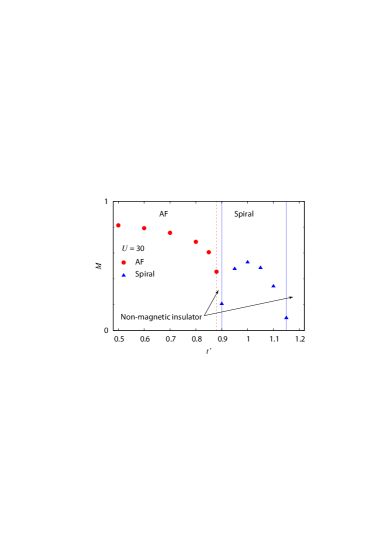
We have investigated the magnetic properties up to . Fig. 5 shows the AF (filled-circles) and spiral (filled-triangles) order parameters at as functions of . The non-magnetic insulator phase above AFC in Fig. 3 persists up to large . The magnetic phase (AF and spiral) covers whole the region up to . For there appears a very narrow slit of non-magnetic insulator phase around (between the dotted and full lines) where no magnetic solution (including energetically disfavored one) is obtained.
Our Fig. 5 is qualitatively very similar to Fig. 4 in Ref. trumper, obtained by the spin wave theory taking into account, not only AF, spiral, and AFC but also general magnetic ordering vectors including incommensurate ones. In that figure is equal to in the large limit and their collinear corresponds to the ordering similar to our AF. The point where the magnetic order parameter vanishes is obtained in the region also in the spin wave theory considering general magnetic ordering vectors. A narrow non-magnetic phase is found near in the modified spin wave theory complemented by exact diagonalizations.hauke
Here we remark that only the three magnetic orderings AF, spiral (of 120∘ pitch angle), and AFC (i.e., only the three magnetic ordering vectors in the sense of the spin wave) are considered in our analysis and our Weiss fields will not be able to detect magnetic orderings very different from the above three. For example, magnetic orderings whose modulation period does not fit into the cluster size are not investigated well in VCA and we can not exclude the possibility that such magnetic orderings are realized in the non-magnetic phase found in Figs. 3 and 5. Later we further compare quantitatively our results in Fig. 5 with recent non-perturbative analyses of the Heisenberg model which studied the possibility of general spiral order in addition to our 120∘ spiral.
Next we consider the cluster size dependence of our phase diagram. In general, ordered phase shrinks as the cluster size increases since spatial fluctuations, which destabilize ordered states, are better simulated on larger clusters. However, when magnetic ordering is rather suppressed, wave functions with small magnetic fluctuations realized on larger clusters play an important role to examine near the true minimum of the effective potential, thus ordered phase may become wider as the cluster size increases. The critical interaction strength of the metal-insulator transition (denoted by the crosses in Fig. 3) decreases as the cluster size increases, since the average kinetic energies are lower on larger cluster and metal is stabilized.
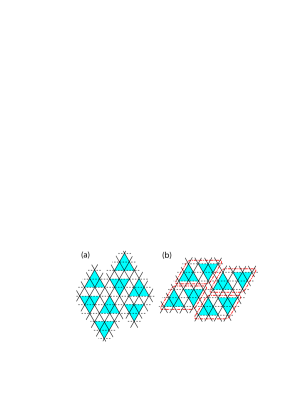
To see in detail the cluster size dependence, first we analyze the phase diagram by VCA on the triangular 6-site cluster. To study AF, spiral, and AFC, we combined two and four 6-site clusters as depicted in Fig. 6 to recover the lattice geometry in the presence of the magnetic orderings and then tiled the infinite lattice with them as in Fig. 7. In these cases the Green’s function of the combined cluster is given by
| (7) |
where is the exact Green’s function on each 6-site cluster (the site and spin indices suppressed) and is the hopping matrix linking these 6-site clusters. The Hamiltonian on the triangular 6-site cluster is exactly diagonalized in all cases therefore the correlations within the 6-site clusters (shaded triangle clusters in Figs. 6 and 7) are exactly taken into account.
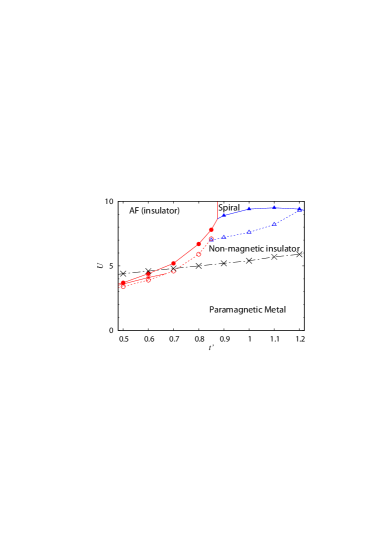
Fig. 8 shows the phase diagram at zero temperature and half-filling obtained by VCA on the 6-cluster, where the filled circles and triangles correspond to the AF and spiral transition points. AFC phase is not realized in this parameter space. Energetically disfavored AF and spiral solutions are obtained between the filled and unfilled marks. The two asterisks at and denote the points where AF gap closes for energetically disfavored solutions. The crosses are the Mott transition points computed assuming that no magnetic order is allowed.
Comparing Fig. 3 and Fig. 8, the magnetic transition point is larger on the 6-site cluster for , contrary to the general arguments on the cluster size dependence, and energetically disfavored solutions are obtained in rather wide region of the parameter space, while they are not obtained except the very restricted region on 12D cluster. Therefore the true minimum of the effective potential would not be yet simulated well on the 6-site cluster and the magnetic solutions turn out to be energetically disfavored or even can not be found in Fig. 8. Mott transition line shifts upwards as the cluster size increases, which is consistent with the general argument on the cluster size dependence. Taking into account the energetically disfavored solutions, almost all the phases found on 12D cluster are also observed on the 6-site cluster and the shape of the non-magnetic insulator phase between the dotted and dash-dotted lines in Fig. 8 is more or less the same to 12D cluster for except the upward shifts.
| Magnetic phase | ||
|---|---|---|
| 34 | 6.0 | |
| 12D | 6.7 |
Next we consider the region . In this region, spiral phase disappears while AFC phase remains on 12D cluster, which suggests that the correlations along direction become important probably because the system begins to evolve towards weakly coupled one-dimensional chains. Therefore we analyze the magnetic phase diagram also using the 34 cluster in the dash-dotted parallelogram in Fig. 7 (b), which contains three 4-site chains in direction. The infinite lattice is tiled as depicted there, and only spiral (of 120∘ pitch angle) and AFC are investigated. The correlations within the 34 cluster are exactly taken into account in this study. The region of magnetic phase and Mott transition point are computed at in Table (1), comparing with the results of 12D cluster. On 34 cluster, AFC solutions are also obtained in addition to spiral in some region of the magentic phase and spiral has lower energy, while only AFC solutions are obtained on 12D. These subtle differences may arise due to the symmetry of the clusters used because the magnetic ordering in this region will have both spiral and AFC features. Even though there remains some cluster shape dependence, the general features are the same for these two clusters. Magnetic phase is realized between the paramagnetic metal and non-magnetic insulator at , and non-magentic insulator above the magnetic phase persists up to large . As was remarked previously, we can not exclude the possibility that magnetic orderings not approximated well by AFC or spiral (of 120∘ pitch angle), e.g. incommensurate spiral order suggested in the spin wave theory,trumper are realized at .
Next we examine the cluster size dependence by comparing our results with the previous VAC studysenechal on the isotropic triangular lattice (). The general considerations on the cluster size dependence suggest that the magnetic phase shrinks and Mott transition line will shift upwards in the thermodynamic limit in Fig. 3. As for the Mott transition, in the thermodynamic limit,senechal which is in fact slightly larger than our value on 12D cluster, and gives us an estimate of the upper limit of the upward shift of our Mott transition line in Fig. 3. As for spiral order, it is argued in Ref. senechal, that spiral order is absent in the thermodynamic limit at least at , which is equal to our critical interaction strength . This implies that our magnetic transition line in Fig. 3 can not shift downwards and should shift upwards. Therefore in the thermodynamic limit, the Mott transition line does not shift upwards by more than about 0.4 and the magnetic transition line shifts upwards in Fig. 3, thus the main features of the phase diagram remain almost the same except the small upwards shift, in particular non-magnetic insulator is realized above the paramagnetic metal for . (As was shown in the above discussions, our VCA study is consistent with the previous study.senechal )
Next we compare our results in Fig. 5 with the analyses of the Heisenberg model on the triangular lattice.harada ; heisenberg-order ; hauke ; heisenberg2 ; heisenberg3 Our value of the order parameter, at and , lies almost at the center of the rangeharada (computed from ), and is larger than in Refs. heisenberg-order, , which suggests that our VCA analysis on 12D cluster still exaggerates the tendency of system to order and our magnetic transition line in Fig. 3 shifts upwards in the thermodynamic limit.
In the Heisenberg model, it is argued in Ref. harada, that the incommensurate spiral order persists at least up to , which is slightly larger than our value obtained taking into account only the 120∘ spiral. Non-magnetic insulator is predictedhauke ; heisenberg2 around though the ranges of vary depending on the analyses. Our results in Fig. 5 are consistent with these analyses.hauke ; harada ; heisenberg-order ; heisenberg2 Contrary to these results,hauke ; harada ; heisenberg-order ; heisenberg2 non-magnetic insulator is not found for in Refs. heisenberg3, . So conclusions on non-magnetic insulator state in the Heisenberg model seem to be still controversial.
Next we compare our results with the PIRGkawakami and VMCwatanabe ; becca studies. In the PIRG studykawakami on the isotropic triangular lattice (), and , which are slightly larger than our values. In the older VMC analysiswatanabe the region and was studied and non-magnetic insulator phase was not found. The later VMC studybecca reported that non-magnetic insulator is not realized at the isotropic point , but it emerges around for above the magnetic phase and covers the region at . In these VMC analyseswatanabe ; becca is larger than ours (e.g., at in them), and our non-magnetic insulator phase below the magnetic states in Fig. 3 is metal in their phase diagrams. Our results in Fig. 5 are qualitatively consistent with the recent VMC studybecca in the sense that non-magnetic insulator emerges above the magnetic states around , but this non-magnetic insulator phase in the VMCbecca is significantly wider than the modified spin wave theoryhauke and ours.
As for the disordered state of -(BEDT-TTF)2Cu2(CN)3, an accurate estimation of and seems to be very difficult. For example, in Ref. salt-parameter1, while in Refs. salt-parameter2, and salt-parameter3, , and in Refs. salt-parameter1, and salt-parameter2, while in Ref. salt-parameter3, . If , the spin liquid state of this material corresponds to the non-magnetic insulator above the magnetic states in Fig. 3 or 5. Otherwise, it corresponds to the non-magnetic insulator above the metal in Fig. 3. These qualitatively different situations can be distinguished in experiments to see if the spin liquid state changes to the metal or magnetic state by applying the pressure and moving the system downwards in the phase diagram.
IV Mott transition
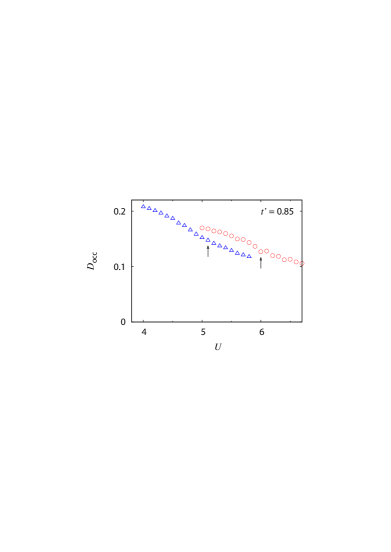
Here we study the Mott transition in detail. Fig. 9 shows the double occupancies at computed on 12D cluster (circles) and the triangular 6-site cluster (triangle) as functions of assuming that no magnetic order is allowed (i.e. ). The arrows indicate the Mott transition points. The double occupancy is smooth at the transition point and the slope around the transition point stays almost the same as the cluster size increases, thus tendency toward the first order transition was not observed.
In general, Mott transitions are predicted to be of the second order in VCAatsushi2011 ; atsushi2013 while they are predicted to be of the first order in the variational cluster approach with bath degrees of freedom. In the latter approaches, hybridization between the bath sites and cluster sites is treated as a variational parameterPotthoff2 ; Potthoff3 and the metal and insulator solutions in the coexisting region of the first order transition are different by the values of this hybridization parameter. VCA analyses do not have bath degrees of freedom and this technical difference may be the origin of the discrepancy.
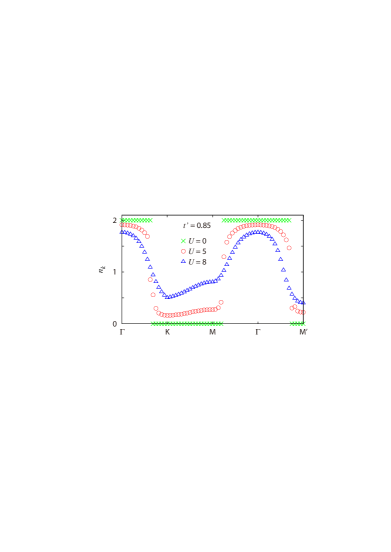
Next we analyze the spectral weight functions and related quantities. Fig. 10 shows the momentum distribution function at along the dotted line in Fig. 1(b) for (crosses), (circles), and (triangles), calculated imposing . The clear steps in in the metal () disappear in the Mott insulator ().
We further study in detail the spectral density of the self-energy, and demonstrate that single dispersion evolves in the spectral representation of the self-energy around the Mott transition point and this dispersion gives rise to the Mott gap. Before showing the numerical results, we briefly discuss the relation between the Mott gap and dispersions in the self-energy using its spectral representation.
The usual spectral density is defined by the Green’s function as
| (8) |
where is expressed as
| (9) |
in terms of the free band , , and the self-energy . The self-energy is expressed in the spectral representationl1 as
| (10) |
and its spectral density is defined by
| (11) |
For the Hamiltonian given by Eq. (1),
where is the average number per site of particles with spin in the ground state.eder1 Here we consider the paramagnetic state at half-filling and set assuming that is large. When the spectral weight is dominated by single pole of dispersion , the Green’s function is given by
| (12) |
where in is canceled by . The poles of this Green’s function are for , therefore the original band splits into the upper and lower Hubbard bands (of almost equal weights) with a gap of width .
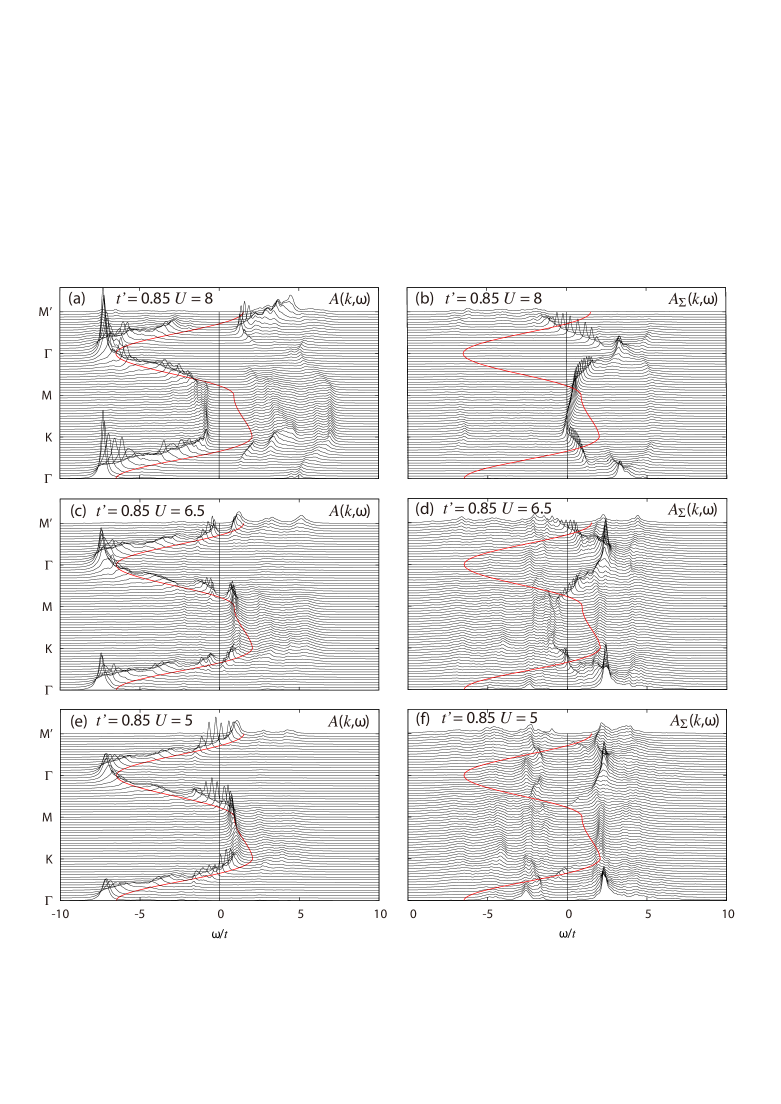
Fig. 11 shows the spectral functions and calculated on 12D cluster with at for (a) (b) , (c) (d) , and (e) (f) , assuming that no magnetic order is allowed. The non-interacting band is plotted with the full lines. At , which is slightly below the Mott transition point, small weights appear in whenever the non-interacting band (full line) crosses the Fermi energy, as is seen in (f). At , which is slightly above the Mott transition point, these weights grows and begins to form single dispersion in (d). Corresponding to this growth of the weights in at the Fermi surface, a small gap opens at the Fermi surface in in (c). In fact, as was calculated in Fig. 4 (b), a small insulating gap opens simultaneously all over the whole Fermi surface at . As increases further, this dispersion dominates in as is shown in (b), and yields the splitting of the non-interacting band into the upper and lower Hubbard band in (a).
V Summary and conclusions
In summary we have studied the magnetic properties and Mott transition in the Hubbard model on the anisotropic triangular lattice by VCA and the phase diagram is analyzed at zero temperature and half-filling. We found six phases, AF-metal, AF-insulator, spiral, AFC, paramagnetic metal, and non-magnetic insulator, which is the candidate of spin liquid. AF metal is realized for and and direct transitions from paramagnetic metal to AF insulator take place for . For paramagnetic metal changes to non-magnetic insulator at , thus the (purely paramagnetic) Mott transition takes place there, and this non-magnetic insulator become magnetic state at . Around , magnetic state (AFC or spiral) is realized above the paramagnetic metal, and it changes to non-magnetic states as increases.
The detailed comparisons of our results with those of the previous VCA studysenechal on the isotropic triangular lattice () indicate that the main features of our phase diagram Fig. 3 remain almost the same in the thermodynamic limit.
In our analysis, the three magnetic orderings AF, spiral (of 120∘ pitch angle), and AFC are considered to investigate non-magnetic states, and we can not exclude the possibility that magnetic orderings not approximated well by these orderings, e.g., magnetic orderings whose modulation period does not fit into the cluster size of VCA, are realized in the non-magnetic phase found in our study.
As for the Mott transition, the structure of the self-energy in the spectral representation is studied in detail. As increases around the Mott transition point, single dispersion evolves in the spectral weights of the self-energy, which yields the splitting of the non-interacting band into the upper and lower Hubbard bands near the Fermi level.
Note added. After submitting the paper, a related VCA study of the Hubbard model on the anisotropic triangular lattice by M. Laubach et. allaubach appeared on the preprint server. In that paper, the phase diagram is analyzed by VCA on the triangular 6-site cluster, which correspond to our Fig. 8, and the energetically disfavored solutions were not shown in that study. They also computed the Mott transition point at also on 12D cluster. Our numerical results agree with each other on the above points. In our paper, the results of the 6-site VCA (Fig. 8) was included during the revision for the systematic study of the cluster size dependence of our 12D phase diagram.
ACKNOWLEDGMENT
The author would like to thank R. Eder, K. Harada, T. Inakura, J. Kokalj, H. Kurasawa, H. Nakada, T. Ohama, Y. Ohta, K. Seki, and H. Yamamoto for useful discussions. Parts of numerical calculations were done using the computer facilities of the IMIT at Chiba University and Yukawa Institute.
References
- (1) S. Lefebvre , P. Wzietek, S. Brown, C. Bourbonnais, D. Jérome, C. Mézière, M. Fourmigué, and P. Batail, Phys. Rev. Lett. 85, 5420 (2000).
- (2) Y. Shimizu, K. Miyagawa, K. Kanoda, M. Maesato, and G. Saito, Phys. Rev. Lett. 91, 107001 (2003).
- (3) F. Kagawa, T. Itou, K. Miyagawa, and K. Kanoda, Phys. Rev. B 69, 064511 (2004).
- (4) R.S. Manna, M. de Souza, A. Brühl, J.A. Schlueter, and M. Lang, Phys. Rev. Lett. 104, 016403 (2010).
- (5) H. Morita, S. Watanabe, and M. Imada, J. Phys. Soc. Jpn. 71, 2109 (2002).
- (6) B. Kyung and A.-M. S. Tremblay, Phys. Rev. Lett. 97, 046402 (2006).
- (7) P. Sahebsara and D. Sénéchal, Phys. Rev. Lett. 97, 257004 (2006).
- (8) R.T. Clay, H. Li, and S. Mazumdar, Phys. Rev. Lett. 101, 166403 (2008).
- (9) L.F. Tocchio, A. Parola, C. Gros, and F. Becca, Phys. Rev. B 80, 064419 (2009).
- (10) J. Kokalj and Ross H. McKenzie, Phys. Rev. Lett. 110, 206402 (2013).
- (11) T. Yoshioka, A. Koga, and N. Kawakami, Phys. Rev. Lett. 103, 036401 (2009).
- (12) P. Sahebsara and D. Sénéchal, Phys. Rev. Lett. 100, 136402 (2008).
- (13) H.-Y. Yang, A.M. Läuchli, F. Mila, and K.P. Schmidt, Phys. Rev. Lett. 105, 267204 (2010).
- (14) A.E. Antipov, A.N. Rubtsov, M.I. Katsnelson, and A.I. Lichtenstein, Phys. Rev. B 83, 115126 (2011).
- (15) T. Watanabe, H. Yokoyama, Y. Tanaka, and J. Inoue, Phys. Rev. B 77, 214505 (2008).
- (16) L.F. Tocchio, H. Feldner, F. Becca, R. Valenti, and C. Gros, Phys. Rev. B 87, 035143 (2013).
- (17) D. Sénéchal, D. Perez, and M. Pioro-Ladriére, Phys. Rev. Lett. 84, 522 (2000); D. Sénéchal, D. Perez, and D. Plouffe, Phys. Rev. B 66, 075129 (2002).
- (18) M. Potthoff, M. Aichhorn, and C. Dahnken, Phys. Rev. Lett. 91 206402 (2003); C. Dahnken, M. Aichhorn, W. Hanke, E. Arrigoni, and M. Potthoff, Phys. Rev. B 70, 245110 (2004).
- (19) M. Potthoff, Eur. Phys. J. B 32, 429 (2003).
- (20) L. M. Luttinger, Phys. Rev. 119, 1153 (1960).
- (21) R. Eder, K. Seki, and Y. Ohta, Phys. Rev. B 83, 205137 (2011).
- (22) L. M. Luttinger and J. C. Ward, Phys. Rev. 118, 1417 (1960).
- (23) M. Aichhorn, E. Arrigoni, M. Potthoff, and W. Hanke, Phys. Rev. B 74, 024508 (2006).
- (24) H. Kino and H. Fukuyama, J. Phys. Soc. Jpn. 65, 2158 (1996).
- (25) A. E. Trumper, Phys. Rev. B 60, 2987 (1999).
- (26) P. Hauke, Phys. Rev. B 87, 014415 (2013).
- (27) K. Harada, Phys. Rev. B 86, 184421 (2012).
- (28) L. Capriotti, A. E. Trumper, and S. Sorella, Phys. Rev. Lett. 82, 3899 (1999); W. Zheng, J. O. Fjærestad, R. R. P. Singh, R. H. McKenzie, and R. Coldea, Phys. Rev. B 74, 224420 (2006); S. R. White and A. L. Chernyshev, Phys. Rev. Lett. 99, 127004 (2007).
- (29) S. Yunoki and S. Sorella, Phys. Rev. B 74, 014408 (2006); M. Q. Weng, D. N. Sheng, Z. Y. Weng, and R. J. Bursill, Phys. Rev. B 74, 012407 (2006); D. Heidarian, S. Sorella and F. Becca, Phys. Rev. B 80, 012404 (2009); J. Reuther and R. Thomale, Phys. Rev. B 83, 024402 (2011).
- (30) ZhengWeihong, R. H. McKenzie, R. P. Singh, Phys. Rev. B 59, 14367 (1999); O. A. Starykh and L. Balents, Phys. Rev. Lett. 98, 077205 (2007); S. Ghamari, C. Kallin, S. -S. Lee, and E. S. Sørensen, Phys. Rev. B 84, 174415 (2011) A. Weichselbaum and S. R. White, Phys. Rev. B 84, 245130 (2011).
- (31) T. Komatsu, N. Matsukawa, T. Inoue, and G. Saito, J. Phys. Soc. Jpn. 65, 1340 (1996).
- (32) H.C. Kandpal, I. Opahle, Y.-Z. Zhang, H.O. Jeschke, and R. Valenti, Phys. Rev. Lett. 103, 067004 (2009).
- (33) K. Nakamura, Y. Yoshimoto, T. Kosugi, R. Arita, and M. Imada, J. Phys. Soc. Jpn. 75, 074707 (2009).
- (34) A. Yamada, K. Seki, R. Eder, and Y. Ohta, Phys. Rev. B 83, 195127 (2011).
- (35) A. Yamada, K. Seki, R. Eder, and Y. Ohta, Phys. Rev. B 88, 075114 (2013).
- (36) M. Potthoff, Eur. Phys. J. B 36, 335 (2003).
- (37) M. Balzer, M. Kyung, D. Sénéchal, A. M. Tremblay, M. Potthoff, Eur. Phys. Lett. 85, 17002 (2009).
- (38) M. Laubach, R. Thomale, W. Hanke, and G. Li, arXiv:1401.8198v1.