Ly Emitters I. The Luminosity Function11affiliation: Based in part on data obtained from the Mikulski Archive for Space Telescopes (MAST). STScI is operated by the Association of Universities for Research in Astronomy, Inc., under NASA contract NAS5-26555. Support for MAST for non-HST data is provided by the NASA Office of Space Science via grant NNX09AF08G and by other grants and contracts. 2 2affiliationmark: 3 3affiliationmark: 4 4affiliationmark:
Abstract
We construct a flux-limited sample of 135 candidate Ly emitters (LAEs) from Galaxy Evolution Explorer (GALEX) grism data using a new data cube search method. These LAEs have luminosities comparable to those at high redshifts and lie within a 7 Gyr gap present in existing LAE samples. We use archival and newly obtained optical spectra to verify the UV redshifts of these LAEs. We use the combination of the GALEX UV spectra, optical spectra, and X-ray imaging data to estimate the active galactic nucleus (AGN) fraction and its dependence on Ly luminosity. We remove the AGNs and compute the luminosity function (LF) from 60 LAE galaxies. We find that the best fit LF implies a luminosity density increase by a factor of 1.5 from to and from to . We find a volumetric Ly escape fraction of .
Subject headings:
cosmology: observations1. Introduction
Ly emitters (LAEs) have the potential to be a powerful cosmological probe. The evolution of their number density at offers the opportunity to constrain the opacity of the intergalactic medium (IGM) and the timing of cosmic reionization (e.g., Stark et al., 2011). Their clustering properties may be able to constrain efficiently the expansion history of the universe (e.g., Hill et al., 2008; Greig et al., 2013). Furthermore, at the highest redshifts () Ly is the only emission line that we can detect from the ground, making it the only probe of the internal structure of these galaxies. However, to use LAEs as probes of the high-redshift universe, we must first understand their physical properties.
The Ly line is resonantly scattered by neutral hydrogen, making its flux and line profile notoriously hard to interpret (e.g., Neufeld, 1991; Kunth et al., 2003; Finkelstein et al., 2007; Schaerer & Verhamme, 2008; Östlin et al., 2009). For example, unlike rest-frame UV continuum observations, one cannot merely apply a dust extinction correction to obtain an estimate of the star formation rate (SFR). Thus, constraints on the Ly escape fraction must be empirically measured. Furthermore, observational studies are required to determine which physical properties facilitate the escape of Ly emission.
Due to the limited resources in the UV, most observational studies have focused on constraining the physical properties of LAEs, where the Ly line moves into the optical. Detailed analysis of the host galaxies is difficult at these high redshifts, and different groups have come to drastically different conclusions about them (e.g., compare Hu et al. 1998; Nilsson et al. 2007; Gawiser et al. 2007 to Lai et al. 2008; Kornei et al. 2010). Furthermore, at these redshifts Ly emission may be significantly altered by the intervening IGM. For example, based on hydro-simulations, Laursen et al. (2011) find that only , , and of Ly photons are transmitted through the IGM at , , and , respectively. To make progress, we need to study lower-redshift samples where LAEs are bright due to smaller luminosity distances and where LAEs can be integrated into comprehensive studies of galaxies at the same redshifts to understand how LAEs are drawn from the general galaxy population.
Recently, a 0.3 LAE sample has been found by searching for emission-line objects in Galaxy Evolution Explorer (GALEX; Martin et al., 2005) FUV pipeline spectra. Since the GALEX grism pipeline only includes objects whose UV continuum magnitudes are bright enough to generate measurable continuum spectra, only a fraction of the emission-line objects are extracted. Thus, this sample’s selection process is most analogous to locating LAEs in the high-redshift Lyman break galaxy (LBG) population via spectroscopy (e.g., Shapley et al., 2003). However, the procedure enables the selection of a substantial sample of 0.3 sources, and many papers have investigated their properties (e.g., Deharveng et al., 2008; Finkelstein et al., 2009; Atek et al., 2009; Scarlata et al., 2009; Cowie et al., 2010, 2011). The picture that emerged from the optical follow-up of the GALEX sample is that LAEs, when compared to UV-continuum selected galaxies, are relatively young, compact, metal poor, star-forming galaxies (Cowie et al., 2010, 2011).
However, it is not clear that the properties of these low-redshift () sources are representative of high-redshift LAEs. In particular, LAEs are considerably fainter and much less common at than they were in the past, with only about of UV-continuum selected galaxies having rest-frame Ly equivalent widths (EWr(Ly)) greater than Å, compared with at (Shapley et al., 2003). The EWr(Ly) 20Å requirement is typically used to define high-redshift samples (e.g., Hu et al., 1998). The first redshift where LAEs are seen that are comparable in luminosity to high-redshift LAEs is at 1. However, only a handful of LAEs have GALEX detectable continuum spectra. Thus, we need to remove the pipeline’s continuum selection requirement (NUV22) in order to study a large sample of 1 LAEs. This has the additional virtue of producing a purely flux-limited sample that is straightforward to analyze.
| GALEX Field | (J2000.0) | (J2000.0) | Exp. time | (erg cm-2 s-1) | Num. LAE candidates | Num. confirmed LAEs |
|---|---|---|---|---|---|---|
| (1) | (2) | (3) | (4) | (5) | (6) | (7) |
| CDFS | 3h30m40s | -27∘27′43′′ | 353 ks | 1.810-15 | 40 | 24 |
| GROTH | 14h19m58s | 52∘46′54′′ | 291 ks | 2.010-15 | 41 | 19 |
| NGPDWS | 14h36m37s | 35∘10′17′′ | 165 ks | 2.310-15 | 35 | 11 |
| COSMOS | 10h00m29s | +2∘12′21′′ | 140 ks | 3.210-15 | 19 | 4 |
In Barger, Cowie, & Wold (2012, hereafter, BCW12), we solved the problem of obtaining a flux-limited sample of LAEs for the Chandra Deep Field-South (CDFS). To do this, we converted the multiple GALEX grism images into a three-dimensional (two spatial axes and one wavelength axis) data cube. We then treated the wavelength “slices” as narrowband images in which we searched for emission-line galaxies. Through simulations, we showed that we could recover more than 80% of the sources with (Ly) 10-15 erg cm-2 s-1, which corresponds to (Ly) 1042.5erg s-1 at . By comparing our sample to X-ray data, existing optical spectroscopy, and deep U-band imaging, we determined that nearly all of our 28 new LAEs are real and that the UV spectroscopic redshifts based on the Ly identifications are reliable. We also determined the fraction of active galactic nuclei (AGNs) in the sample relative to star formers.
In this paper, we apply the data cube search method to all of the deepest GALEX grism fields (CDFS-00, 353 ks; GROTH-00, 291 ks; NGPDWS-00, 165 ks; COSMOS-00, 140 ks), which correspond to some of the most intensively studied regions in the sky. This work provides the first large sample of LAEs (N=60) that can be used to investigate the physical properties of these galaxies. There are relatively large samples of known LAEs at redshifts of and . Thus, a sample of LAEs is needed to map the evolution of LAEs over a 7 Gyr gap. This redshift regime is where the star-forming properties of galaxies change very rapidly and where the star formation begins to decline. It is a key area for connecting to the high-redshift universe.
In Paper II, we will leverage existing archival spectra and followup optical spectra to constrain their physical properties. In particular, we will study which properties facilitate the escape of Ly emission and how LAEs are drawn from the overall galaxy population. This will help us understand how the Ly emission properties of galaxies evolve as we move to higher redshifts and higher Ly luminosities.
Here we catalog our candidate LAE samples in each field and give optical redshifts from both archival and newly obtained observations. With X-ray, UV, and optical data, we determine the false detection rate (cases where the emission line is either not confirmed or is not Ly) and the AGN contamination rate of our sample. With the remaining LAEs, we compute the LAE galaxy luminosity function (LF) at and use this to investigate the evolution of the Ly LF and the Ly escape fraction over the redshift range from to . Unless otherwise noted, we give all magnitudes in the AB magnitude system (log with in units of Jy). We use a standard km s-1 Mpc-1, , and cosmology.
2. Choice of fields
We study the four deepest NUV grism observations: CDFS-00, GROTH-00, NGPDWS-00, and COSMOS-00. The GALEX fields are large ( deg2), but in subregions of the fields, there are many objects with optical spectra (CDFS, Vanzella et al. 2008, Popesso et al. 2009; GROTH, Newman et al. 2012; COSMOS, Lilly et al. 2007, Trump et al. 2009). In subregions, there are also multi-color observations from the HST GOODS (Giavalisco et al., 2004), CANDELS (Grogin et al., 2011; Koekemoer et al., 2011), COSMOS (Leauthaud et al., 2007), and GEMS (Rix et al., 2004) programs that provide the galaxy morphologies and spectral energy distributions from the rest-frame far-UV to the mid-infrared. When corrected for the emission-line contributions using the spectra (Schaerer & de Barros, 2009; Atek et al., 2011; Cowie et al., 2011), the spectral energy densities can be used to compute the ages and extinctions of the galaxies.
Finally, the 4 Ms Chandra image of the CDFS (Alexander et al., 2003; Luo et al., 2008) region, along with shallower X-ray observations in the Extended CDFS (Lehmer et al., 2005; Virani et al., 2006), COSMOS (Elvis et al., 2009), GROTH (Laird et al., 2009), and NGPDWS (Kenter et al., 2005) fields, can be used to identify AGNs. AGNs may also be identified using the UV grism spectra obtained with GALEX and the optical spectra, but the X-rays provide a valuable cross-check, where they are available.
3. GALEX NUV LAEs

(A color version of this figure is available in the online journal.)
3.1. Catalog Extraction
As described in BCW12, we converted multiple GALEX NUV grism images into a three-dimensional (two spatial axes and one wavelength axis) data cube. Each background subtracted data cube consists of thirty Å narrowband slices covering a wavelength range of 2030 to 2630 Å and a 50′50′ field of view. We used SExtractor (Bertin & Arnouts, 1996) to identify all 4 sources within the cube and then visually inspected each source and its spectrum (1-D and 2-D) to eliminate objects that were artifacts. Applying the data cube search produced 40 CDFS, 41 GROTH, 35 NGPDWS, and 19 COSMOS objects for a full Ly selected candidate sample of 135 (see Table 1). In Figure 1(a), we show the extracted 1-D spectrum for GALEX033100-273020 to illustrate the quality of our GALEX spectra. BCW12 performed this routine on the deepest NUV grism field (CDFS-00). To verify the BCW12 sample of 28 LAE candidates, we have independently searched the CDFS cube for emission-line sources. We found 27 of the 28 objects that were identified by BCW12, and we found 12 new objects. Approximately half of these new LAE candidates are close to the field’s completeness flux threshold (see Section 3.3) and were probably missed due to their faintness. The other half are relatively bright and were probably mis-classified as data cube artifacts, such as the remaining edge effects from brighter objects. The BCW12 LAE candidate missed by this search (GALEX033124-275625) is real and has a consistent optical redshift. This LAE was eliminated in the visual inspection phase of our search due to its proximity to a UV-bright star. We include this missed LAE in all subsequent analysis. To date, we have confirmed the UV redshifts of 92 (11 out of 12) of the newly discovered CDFS LAEs with optical follow-up spectra.
3.2. Optical Spectroscopic Followup
Spectroscopic observations were primarily obtained with the DEep Imaging Multi-Object Spectrograph (DEIMOS; Faber et al., 2003) on Keck II in a series of runs in 2012 to 2013. The observations were made with the ZD600 line mm-1 grating blazed at 7500 Å. This gives a resolution of 5 Å with a 1′′ slit and a wavelength coverage of 5300 Å. The high spectral resolution is necessary to distinguish the [OII]3727 doublet structure. The observations were not generally taken at parallactic angle, since the position angle was determined by the mask orientation. Each 30 min exposure was broken into three subsets, with the objects stepped along the slit by 1.5′′ in each direction. The raw two-dimensional spectra were reduced and extracted using the procedure described in Cowie et al. (1996). In Figure 1(b), we show the optical spectrum for GALEX033100-273020 to illustrate the quality of our DEIMOS spectra. We used the remaining space available in our MOS masks to observe a control sample, a UV-continuum selected sample without detected Ly that have the same luminosities and are expected, based on their colors, to lie in the same redshift interval as our primary LAE sample. In Paper II, we will use the control sample to determine how the LAE galaxies are drawn from the general galaxy population.
(A color version of this figure is available in the online journal.)
We observed our southern and equatorial fields (COSMOS and CDFS) with the Robert Stobie Spectrograph (RSS; Burgh et al., 2003) on SALT from 2011 to 2013. The observations were made with the pg1300 grating with the grating angle adjusted to ensure spectral coverage of lines redward of [NeV]. This gives a resolution of 4 Å with a 1.5′′ slit and a wavelength coverage of 2000 Å. We observed each target for 30 min. The raw two-dimensional spectra were reduced and extracted using the IRAF packages LONGSLIT and APEXTRACT.
3.3. Catalog Completeness
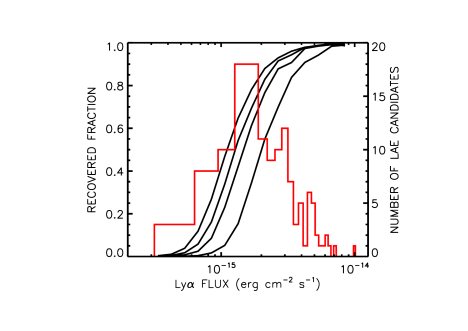
To determine the limitations of our multi-field catalogs and to compute the LAE galaxy LF, we have developed a simulation to determine the completeness of recovery versus flux. For each field, we added 1000 simulated emitters uniformly within the field’s data cube. We did not model morphology or size difference, since nearly all emitters are unresolved at the spatial () and spectral resolution ( Å) of the GALEX grism data. We then ran our standard selection procedure and found the number of recovered objects. We independently performed the above procedure ten times, giving a total of 10,000 input sources. In Table 1, we list the flux threshold above which each field is greater than 80 complete. As expected, the completeness limit scales as the inverse square root of the exposure time. Below this threshold, the completeness of our sample rapidly declines (see Figure 2).

(A color version of this figure is available in the online journal.)
3.4. Catalogs of LAE Candidates by Field
In Tables 4-7, we list all of the LAE candidates in the CDFS, GROTH, NGPDWS, and COSMOS fields ordered by redshift. In Column 1, we give the GALEX name; in Columns 2 and 3, the J2000 right ascension and declination based on NUV position; in Columns 4 and 5, the NUV and FUV AB magnitudes; in Column 6, the redshift from the GALEX UV spectrum; in Column 7, the logarithm of the Ly luminosity; in Column 8, the rest-frame EWr(Ly) with 1 errors; in Column 9, the logarithm of the X-ray flux; in Column 10 , the UV classified AGNs; in Columns 11 and 12, the J2000 right ascension and declination based on optical position; in Column 13, the offset between the optical to UV positions; in Column 14, the optical redshift; and in Column 15 the optically classified AGNs.
We measured NUV and FUV AB magnitudes from the archival GALEX background subtracted intensity maps (Morrissey et al., 2007). We first determined the magnitudes within 8′′ diameter apertures centered on each of the emitter positions. To correct for flux that falls outside our apertures, we measured the offset between 8′′ aperture magnitudes and GALEX pipeline total magnitudes for all bright cataloged objects (20-23 mag range) within our fields. We determined the median offset for each field and applied these to the magnitudes listed in Columns 4 and 5. All objects are bright in the NUV when compared to their FUV magnitudes. In some cases, we measure negative FUV fluxes. For these cases, we list the magnitude corresponding to the absolute value of the flux with a minus sign in front to indicate that the flux was negative.
We corrected our one-dimensional NUV spectra for Galactic extinction assuming a Fitzpatrick (1999) reddening law with RV=3.1. We obtained values from the Schlafly & Finkbeiner (2011) recalibration of the Cardelli et al. (1989) extinction map as listed in the NASA/IPAC Extragalactic Database (NED). Galactic extinction modifies the Ly flux by 11% for the COSMOS LAEs, 4% for the GROTH LAEs, and 6% for the CDFS and NGPDWS LAEs.
From these extinction corrected spectra, we measured the redshifts, the Ly fluxes, and the line widths using a two step process. First, we fit a 140 Å rest-frame region around the Ly line with a Gaussian and a sloped continuum (see Figure 1(a)). A downhill simplex optimization routine was used to fit the five free parameters (continuum level and slope plus Gaussian center, width, and area). We used the results of this fitting process to eliminate the two continuum parameters and as a starting point for the second step. In the second step, we used the IDL MPFIT procedures of Markwardt (2009) to fit the remaining three Gaussian parameters. We also employed the same fitting routine but with only a flat continuum (one continuum free parameter instead of two). We find that our results are not significantly affected by this model assumption. With the best-fit redshifts and Ly fluxes, we calculated Ly luminosities. When available, we used the more precise optical redshift rather than the UV redshift to calculate the Ly luminosities. We list the UV redshifts and Ly luminosities in Columns 6 and 7.
The rest-frame EWr(Ly) measured on the spectra are quite uncertain due to the very faint UV continuum. We obtained a more accurate rest-frame EW by dividing the measured Ly flux by the continuum flux measured from the broadband NUV image. It is these rest-frame EWs that are given in Column 8. In Section 5, we investigate the rest-frame EW distribution.
We made a classification of whether the emitter was an AGN based on the presence of either broad or high-excitation emission lines in its UV or optical spectra or on the presence of an X-ray counterpart. Candidate X-ray counterparts were identified by matching all X-ray sources within a radius from the data cube position. We then manually inspected the matches to reject false counterparts. We list the X-ray flux of each identified counterpart in Column 9. The X-ray luminosity threshold of erg s-1 that is usually used to define AGN activity (Hornschemeier et al., 2001; Barger et al., 2002; Szokoly et al., 2004) corresponds to an X-ray flux of 10-15.3 erg cm-2 s-1 for our sample. All X-ray detected sources exceed this luminosity threshold, and we hereafter consider these sources to be AGNs. In Column 10, we list sources classified as AGNs based on the presence of broad or high-excitation emission lines in their UV spectrum (see, e.g., Cowie et al. 2010). Our candidate star-forming galaxy sample will still contain some remaining AGNs, so we used the optical spectra to make a final determination of whether a galaxy is, in fact, star-forming. In Column 15, we identify optical AGNs based on the presence of either detectable [NeV] or broad Balmer or MgII2798 emission lines in the optical spectra.
We obtained optical redshifts for 122 of our 135 candidate LAEs. We found that 15 optical redshifts did not match the measured UV redshifts. For these objects, the Ly luminosity and the rest-frame EWr(Ly) fields are left blank in Columns 7 and 8. These sources are either spurious, stars, or strong CIV1549 emitters. For example, we found three LAE candidates in our COSMOS-00 field to be CIV1549 emitters. We indicate these objects by showing their optical redshift in parentheses or by setting their optical redshift and type to ‘star’ in Columns 14 and 15. Additionally, we observed 4 candidate LAEs with Keck DEIMOS without recovering an optical redshift. We indicate these objects by setting their optical redshifts to ‘no z’ in Column 14. For the purpose of computing the LF, we retain the NUV brightest ‘no z’ source (GALEX033045-274506), which has two nearby untargeted potential optical counterparts. The remaining ‘no z’ candidate LAEs have relatively faint NUV counterparts and may be spurious. Given the spatial resolution of our data cubes (), we find that a total of five ‘no z’ and non-matching redshift sources have potential alternative optical counterparts. We list these ‘[alt]’ sources in the Table 4-7 notes. Overall, we exclude 18 optically unconfirmed LAE candidates in the following discussion and in the construction of the Ly LF.


Excluding these 18, we are left with a sample of 117 LAEs. We classified 57 of these sources as UV, X-ray, or optical AGN. This establishes an AGN fraction (AGN) of 498 for our sample. After we exclude UV identified AGNs, our AGN drops to 418. When performing the optical spectroscopic followup, we preferentially targeted LAEs that were not classified as UV or X-ray AGNs. With this policy, we obtained optical redshifts for 98% (59 out of 60) of our LAE galaxies but only 89 (51 out of 57) of our AGNs. We found that 9 of the 37 LAEs classified as X-ray AGNs were already classified as AGNs based on their UV spectra. We observed 19 LAEs classified as X-ray AGNs with Keck DEIMOS. Only 3 of these X-ray AGNs were not classified as optical AGNs.
As a cross check to our sample’s AGN fraction of 498, we only consider LAEs within deep X-ray fields and re-compute the AGN fraction. There are 79 candidate LAEs within deep X-ray fields; we classified 44 (or 5610) as AGNs. This is not significantly different our sample-wide AGN contamination. In Figure 3, we show that the AGN fraction increases with Ly luminosity (similar trends have been noted by Cowie et al. 2010 and Nilsson & Møller 2011). Breaking each sample into 5 luminosity bins from log Lyα = 42.5 to 43.4 (used below in the Ly LF computation) and requiring EWr(Ly) 20Å, we find that the AGN fraction increases from 6% to 71% for the full GALEX data cube sample and from 13% to 83% for the deep X-ray subsample. Given this small but systematic difference, we derive the Ly LF for our full LAE galaxy sample and for the subsample limited to regions with deep X-ray data to determine the effect, if any, on our results.
In common with other low-redshift samples, our AGN fraction is high compared to the AGN fractions quoted for higher redshift samples. (Note that many of the low-redshift samples quote AGN fractions that exclude sources known to be AGNs based on the UV spectra; our AGN fraction includes these sources.) However, it is essential to emphasize that the AGN fraction is strongly dependent on the luminosity range. Our LAEs have Ly luminosities from 1042.2 to 1043.6 erg s-1. As shown in Nilsson & Møller (2011), the AGN fraction rapidly increases over this range and approaches 100% at Ly luminosities above 1043.6erg s-1.
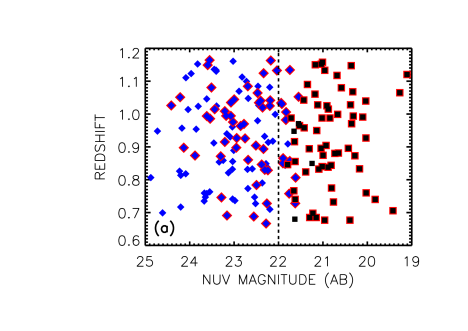
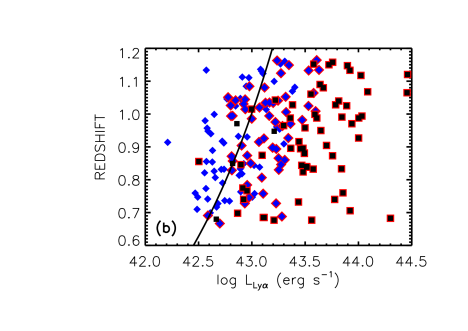
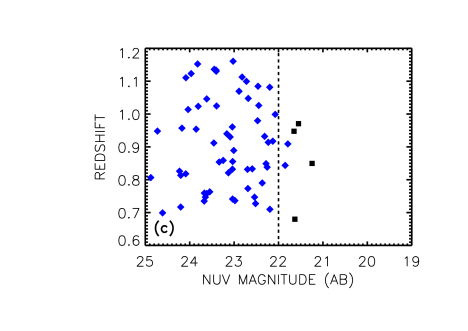
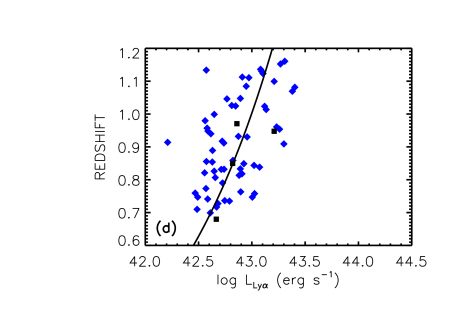
The high-luminosity LAEs are primarily AGNs, and it is these objects that are included in the GALEX pipeline extractions. Only with the increased sensitivity of the data cube search do we probe faint enough to develop large samples of star-forming LAEs. In Figure 4(a), we show the LAE redshift versus the NUV magnitudes for our LAE data cube sample (blue diamonds) and for the pipeline LAE sample found by Cowie et al. (2010, 2011, black squares) constrained to the data cubes’ 50′50′ FOVs and redshift range (). We note that there are seven pipeline LAE galaxies listed within the CDFS, GROTH, NGPDWS, and COSMOS fields (see Table 2 in Cowie et al., 2011). We excluded one pipeline LAE galaxy due to its low redshift , and we excluded two pipeline LAE galaxies because they do not fall within our data cubes’ 50′50′ FOVs. Although not excluded for the purposes of this discussion, if we also require EWr(Ly) 20Å, then there are only two LAE galaxies that remain in the pipeline sample. By construction, the GALEX pipeline extractions miss all LAEs fainter than the pipeline magnitude limit of NUV (dashed line in Figure 4(a)). Objects classified as AGNs in any way have their symbols outlined in red. In Figure 4(b), we show the LAE redshift versus the Ly luminosity. Directly below Figures 4(a) and 4(b), we show these Figures again but with all AGNs removed. We find that the AGN fraction reaches 100% at a Ly luminosity of erg s-1. This is also the Ly luminosity where the pipeline extraction begins to miss sources. While there is some luminosity overlap between the data cube and pipeline samples, we find that our data cube search is necessary to obtain a large LAE galaxy sample.
4. Luminosity function
We computed the Ly LF of the combined CDFS, GROTH, NGPDWS, and COSMOS LAE galaxy samples in the redshift range using the technique (Felten, 1976). We only included sources that were not classified as AGN in any way and that have EWr(Ly) Å. With these criteria, the sample includes two LAE galaxies, which appeared in the pipeline sample of Cowie et al. (2011, see their Table 2). The rest (58) come from our data cube sample and are not found in the GALEX pipeline extractions.
| GALEX Field | (erg cm-2 s-1) | Completeness |
|---|---|---|
| (1) | (2) | (3) |
| CDFS | 8.510-16 | |
| GROTH | 5.210-16 | |
| NGPDWS | 10.910-16 | |
| COSMOS | 24.110-16 |
To compute the LF, we divided our Ly survey into 20 samples (5 samples per field), where the sample covers a Ly flux range and a solid angle area (the masking of bright sources alters from one GALEX 50′50′ field to another). For each field, we took the difference between the minimum and maximum observed Ly flux and divided this into 5 flux bins of equal size (see Table 2 for minimum Ly flux values and corresponding completeness limits). The sampling rate (the fraction of LAE galaxies in the given flux range that were observed) was estimated with our completeness simulations. The effective area of a sample is . The accessible volume of the LAE galaxy in sample is
where the comoving volume is calculated at the highest and lowest redshifts at which the LAE galaxy remains both within sample ’s Ly flux range and within the redshift range . The total accessible volume of the LAE galaxy is
and the Ly LF in the luminosity range and redshift range is
In Figure 5(a), we show our raw LF (black open circles) along with our LF corrected for incompleteness (black solid circles). Error bars are 1 Poisson errors. In Table 3 Columns 1, 2, and 3, we list the luminosity bins, the number of LAE galaxies per bin, and the computed luminosity function values corrected for incompleteness. We have tested that these results are not dependent on our method of constructing flux bins. Alternatively, for each field, we generated 5 flux bins of equal size within the range of to the maximum observed Ly flux, where is the Ly flux corresponding to 50% completeness (see Figure 2). This method reduces the dependence on our completeness simulations but does not significantly change our results.
| log bin | N | |
|---|---|---|
| (erg s-1) | (Mpc-3 log(L)-1) | |
| (1) | (2) | (3) |
| 42.468 - 42.655 | 17 | 66.316.8 |
| 42.655 - 42.842 | 13 | 23.66.7 |
| 42.842 - 43.029 | 15 | 14.93.9 |
| 43.029 - 43.216 | 8 | 5.72.0 |
| 43.216 - 43.403 | 7 | 4.31.6 |
We may correct for any remaining AGNs in our sample by restricting our field to regions with deep X-ray data. This removes the NGPDWS field and restricts the area of the remaining 5050′ GALEX fields but ensures a robust AGN classification. In Figure 5(b), we show our X-ray data limited LF (black circles). Comparing this LF to the LF computed from the full LAE galaxy sample, we find that all points are consistent within 1 error bars.
We find that our LAE galaxy LF is consistent with the LAE galaxy LF computed in BCW12. BCW12 based their LF on LAE galaxies found in one of the four GALEX fields contained in this study. We have increased the sample size by a factor of three. Furthermore, we have searched for AGNs in the BCW12 LAE galaxy sample (none found) and removed spurious sources (3 BCW12 LAE candidates) with our newly obtained optical spectroscopic data.
5. Distribution of Equivalent Widths
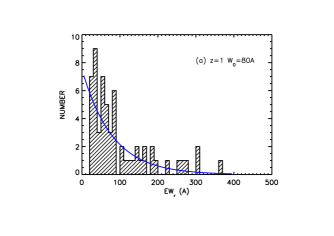
In Figure 6, we show our rest-frame EWs versus redshift. Because we have a flux-limited sample, the distribution of these EWs should be directly comparable to narrowband Ly selected samples at higher redshifts. In Figure 7(a), we show the distribution of these EWs for the full sample.

(A color version of this figure is available in the online journal.)
(A color version of this figure is available in the online journal.)
The rest-frame EW distribution is normally fit with an exponential function. For the LAE samples, which are truncated below Å, the maximum likelihood estimate of the scale length is the mean of the rest-frame EW values minus Å. We find a scale length of Å for the full sample, where we computed the error using the parameterized bootstrap method. Separating the sample by luminosity gives a scale length of Å for sources with logarithmic Ly luminosities above 42.8 and Å for those with lower luminosities. This is consistent with the distribution being invariant as a function of Ly luminosity, as has been found in the higher redshift samples (Ciardullo et al., 2012).
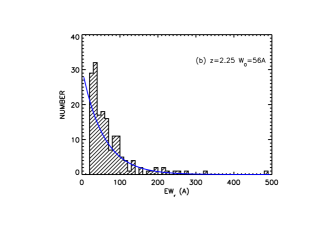
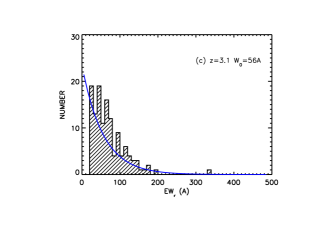
We compare our sample at with a sample at from Nilsson et al. (2009) (Figure 7(b)) and a sample at from Ciardullo et al. (2012) (Figure 7(c)). The Nilsson et al. sample has a logarithmic luminosity limit of 42.4 erg s-1, which is very similar to that of the present sample, while the Ciardullo et al. sample covers 42 erg s-1 to just above 43 erg s-1, making it slightly fainter, on average. The Nilsson et al. and Ciardullo et al. maximum likelihood estimates of the rest-frame EW scale length are both Å. Nilsson et al. also give a least squares fit value of Å, which is consistent within the errors.
However, when Ciardullo et al. (2012) allowed for biases in their sample, such as those introduced by the filter shape, then their rest-frame EW scale length rose to Å. When Ciardullo et al. analyzed an alternate sample at from Gronwall et al. (2007) in the same way, they found Å. From the combined samples, they found Å. Ciardullo et al. also reanalyzed the sample from Guaita et al. (2010) in a self-consistent way and found Å. The Ciardullo et al. value is consistent with the Nilsson et al. (2009) value. Based on an Anderson-Darling test, they concluded that there is a significant difference between the and samples.
The Ciardullo et al. (2012) analysis emphasizes that differences inherent in the methodology and fitting procedure are important. In particular, comparisons between the present sample, where the line fluxes are computed from the spectra and the continua from the broadband magnitudes, and samples such as the Ciardullo et al. sample, which are based purely on imaging data, can be tricky (e.g., Zheng et al., 2013). Nevertheless, the present sample appears to indicate that, if there is indeed a narrowing of the rest-frame EW distribution from to , then it has reversed by .
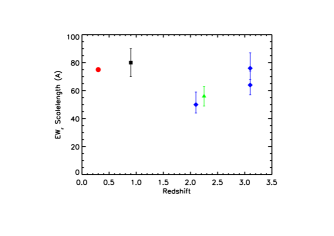
In Figure 8, we show the rest-frame EW scale lengths measured from the maximum likelihood procedures for the present sample (black square), the Nilsson et al. (2009) sample (green triangle), and the Guaita et al. (2010), Ciardullo et al. (2012), and Gronwall et al. (2007) samples (blue diamonds; values quoted from Ciardullo et al.) While there may be a drop at , overall the scale length shows little variation with redshift. This is in sharp contrast to the analysis of Zheng et al. (2013), who found a redshift evolution of . The Zheng et al. result appears to be due primarily to their misinterpretation of the scale length given by Cowie et al. (2010) for their GALEX LAE sample. Zheng et al. used , which was what Cowie et al. gave for their continuum selected sample. However, as Cowie et al. emphasized in their Section 5.4, this needs to be corrected for missing high EW sources before it can be compared with Ly luminosity selected samples. In Figure 8, we show the Cowie et al. corrected scale length of 75 Å (red circle). (Because of the large systematic errors, we do not show an error bar.) This is fully consistent with there being a constant value of the scale length with redshift.
(A color version of this figure is available in the online journal.)
(A color version of this figure is available in the online journal.)
(A color version of this figure is available in the online journal.)
(A color version of this figure is available in the online journal.)
(A color version of this figure is available in the online journal.)
6. Discussion
In Figure 9, we show the dramatic increase in the observed Ly luminosities to a redshift of followed by relatively no luminosity evolution from to . This large luminosity boost was previously noted by Cowie et al. (2011) with a sample of LAEs at a redshift of (see Figure 9, red diamonds). We have now increased the sample size of LAEs to 60 galaxies (see Figure 9, black circles). Our relatively nearby sample will facilitate the study of LAEs with luminosities analogous to high-redshift LAEs. In Paper II, we will use the available spectroscopic and imaging data to constrain the properties of our sample and to serve as a baseline for studies of higher redshift LAEs.
In order to quantify the evolution in , we have held the slope fixed and found the best Schechter (1976) function fit to our data. We assume a slope of , which allows us to compare directly our results to the LAE galaxy LF at (, log , log ; Cowie et al., 2010). We obtain log and log (see Figure 5(a)). Limiting our sample to regions with deep X-ray data, we obtain log and log (see Figure 5(b)).
Both our values are roughly consistent with values found for LAE galaxy LFs at (log , Gronwall et al. 2007; log , Ouchi et al. 2008; log , Ciardullo et al. 2012) and imply an increase by a factor of from to (from log to log ). A large boost in is in agreement with the evolution seen in other LFs tracing star-forming galaxies. Both H and UV LFs are found to be dominated by luminosity evolution over the redshift range . Sobral et al. (2013) investigated H LFs and found that increases by a factor of 10 from to . Oesch et al. (2010) investigated UV LFs and found that increases by a factor of from to .
However, our fitted Schechter parameters indicate a decrease in from to (from log to log ). It is only beyond that there a significant increase in . Referring again to other LFs tracing star-forming galaxies, we note that, unlike , does not increase monotonically over the redshift range . Within the uncertainties of their measurements, both Sobral et al. (2013, for ) and Oesch et al. (2010, for ) found very little evidence for evolution from to . As discussed in more detail below, we find that our best fit Schechter functions with higher values tend to have lower values. Given this issue and the poorly constrained faint end slope, a clearer picture of the evolution of individual Schechter function parameters awaits a LAE survey probing lower Ly luminosities. Such a survey is not possible with currently available telescopes but would allow stronger constraints on the and values.
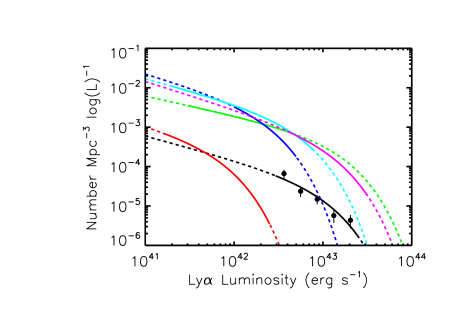
In Figure 10, we compare our LF computed from the full LAE galaxy sample to other Ly luminosity functions in close redshift proximity. We show the fitted Schechter functions as solid lines over the the extent of their observed data points. For the Schechter function parameters, the log ⋆ values range from 42.3 to 43.2, the log values range from to , and the values range from to (see the blue, green, cyan, and magenta lines in Figure 10). Due to the differing survey volumes and fitting assumptions, it is still possible that all data are in overall agreement (Blanc et al., 2011; Ciardullo et al., 2012).
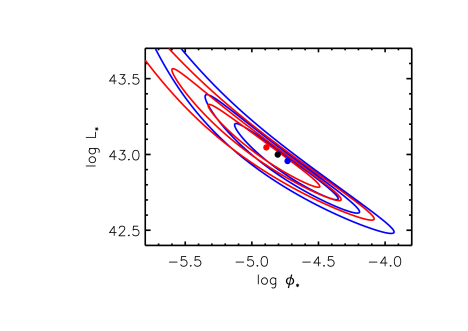
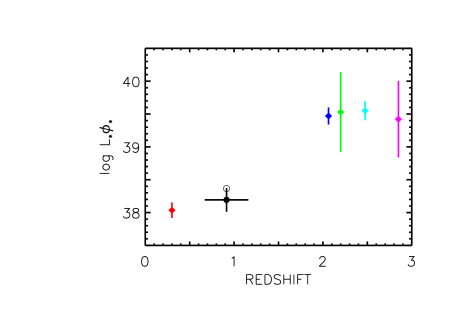
The Schechter function parameters and are known to be strongly correlated, while assuming different values of tends to leave the product unchanged. We show this for our Schechter function fit in Figure 11. For these reasons, we consider the product and the luminosity density, which is proportional to , to be more reliable than the values of individual Schechter parameters. In Figure 12, we show that a coherent picture emerges by comparing our results to the values found in the literature. As noted by Blanc et al. (2011), there is a trend (in agreement with our uncertainty contours) for the Schechter function fits with higher values to have lower values. Thus, the Schechter functions — which have values that differ by about an order of magnitude — are found to have consistent values. The product increases by a factor of from to followed by an increase by a factor of from to .
The observed Ly luminosity density provides an estimate of the total amount of Ly light emitted by galaxies per unit volume:
where is a Ly Schechter function. Integrating this expression from to gives
where is the Gamma function. The main source of uncertainty in this expression comes from the poorly constrained faint end slope . Taking the extreme values for the Schechter functions, and , we find that changes by a factor of 1.7. Modulo this factor, the evolution of the product seen in Figure 12 from to results from the change in observed Ly luminosity density.
To first order, the intrinsic production of Ly photons in a galaxy is proportional to the SFR (Kennicutt, 1998; Schaerer, 2003). Thus, an overall increase in the Ly luminosity density from to is expected due to the well established increase in the cosmic SFR density. However, observed Ly luminosities will significantly deviate from intrinsic Ly luminosities due to resonant scattering of Ly photons by neutral hydrogen.
To quantify this, we calculate the volumetric Ly escape fraction, , and compare its value to other measurements taken at nearby redshifts. The volumetric Ly escape fraction measures the fraction of Ly photons that escape from the survey volume. We emphasize that its value will be systematically lower than the Ly escape fractions derived for individual LAEs. For example, Blanc et al. (2011) find a median Ly escape fraction for their LAE sample but only a volumetric Ly escape fraction.
The volumetric escape fraction is defined as the observed Ly luminosity density divided by the intrinsic Ly luminosity density,
where the intrinsic Ly luminosity density is found by taking a measure of the cosmic SFR density and then converting SFR to Ly luminosity,
The conversion factors come from the assumption of case B recombination (Brocklehurst, 1971) and the SFR to H Kennicutt (1998) relation. For consistency with Blanc et al. (2011), we integrate the Ly LFs down to a erg s-1 limit and obtain cosmic SFR density measurements from Bouwens et al. (2010). Blanc et al. (2011) estimate that the choice of the luminosity integration limit may alter the computed luminosity density by at most (for further discussion of this issue see Hayes et al., 2011). Bouwens et al. (2010) derive cosmic SFR densities from extinction corrected rest-frame UV LFs. We do not attempt to correct for IGM absorption, which should be negligible for our sample.
Both Hayes et al. (2011) and Blanc et al. (2011) have compiled measurements from various Ly LF studies spanning a redshift range of to determine the evolution of . Both groups fit power laws to these data and find evidence for a rapidly increasing , which approaches 100 at high redshifts ().
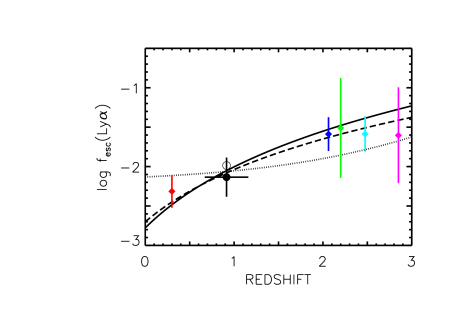
We find a of . In Figure 13, we show that the computed from our best fit Schechter function is consistent with the value of interpolated from the power law fits of Hayes et al. (2011) and Blanc et al. (2011). In Figure 13, we also show (open circle) computed from our fitted LF limited to regions with deep X-ray data. Hayes et al. (2011) argue that the rising trend in the volumetric Ly escape fraction with increasing redshift is consistent with expectations due to the general decline of dust content in star-forming galaxies. We have now constrained the from to and find results consistent with this inferred trend.
7. Summary
We presented a catalog of 135 candidate LAEs. We obtained optical spectral data for 90% of our sample. We found that only 13% of our sample are either spurious, stars, or strong CIV1549 emitters. Combining these optical data with the UV spectra and X-ray imaging data, we found that 49% of our Ly emitters are AGNs. Eliminating AGNs and LAEs with EWr(Ly)20 Å gives a final sample of 60 star-forming LAEs, which we used to compute the Ly LF and the Ly volumetric escape fraction (). We note that no improved Ly LFs are possible for the foreseeable future due to the lack of UV telescopes. Our best fit LF implies a significant increase in between and without much change in the luminosity density. This requires a rapid increase in between and . It is clear that the intrinsic properties of the LAEs must be changing rapidly in the interval, resulting in a rapid increase in the Ly escape fraction. Our cataloged sources offer the best opportunity to study emitters with luminosities comparable to LAEs found in the early universe. With the optical data in hand, Paper II will compare our sample’s physical properties to a UV-selected control sample.
References
- Alexander et al. (2003) Alexander, D. M., Bauer, F. E., Brandt, W. N., et al. 2003, AJ, 126, 539
- Atek et al. (2009) Atek, H., Kunth, D., Schaerer, D., et al. 2009, A&A, 506, L1
- Atek et al. (2011) Atek, H., Siana, B., Scarlata, C., et al. 2011, ApJ, 743, 121
- Barger et al. (2002) Barger, A. J., Cowie, L. L., Brandt, W. N., et al. 2002, AJ, 124, 1839
- Barger et al. (2012) Barger, A. J., Cowie, L. L., & Wold, I. G. B. 2012, ApJ, 749, 106
- Bertin & Arnouts (1996) Bertin, E., & Arnouts, S. 1996, A&AS, 117, 393
- Blanc et al. (2011) Blanc, G. A., Adams, J. J., Gebhardt, K., et al. 2011, ApJ, 736, 31
- Bouwens et al. (2010) Bouwens, R. J., Illingworth, G. D., Oesch, P. A., et al. 2010, ApJ, 709, L133
- Brocklehurst (1971) Brocklehurst, M. 1971, MNRAS, 153, 471
- Burgh et al. (2003) Burgh, E. B., Nordsieck, K. H., Kobulnicky, H. A., et al. 2003, in Society of Photo-Optical Instrumentation Engineers (SPIE) Conference Series, Vol. 4841, Society of Photo-Optical Instrumentation Engineers (SPIE) Conference Series, ed. M. Iye & A. F. M. Moorwood, 1463–1471
- Cardelli et al. (1989) Cardelli, J. A., Clayton, G. C., & Mathis, J. S. 1989, ApJ, 345, 245
- Cassata et al. (2011) Cassata, P., Le Fèvre, O., Garilli, B., et al. 2011, A&A, 525, A143
- Ciardullo et al. (2012) Ciardullo, R., Gronwall, C., Wolf, C., et al. 2012, ApJ, 744, 110
- Cooper et al. (2012) Cooper, M. C., Yan, R., Dickinson, M., et al. 2012, MNRAS, 425, 2116
- Cowie et al. (2010) Cowie, L. L., Barger, A. J., & Hu, E. M. 2010, ApJ, 711, 928
- Cowie et al. (2011) —. 2011, ApJ, 738, 136
- Cowie et al. (1996) Cowie, L. L., Songaila, A., Hu, E. M., & Cohen, J. G. 1996, AJ, 112, 839
- Dawson et al. (2007) Dawson, S., Rhoads, J. E., Malhotra, S., et al. 2007, ApJ, 671, 1227
- Deharveng et al. (2008) Deharveng, J.-M., Small, T., Barlow, T. A., et al. 2008, ApJ, 680, 1072
- Elvis et al. (2009) Elvis, M., Civano, F., Vignali, C., et al. 2009, ApJS, 184, 158
- Faber et al. (2003) Faber, S. M., Phillips, A. C., Kibrick, R. I., et al. 2003, in Society of Photo-Optical Instrumentation Engineers (SPIE) Conference Series, Vol. 4841, Society of Photo-Optical Instrumentation Engineers (SPIE) Conference Series, ed. M. Iye & A. F. M. Moorwood, 1657–1669
- Felten (1976) Felten, J. E. 1976, ApJ, 207, 700
- Finkelstein et al. (2009) Finkelstein, S. L., Rhoads, J. E., Malhotra, S., & Grogin, N. 2009, ApJ, 691, 465
- Finkelstein et al. (2007) Finkelstein, S. L., Rhoads, J. E., Malhotra, S., Pirzkal, N., & Wang, J. 2007, ApJ, 660, 1023
- Fitzpatrick (1999) Fitzpatrick, E. L. 1999, PASP, 111, 63
- Gawiser et al. (2007) Gawiser, E., Francke, H., Lai, K., et al. 2007, ApJ, 671, 278
- Giavalisco et al. (2004) Giavalisco, M., Ferguson, H. C., Koekemoer, A. M., et al. 2004, ApJ, 600, L93
- Greig et al. (2013) Greig, B., Komatsu, E., & Wyithe, J. S. B. 2013, MNRAS, 431, 1777
- Grogin et al. (2011) Grogin, N. A., Kocevski, D. D., Faber, S. M., et al. 2011, ApJS, 197, 35
- Gronwall et al. (2007) Gronwall, C., Ciardullo, R., Hickey, T., et al. 2007, ApJ, 667, 79
- Guaita et al. (2010) Guaita, L., Gawiser, E., Padilla, N., et al. 2010, ApJ, 714, 255
- Hayes et al. (2011) Hayes, M., Schaerer, D., Östlin, G., et al. 2011, ApJ, 730, 8
- Hayes et al. (2010) Hayes, M., Östlin, G., Schaerer, D., et al. 2010, Nature, 464, 562
- Hill et al. (2008) Hill, G. J., Gebhardt, K., Komatsu, E., et al. 2008, in Astronomical Society of the Pacific Conference Series, Vol. 399, Panoramic Views of Galaxy Formation and Evolution, ed. T. Kodama, T. Yamada, & K. Aoki, 115
- Hornschemeier et al. (2001) Hornschemeier, A. E., Brandt, W. N., Garmire, G. P., et al. 2001, ApJ, 554, 742
- Hu et al. (2010) Hu, E. M., Cowie, L. L., Barger, A. J., et al. 2010, ApJ, 725, 394
- Hu et al. (1998) Hu, E. M., Cowie, L. L., & McMahon, R. G. 1998, ApJ, 502, L99
- Kashikawa et al. (2006) Kashikawa, N., Shimasaku, K., Malkan, M. A., et al. 2006, ApJ, 648, 7
- Kennicutt (1998) Kennicutt, Jr., R. C. 1998, ApJ, 498, 541
- Kenter et al. (2005) Kenter, A., Murray, S. S., Forman, W. R., et al. 2005, ApJS, 161, 9
- Koekemoer et al. (2011) Koekemoer, A. M., Faber, S. M., Ferguson, H. C., et al. 2011, ApJS, 197, 36
- Kornei et al. (2010) Kornei, K. A., Shapley, A. E., Erb, D. K., et al. 2010, ApJ, 711, 693
- Kunth et al. (2003) Kunth, D., Leitherer, C., Mas-Hesse, J. M., Östlin, G., & Petrosian, A. 2003, ApJ, 597, 263
- Lai et al. (2008) Lai, K., Huang, J.-S., Fazio, G., et al. 2008, ApJ, 674, 70
- Laird et al. (2009) Laird, E. S., Nandra, K., Georgakakis, A., et al. 2009, ApJS, 180, 102
- Laursen et al. (2011) Laursen, P., Sommer-Larsen, J., & Razoumov, A. O. 2011, ApJ, 728, 52
- Leauthaud et al. (2007) Leauthaud, A., Massey, R., Kneib, J.-P., et al. 2007, ApJS, 172, 219
- Lehmer et al. (2005) Lehmer, B. D., Brandt, W. N., Alexander, D. M., et al. 2005, ApJS, 161, 21
- Lilly et al. (2007) Lilly, S. J., Le Fèvre, O., Renzini, A., et al. 2007, ApJS, 172, 70
- Luo et al. (2008) Luo, B., Bauer, F. E., Brandt, W. N., et al. 2008, ApJS, 179, 19
- Markwardt (2009) Markwardt, C. B. 2009, in Astronomical Society of the Pacific Conference Series, Vol. 411, Astronomical Data Analysis Software and Systems XVIII, ed. D. A. Bohlender, D. Durand, & P. Dowler, 251
- Martin et al. (2005) Martin, D. C., Fanson, J., Schiminovich, D., et al. 2005, ApJ, 619, L1
- Morrissey et al. (2007) Morrissey, P., Conrow, T., Barlow, T. A., et al. 2007, ApJS, 173, 682
- Neufeld (1991) Neufeld, D. A. 1991, ApJ, 370, L85
- Newman et al. (2012) Newman, J. A., Cooper, M. C., Davis, M., et al. 2012, ArXiv e-prints
- Nilsson & Møller (2011) Nilsson, K. K., & Møller, P. 2011, A&A, 527, L7
- Nilsson et al. (2009) Nilsson, K. K., Tapken, C., Møller, P., et al. 2009, A&A, 498, 13
- Nilsson et al. (2007) Nilsson, K. K., Møller, P., Möller, O., et al. 2007, A&A, 471, 71
- Oesch et al. (2010) Oesch, P. A., Bouwens, R. J., Carollo, C. M., et al. 2010, ApJ, 725, L150
- Östlin et al. (2009) Östlin, G., Hayes, M., Kunth, D., et al. 2009, AJ, 138, 923
- Ouchi et al. (2008) Ouchi, M., Shimasaku, K., Akiyama, M., et al. 2008, ApJS, 176, 301
- Popesso et al. (2009) Popesso, P., Dickinson, M., Nonino, M., et al. 2009, A&A, 494, 443
- Rix et al. (2004) Rix, H.-W., Barden, M., Beckwith, S. V. W., et al. 2004, ApJS, 152, 163
- Scarlata et al. (2009) Scarlata, C., Colbert, J., Teplitz, H. I., et al. 2009, ApJ, 704, L98
- Schaerer (2003) Schaerer, D. 2003, A&A, 397, 527
- Schaerer & de Barros (2009) Schaerer, D., & de Barros, S. 2009, A&A, 502, 423
- Schaerer & Verhamme (2008) Schaerer, D., & Verhamme, A. 2008, A&A, 480, 369
- Schechter (1976) Schechter, P. 1976, ApJ, 203, 297
- Schlafly & Finkbeiner (2011) Schlafly, E. F., & Finkbeiner, D. P. 2011, ApJ, 737, 103
- Shapley et al. (2003) Shapley, A. E., Steidel, C. C., Pettini, M., & Adelberger, K. L. 2003, ApJ, 588, 65
- Shimasaku et al. (2006) Shimasaku, K., Kashikawa, N., Doi, M., et al. 2006, PASJ, 58, 313
- Silverman et al. (2010) Silverman, J. D., Mainieri, V., Salvato, M., et al. 2010, ApJS, 191, 124
- Sobral et al. (2013) Sobral, D., Smail, I., Best, P. N., et al. 2013, MNRAS, 428, 1128
- Stark et al. (2011) Stark, D. P., Ellis, R. S., & Ouchi, M. 2011, ApJ, 728, L2
- Szokoly et al. (2004) Szokoly, G. P., Bergeron, J., Hasinger, G., et al. 2004, ApJS, 155, 271
- Taniguchi et al. (2005) Taniguchi, Y., Ajiki, M., Nagao, T., et al. 2005, PASJ, 57, 165
- Treister et al. (2009) Treister, E., Virani, S., Gawiser, E., et al. 2009, ApJ, 693, 1713
- Trump et al. (2009) Trump, J. R., Impey, C. D., Elvis, M., et al. 2009, ApJ, 696, 1195
- Vanzella et al. (2008) Vanzella, E., Cristiani, S., Dickinson, M., et al. 2008, A&A, 478, 83
- Virani et al. (2006) Virani, S. N., Treister, E., Urry, C. M., & Gawiser, E. 2006, AJ, 131, 2373
- Zheng et al. (2013) Zheng, Z.-Y., Wang, J.-X., Malhotra, S., et al. 2013, ArXiv e-prints
| Name | R.A. | Decl. | NUV | FUV | log (Ly) | EWr(Ly) | log | Type(UV) | R.A.(opt) | Decl.(opt) | Offset | Type(opt) | ||
|---|---|---|---|---|---|---|---|---|---|---|---|---|---|---|
| (J2000.0) | (J2000.0) | (AB) | (AB) | (erg s-1) | (Å) | (erg cm-2s-1) | (J2000.0) | (J2000.0) | (arcsec) | |||||
| (1) | (2) | (3) | (4) | (5) | (6) | (7) | (8) | (9) | (10) | (11) | (12) | (13) | (14) | (15) |
| GALEX033111-281725iiLAE candidate not listed in BCW12 | 52.796374 | -28.290444 | 23.55 | 27.50 | 1.168 | 43.61 | 28117 | 52.796253 | -28.290321 | 0.6 | 1.164bbThis paper’s DEIMOS spectra | AGN | ||
| GALEX033112-281517 | 52.800377 | -28.254936 | 23.02 | 28.01 | 1.162 | 43.31 | 875 | 52.800663 | -28.255022 | 1.0 | 1.161b,cb,cfootnotemark: | |||
| GALEX033359-275326 | 53.499160 | -27.890792 | 22.04 | 24.13 | 1.143 | 43.53 | 632 | AGN | 53.499096 | -27.890846 | 0.3 | 1.133bbThis paper’s DEIMOS spectra | AGN | |
| GALEX033301-273227 | 53.255196 | -27.540939 | 23.45 | -27.75 | 1.135 | 43.08 | 827 | 53.255268 | -27.540880 | 0.3 | 1.136bbThis paper’s DEIMOS spectra | |||
| GALEX033146-272942 | 52.942574 | -27.495223 | 22.73 | 25.44 | 1.137 | 52.942543 | -27.495167 | 0.3 | (0.629)bbThis paper’s DEIMOS spectra,g,gfootnotemark: | |||||
| GALEX033348-280216 | 53.453649 | -28.038008 | 23.40 | 25.53 | 1.128 | 43.09 | 828 | 53.453671 | -28.038050 | 0.2 | 1.130bbThis paper’s DEIMOS spectra | |||
| GALEX033230-280804 | 53.125683 | -28.134514 | 22.34 | 23.83 | 1.124 | 43.27 | 473 | AGN | ||||||
| GALEX033120-274917 | 52.837504 | -27.821383 | 22.82 | 32.73 | 1.116 | 42.91 | 305 | 52.837444 | -27.821638 | 0.9 | 1.113bbThis paper’s DEIMOS spectra | |||
| GALEX033255-281320 | 53.231551 | -28.222466 | 22.46 | -27.50 | 1.087 | 42.95 | 283 | 53.231567 | -28.222486 | 0.1 | 1.085bbThis paper’s DEIMOS spectra | |||
| GALEX033112-281442iiLAE candidate not listed in BCW12 | 52.803095 | -28.245108 | 22.19 | -28.20 | 1.055 | 42.85 | 193 | AGN | 52.801987 | -28.244835 | 3.6 | 1.042bbThis paper’s DEIMOS spectra | ||
| GALEX033413-275940iiLAE candidate not listed in BCW12 | 53.555847 | -27.994665 | 24.21 | 26.59 | 1.052 | 42.78 | 11812 | 53.555477 | -27.994663 | 1.2 | 1.051bbThis paper’s DEIMOS spectra | AGN | ||
| GALEX033212-274913iiLAE candidate not listed in BCW12 | 53.051599 | -27.820316 | 22.68 | 27.04 | 1.053 | 42.89 | 334 | 53.051613 | -27.820168 | 0.5 | 1.048bbThis paper’s DEIMOS spectra | |||
| GALEX033200-274319 | 53.001430 | -27.722033 | 22.40 | 24.39 | 1.042 | 43.25 | 594 | -14.2 | 53.001520 | -27.722071 | 0.3 | 1.041ddRedshifts from Cooper et al. (2012) | AGN | |
| GALEX033228-273614 | 53.121022 | -27.604317 | 23.62 | 26.66 | 1.036 | 42.77 | 599 | 53.118469 | -27.604019 | 8.2 | 1.046bbThis paper’s DEIMOS spectra | |||
| GALEX033113-274949 | 52.807630 | -27.830242 | 22.45 | 31.95 | 1.031 | 42.81 | 243 | 52.807545 | -27.830231 | 0.3 | 1.026bbThis paper’s DEIMOS spectra | |||
| GALEX033331-280625iiLAE candidate not listed in BCW12 | 53.382523 | -28.107164 | 24.41 | 27.66 | 1.029 | 42.80 | 14114 | 53.382084 | -28.106623 | 2.4 | 1.026bbThis paper’s DEIMOS spectra | AGN | ||
| GALEX033202-280320 | 53.010734 | -28.055702 | 23.44 | 25.22 | 1.018 | 42.94 | 816 | -13.7 | AGN | 53.010658 | -28.055834 | 0.5 | 1.015bbThis paper’s DEIMOS spectra | AGN |
| GALEX033111-275506 | 52.798577 | -27.918436 | 23.81 | -27.52 | 1.010 | 43.12 | 16817 | 52.798473 | -27.918442 | 0.3 | 1.023bbThis paper’s DEIMOS spectra | |||
| GALEX033336-274224 | 53.402806 | -27.706674 | 23.02 | 26.37 | 0.977 | 43.22 | 1196 | -14.8 | AGN | 53.402771 | -27.706703 | 0.2 | 0.976bbThis paper’s DEIMOS spectra | |
| GALEX033204-273725 | 53.017064 | -27.623785 | 22.78 | 24.25 | 0.977 | 43.36 | 1338 | -13.6 | AGN | 53.016788 | -27.623751 | 0.9 | 0.970eeTreister et al. (2009); Szokoly et al. (2004) give | AGN |
| GALEX033246-274154 | 53.195680 | -27.698408 | 23.17 | 26.61 | 0.976 | 43.20 | 12810 | 53.196271 | -27.698547 | 2.1 | no z | |||
| GALEX033342-274035iiLAE candidate not listed in BCW12 | 53.425620 | -27.676525 | 24.73 | 26.03 | 0.956 | 42.59 | 14615 | 53.425163 | -27.676567 | 1.5 | 0.948bbThis paper’s DEIMOS spectra | |||
| GALEX033335-273934 | 53.398183 | -27.659591 | 22.54 | 23.31 | 0.949 | -14.3 | 53.398163 | -27.659760 | 0.6 | (0.622)bbThis paper’s DEIMOS spectra | ||||
| GALEX033329-280127 | 53.373274 | -28.024282 | 23.16 | 25.95 | 0.942 | 42.62 | 376 | 53.373272 | -28.024244 | 0.1 | 0.940bbThis paper’s DEIMOS spectra | |||
| GALEX033206-281408 | 53.026465 | -28.235703 | 21.79 | 25.75 | 0.913 | 43.30 | 563 | 53.026493 | -28.235905 | 0.7 | 0.909bbThis paper’s DEIMOS spectra | |||
| GALEX033044-280237 | 52.686897 | -28.043707 | 23.25 | 26.58 | 0.869 | 42.82 | 11613 | 52.686813 | -28.043819 | 0.5 | 0.859b,cb,cfootnotemark: | |||
| GALEX033042-274215iiLAE candidate not listed in BCW12 | 52.679011 | -27.704257 | 23.03 | 25.18 | 0.861 | 42.57 | 384 | 52.678730 | -27.704462 | 1.2 | 0.856bbThis paper’s DEIMOS spectra | |||
| GALEX033409-280129iiLAE candidate not listed in BCW12 | 53.541285 | -28.024923 | 23.34 | 26.40 | 0.857 | 42.63 | 606 | 53.540737 | -28.024443 | 2.5 | 0.854bbThis paper’s DEIMOS spectra | |||
| GALEX033251-280809 | 53.214351 | -28.135966 | 22.70 | 26.17 | 0.838 | 42.71 | 434 | 53.214489 | -28.136051 | 0.5 | 0.832bbThis paper’s DEIMOS spectra | |||
| GALEX033314-274834 | 53.310626 | -27.809526 | 24.23 | 25.48 | 0.830 | 42.65 | 15521 | 53.310975 | -27.809095 | 1.9 | 0.826ddRedshifts from Cooper et al. (2012) | |||
| GALEX033045-274506 | 52.689797 | -27.751818 | 23.04 | 25.67 | 0.832 | 42.74 | 636 | 52.689950 | -27.752197 | 1.4 | no zhh[alt] Two untargeted counterparts from NUV position | |||
| GALEX033405-275023iiLAE candidate not listed in BCW12 | 53.521292 | -27.839993 | 23.13 | 25.03 | 0.825 | 42.56 | 479 | 53.520832 | -27.839972 | 1.5 | 0.821bbThis paper’s DEIMOS spectra | |||
| GALEX033057-273316 | 52.739776 | -27.554542 | 22.37 | 24.09 | 0.794 | 42.73 | 383 | 52.739708 | -27.554583 | 0.3 | 0.790bbThis paper’s DEIMOS spectra | |||
| GALEX033124-275625 | 52.851698 | -27.940441 | 22.69 | 25.82 | 0.778 | 42.57 | 364 | 52.851761 | -27.940475 | 0.2 | 0.773bbThis paper’s DEIMOS spectra | |||
| GALEX033235-274059 | 53.148932 | -27.683184 | 23.67 | 25.70 | 0.745 | 42.79 | 18215 | 53.149258 | -27.683273 | 1.1 | 0.735bbThis paper’s DEIMOS spectra | |||
| GALEX033146-274846 | 52.942503 | -27.812779 | 22.98 | 25.88 | 0.742 | 42.75 | 866 | 52.942345 | -27.812771 | 0.5 | 0.736bbThis paper’s DEIMOS spectra | |||
| GALEX033100-273020iiLAE candidate not listed in BCW12 | 52.751186 | -27.505665 | 22.52 | 24.80 | 0.733 | 42.68 | 515 | 52.750877 | -27.505367 | 1.5 | 0.727bbThis paper’s DEIMOS spectra | |||
| GALEX033131-273429 | 52.880399 | -27.574774 | 22.56 | 25.77 | 0.695 | 43.28 | 28011 | -14.1 | 52.880260 | -27.574841 | 0.5 | 0.688ffSilverman et al. (2010) | AGN | |
| GALEX033321-275031iiLAE candidate not listed in BCW12 | 53.341285 | -27.842052 | 23.16 | 25.06 | 0.691 | 42.59 | 909 | AGN | ||||||
| GALEX033150-274116iiLAE candidate not listed in BCW12 | 52.962287 | -27.687773 | 22.28 | 23.15 | 0.673 | 42.70 | 545 | -14.2 | AGN | 52.962346 | -27.687700 | 0.3 | 0.667ddRedshifts from Cooper et al. (2012) |
Note. —
| Name | R.A. | Decl. | NUV | FUV | log (Ly) | EWr(Ly) | log | Type(UV) | R.A.(opt) | Decl.(opt) | Offset | Type(opt) | ||
|---|---|---|---|---|---|---|---|---|---|---|---|---|---|---|
| (J2000.0) | (J2000.0) | (AB) | (AB) | (erg s-1) | (Å) | (erg cm-2s-1) | (J2000.0) | (J2000.0) | (arcsec) | |||||
| (1) | (2) | (3) | (4) | (5) | (6) | (7) | (8) | (9) | (10) | (11) | (12) | (13) | (14) | (15) |
| GALEX142028+524640 | 215.11946 | 52.777836 | 23.41 | 26.75 | 1.131 | 42.57 | 254 | 215.11989 | 52.777527 | 1.5 | 1.134bbThis paper’s DEIMOS spectra | |||
| GALEX141814+524415 | 214.56075 | 52.737531 | 23.97 | -27.83 | 1.128 | 43.10 | 14414 | 214.56084 | 52.737473 | 0.3 | 1.123bbThis paper’s DEIMOS spectra | |||
| GALEX141950+522542 | 214.96249 | 52.428532 | 24.09 | 26.34 | 1.114 | 42.97 | 12412 | 214.96179 | 52.427998 | 2.5 | 1.111bbThis paper’s DEIMOS spectra | |||
| GALEX142013+524008 | 215.05510 | 52.669118 | 25.11 | 29.17 | 1.100 | 43.05 | 38049 | 215.05558 | 52.669342 | 1.2 | no zdd[alt] Alternative counterpart at 215.05445, 52.667969, 4.4, no z (R.A., Decl., Offset, ) | |||
| GALEX141842+522919 | 214.67858 | 52.488791 | 22.69 | 23.68 | 1.084 | 42.98 | 375 | -14.3 | 214.67863 | 52.488586 | 0.7 | 1.084bbThis paper’s DEIMOS spectra | AGN | |
| GALEX141824+522329 | 214.60416 | 52.391463 | 23.51 | 24.99 | 1.083 | 43.12 | 11012 | -13.6 | 214.60379 | 52.391666 | 1.1 | 1.081bbThis paper’s DEIMOS spectra | AGN | |
| GALEX141718+525521 | 214.32734 | 52.922402 | 22.47 | 24.41 | 1.067 | 43.58 | 1274 | AGN | 214.32666 | 52.922764 | 2.0 | 1.064bbThis paper’s DEIMOS spectra | AGN | |
| GALEX142028+522516 | 215.12077 | 52.421360 | 23.00 | 26.88 | 1.052 | 42.94 | 514 | 215.12045 | 52.421455 | 0.8 | 1.045bbThis paper’s DEIMOS spectra | AGN | ||
| GALEX141842+523735 | 214.67549 | 52.626454 | 23.07 | 25.43 | 1.038 | 43.17 | 9314 | 214.67545 | 52.625916 | 1.9 | 1.035bbThis paper’s DEIMOS spectra | AGN | ||
| GALEX141737+524236 | 214.40603 | 52.709992 | 22.20 | 26.33 | 1.027 | 43.53 | 996 | -13.3 | 214.40543 | 52.710182 | 1.5 | 1.025ccThis paper’s SALT spectra | AGN | |
| GALEX141815+530452 | 214.56554 | 53.081148 | 22.36 | 23.26 | 1.028 | 43.07 | 413 | 214.56442 | 53.081223 | 2.4 | 1.020bbThis paper’s DEIMOS spectra | AGN | ||
| GALEX142015+525024 | 215.06357 | 52.840222 | 24.04 | -28.66 | 1.021 | 43.13 | 22320 | 215.06401 | 52.840656 | 1.8 | 1.014bbThis paper’s DEIMOS spectra | |||
| GALEX142144+523627 | 215.43607 | 52.607699 | 21.83 | 24.66 | 1.011 | 43.32 | 463 | 215.43503 | 52.607677 | 2.3 | 1.006bbThis paper’s DEIMOS spectra | AGN | ||
| GALEX142027+530455 | 215.11514 | 53.081989 | 23.18 | -27.68 | 1.002 | 42.82 | 546 | -13.1 | 215.11458 | 53.081806 | 1.4 | 0.994bbThis paper’s DEIMOS spectra | AGN | |
| GALEX141851+523600 | 214.71624 | 52.600051 | 23.54 | 26.00 | 1.000 | 43.00 | 11214 | -14.1 | 214.71530 | 52.599945 | 2.1 | 0.986bbThis paper’s DEIMOS spectra | AGN | |
| GALEX142242+525245 | 215.67896 | 52.879323 | 22.07 | -26.74 | 1.003 | 42.65 | 123 | 215.67851 | 52.879360 | 1.0 | 0.999bbThis paper’s DEIMOS spectra | |||
| GALEX142033+530617 | 215.14121 | 53.104797 | 23.62 | 25.29 | 0.999 | 42.80 | 758 | -14.5 | 215.14162 | 53.105114 | 1.5 | 0.994bbThis paper’s DEIMOS spectra | ||
| GALEX141902+525637 | 214.76161 | 52.943789 | 22.47 | 24.55 | 0.984 | 42.56 | 214 | 214.76091 | 52.943871 | 1.6 | 0.980bbThis paper’s DEIMOS spectra | |||
| GALEX142207+525411 | 215.52938 | 52.903111 | 23.07 | 25.35 | 0.996 | 43.16 | 1045 | 215.52910 | 52.902931 | 0.9 | 0.994bbThis paper’s DEIMOS spectra | AGN | ||
| GALEX142148+522902 | 215.45007 | 52.484033 | 23.04 | 27.40 | 0.961 | 43.23 | 13113 | 215.44913 | 52.484470 | 2.6 | 0.961bbThis paper’s DEIMOS spectra | |||
| GALEX142244+525442 | 215.68588 | 52.911824 | 23.85 | 26.89 | 0.958 | 43.26 | 30022 | 215.68564 | 52.911930 | 0.6 | 0.954bbThis paper’s DEIMOS spectra | |||
| GALEX141746+525259 | 214.44522 | 52.882997 | 24.17 | -27.28 | 0.957 | 42.58 | 8710 | 214.44400 | 52.884399 | 5.7 | 0.957bbThis paper’s DEIMOS spectra | |||
| GALEX141946+524755 | 214.94289 | 52.798752 | 22.23 | 28.91 | 0.928 | 42.21 | 63 | 214.94319 | 52.798855 | 0.7 | 0.914bbThis paper’s DEIMOS spectra | |||
| GALEX141935+524127 | 214.89632 | 52.690888 | 22.13 | 24.21 | 0.920 | 42.72 | 203 | 214.89662 | 52.690529 | 1.4 | 0.917bbThis paper’s DEIMOS spectra | |||
| GALEX141733+530403 | 214.39094 | 53.067620 | 23.21 | 24.87 | 0.918 | 43.07 | 12010 | 214.39050 | 53.067913 | 1.4 | 0.915bbThis paper’s DEIMOS spectra | AGN | ||
| GALEX141833+525525 | 214.64107 | 52.923739 | 23.46 | 26.32 | 0.916 | 42.74 | 727 | 214.64212 | 52.924011 | 2.5 | 0.912bbThis paper’s DEIMOS spectra | |||
| GALEX142201+530637 | 215.50453 | 53.110604 | 24.13 | 25.62 | 0.912 | 43.19 | 39853 | -13.3 | 215.50462 | 53.110195 | 1.5 | 0.898bbThis paper’s DEIMOS spectra | AGN | |
| GALEX142202+530823 | 215.50844 | 53.139988 | 22.85 | 24.75 | 0.872 | 215.50819 | 53.140114 | 1.3 | (0.572)bbThis paper’s DEIMOS spectra | |||||
| GALEX142028+525839 | 215.11758 | 52.977690 | 23.30 | -27.77 | 0.870 | 42.81 | 838 | -13.9 | 215.11682 | 52.978155 | 2.3 | 0.871ccArchival DEIMOS DEEP2 spectra (Newman et al., 2012) | ||
| GALEX141800+522514 | 214.50369 | 52.420519 | 22.59 | 25.99 | 0.838 | 42.89 | 605 | 214.50280 | 52.419863 | 3.1 | 0.833ccArchival DEIMOS DEEP2 spectra (Newman et al., 2012) | |||
| GALEX141722+524209 | 214.34177 | 52.702458 | 22.26 | 26.40 | 0.838 | 43.07 | 655 | 214.34238 | 52.702278 | 1.5 | 0.838ccArchival DEIMOS DEEP2 spectra (Newman et al., 2012) | |||
| GALEX142202+522931 | 215.50918 | 52.492172 | 24.88 | 28.45 | 0.812 | 42.66 | 30752 | 215.51004 | 52.493038 | 3.6 | 0.807bbThis paper’s DEIMOS spectra | |||
| GALEX142223+525642 | 215.59777 | 52.945235 | 23.55 | 26.86 | 0.770 | 42.90 | 18721 | 215.59738 | 52.944958 | 1.3 | 0.763bbThis paper’s DEIMOS spectra | |||
| GALEX141858+523209 | 214.74578 | 52.535948 | 21.76 | 22.67 | 0.762 | 43.11 | 574 | -14.4 | 214.74509 | 52.536110 | 1.6 | 0.758bbThis paper’s DEIMOS spectra | AGN | |
| GALEX142049+523203 | 215.20764 | 52.534438 | 23.62 | 28.61 | 0.754 | 43.03 | 27321 | 215.20830 | 52.534378 | 1.5 | 0.758bbThis paper’s DEIMOS spectra | |||
| GALEX142212+522634 | 215.55384 | 52.443058 | 23.67 | 27.45 | 0.762 | 42.47 | 7911 | 215.55397 | 52.443161 | 0.5 | 0.759bbThis paper’s DEIMOS spectra | |||
| GALEX142057+525642 | 215.24117 | 52.945171 | 22.54 | 24.98 | 0.756 | 43.00 | 1016 | 215.24106 | 52.944958 | 0.8 | 0.747bbThis paper’s DEIMOS spectra | |||
| GALEX141746+525646 | 214.44476 | 52.946049 | 23.28 | 25.21 | 0.750 | 42.97 | 19122 | 214.44504 | 52.946918 | 3.2 | 0.746bbThis paper’s DEIMOS spectra | AGN | ||
| GALEX141842+522256 | 214.67524 | 52.382180 | 23.65 | 26.29 | 0.750 | 42.49 | 8516 | 214.67545 | 52.381447 | 2.7 | 0.747bbThis paper’s DEIMOS spectra | |||
| GALEX141842+530140 | 214.67697 | 53.027806 | 23.03 | 25.01 | 0.748 | 42.59 | 629 | 214.67871 | 53.028191 | 4.0 | 0.741bbThis paper’s DEIMOS spectra | |||
| GALEX142139+523401 | 215.41400 | 52.567205 | 23.82 | 26.24 | 0.741 | AGN | 215.41359 | 52.568192 | 3.8 | (0.692)bbThis paper’s DEIMOS spectra |
Note. —
| Name | R.A. | Decl. | NUV | FUV | log (Ly) | EWr(Ly) | log | Type(UV) | R.A.(opt) | Decl.(opt) | Offset | Type(opt) | ||
|---|---|---|---|---|---|---|---|---|---|---|---|---|---|---|
| (J2000.0) | (J2000.0) | (AB) | (AB) | (erg s-1) | (Å) | (erg cm-2s-1) | (J2000.0) | (J2000.0) | (arcsec) | |||||
| (1) | (2) | (3) | (4) | (5) | (6) | (7) | (8) | (9) | (10) | (11) | (12) | (13) | (14) | (15) |
| GALEX143557+350702 | 218.98764 | 35.117445 | 23.82 | -28.46 | 1.158 | 43.27 | 16926 | 218.98735 | 35.116795 | 2.5 | 1.152bbThis paper’s DEIMOS spectra | |||
| GALEX143539+351001 | 218.91250 | 35.167233 | 22.20 | 25.99 | 1.083 | 43.40 | 636 | 218.91272 | 35.167511 | 1.2 | 1.082bbThis paper’s DEIMOS spectra | |||
| GALEX143545+350039 | 218.93744 | 35.011330 | 24.17 | 26.63 | 1.063 | AGN | 218.93967 | 35.010777 | 5.9 | (0.722)bbThis paper’s DEIMOS spectra | ||||
| GALEX143520+350414 | 218.83421 | 35.070876 | 21.55 | 22.69 | 1.055 | 43.32 | 313 | -14.5 | 218.83405 | 35.070351 | 2.0 | 1.052bbThis paper’s DEIMOS spectra | AGN | |
| GALEX143824+352325 | 219.60174 | 35.390787 | 21.92 | 24.92 | 1.039 | 42.92 | 183 | AGN | 219.60257 | 35.390755 | 2.4 | 1.031bbThis paper’s DEIMOS spectra | ||
| GALEX143512+352338 | 218.80005 | 35.394162 | 24.84 | -31.03 | 1.037 | 218.80109 | 35.392956 | 4.2 | (1.080)bbThis paper’s DEIMOS spectra,c,cfootnotemark: | |||||
| GALEX143726+351448 | 219.36103 | 35.247140 | 22.44 | 24.39 | 1.034 | 43.13 | 476 | -15.1eeSource not detected in X-ray hard band but detected in the soft 0.5-2 keV flux band | ||||||
| GALEX143443+353037 | 218.68009 | 35.510756 | 23.39 | 28.50 | 1.034 | 42.85 | 618 | 218.68036 | 35.510929 | 1.0 | 1.025bbThis paper’s DEIMOS spectra | |||
| GALEX143750+350645 | 219.45954 | 35.112962 | 22.22 | 23.70 | 1.010 | -15.0 | 219.46024 | 35.113098 | 1.9 | (0.577)bbThis paper’s DEIMOS spectra | ||||
| GALEX143449+350248 | 218.70428 | 35.046988 | 23.21 | 29.53 | 1.009 | 43.60 | 3039 | -15.3 | ||||||
| GALEX143810+350424 | 219.54441 | 35.073741 | 23.73 | 26.81 | 1.006 | 43.15 | 17714 | 219.54455 | 35.073328 | 0.7 | no z | |||
| GALEX143450+352520 | 218.70844 | 35.422650 | 22.85 | 26.74 | 0.967 | 43.29 | 1227 | -14.2 | 218.70876 | 35.422508 | 1.1 | 0.964bbThis paper’s DEIMOS spectra | AGN | |
| GALEX143512+345907 | 218.79986 | 34.985750 | 24.58 | 28.79 | 0.963 | 218.80116 | 34.984894 | 3.8 | (0.884)bbThis paper’s DEIMOS spectra | |||||
| GALEX143510+351602 | 218.79406 | 35.267619 | 23.42 | 26.28 | 0.941 | 218.79521 | 35.267330 | 2.5 | (0.478)bbThis paper’s DEIMOS spectra,d,dfootnotemark: | |||||
| GALEX143639+350557 | 219.16252 | 35.099672 | 22.31 | 23.43 | 0.937 | 42.87 | 323 | 219.16257 | 35.099346 | 1.2 | 0.932bbThis paper’s DEIMOS spectra | |||
| GALEX143702+350155 | 219.26169 | 35.032282 | 22.94 | 24.99 | 0.933 | 43.34 | 14910 | -14.6 | 219.26167 | 35.032078 | 0.7 | 0.927bbThis paper’s DEIMOS spectra | AGN | |
| GALEX143531+351415 | 218.88092 | 35.237743 | 23.09 | 27.50 | 0.934 | 42.96 | 7811 | 218.88094 | 35.238354 | 2.2 | 0.930bbThis paper’s DEIMOS spectra | |||
| GALEX143730+352016 | 219.37524 | 35.338103 | 22.51 | 24.34 | 0.907 | 42.90 | 465 | 219.37563 | 35.337757 | 1.7 | 0.904bbThis paper’s DEIMOS spectra | AGN | ||
| GALEX143521+350509 | 218.83940 | 35.086214 | 21.89 | 26.57 | 0.901 | 218.83961 | 35.085414 | 2.1 | star | star | ||||
| GALEX143819+351542 | 219.58154 | 35.262070 | 23.01 | 26.70 | 0.889 | 42.63 | 399 | 219.58224 | 35.261349 | 3.3 | 0.889bbThis paper’s DEIMOS spectra | |||
| GALEX143652+350537 | 219.21699 | 35.093944 | 21.90 | 23.03 | 0.870 | 43.25 | 635 | -15.0 | 219.21677 | 35.093887 | 0.7 | 0.866bbThis paper’s DEIMOS spectra | AGN | |
| GALEX143729+350732 | 219.37419 | 35.125830 | 22.68 | 24.16 | 0.868 | 43.31 | 15111 | -15.0 | 219.37398 | 35.126053 | 1.0 | 0.860bbThis paper’s DEIMOS spectra | AGN | |
| GALEX143457+353213 | 218.73762 | 35.537287 | 21.75 | 23.02 | 0.865 | 42.82 | 213 | -14.9 | 218.73782 | 35.537319 | 0.6 | 0.857bbThis paper’s DEIMOS spectra | AGN | |
| GALEX143715+353355 | 219.31319 | 35.565674 | 22.38 | 23.84 | 0.854 | 43.27 | 12711 | -15.1eeSource not detected in X-ray hard band but detected in the soft 0.5-2 keV flux band | 219.31288 | 35.565460 | 1.2 | 0.846bbThis paper’s DEIMOS spectra | AGN | |
| GALEX143459+352504 | 218.74643 | 35.418085 | 22.48 | -28.10 | 0.848 | 218.74582 | 35.417044 | 4.0 | star | star | ||||
| GALEX143800+352206 | 219.50182 | 35.368824 | 22.24 | 24.81 | 0.829 | 42.81 | 355 | -15.4 | ||||||
| GALEX143642+345027 | 219.17868 | 34.841281 | 24.09 | 27.73 | 0.823 | 42.91 | 25449 | 219.17896 | 34.841167 | 0.9 | 0.818bbThis paper’s DEIMOS spectra | |||
| GALEX143655+344610 | 219.23087 | 34.769857 | 24.20 | 28.61 | 0.820 | 42.88 | 26930 | 219.23146 | 34.769501 | 2.2 | 0.813bbThis paper’s DEIMOS spectra | |||
| GALEX143801+352533 | 219.50452 | 35.426310 | 21.62 | 22.75 | 0.806 | 43.09 | 423 | -14.7 | ||||||
| GALEX143700+353132 | 219.25323 | 35.525830 | 22.50 | 24.40 | 0.791 | 42.96 | 757 | 219.25333 | 35.525555 | 1.0 | 0.784bbThis paper’s DEIMOS spectra | AGN | ||
| GALEX143515+353203 | 218.81441 | 35.534506 | 21.77 | 23.47 | 0.789 | 218.81459 | 35.534233 | 0.5 | (0.410)bbThis paper’s DEIMOS spectra | |||||
| GALEX143821+350707 | 219.59055 | 35.118996 | 21.62 | 23.15 | 0.741 | 43.23 | 755 | -14.8 | AGN | 219.59068 | 35.119396 | 1.5 | 0.728bbThis paper’s DEIMOS spectra | |
| GALEX143829+352308 | 219.62144 | 35.385905 | 22.19 | 24.26 | 0.720 | 42.49 | 254 | 219.62173 | 35.385715 | 1.1 | 0.710bbThis paper’s DEIMOS spectra | |||
| GALEX143716+352324 | 219.32011 | 35.390438 | 24.61 | 27.67 | 0.716 | 42.61 | 36565 | 219.31993 | 35.391083 | 2.4 | 0.699bbThis paper’s DEIMOS spectra | |||
| GALEX143813+351121 | 219.55694 | 35.189666 | 24.20 | 27.14 | 0.710 | 42.67 | 19953 | 219.55760 | 35.190166 | 2.6 | 0.717bbThis paper’s DEIMOS spectra |
Note. —
| Name | R.A. | Decl. | NUV | FUV | log (Ly) | EWr(Ly) | log | Type(UV) | R.A.(opt) | Decl.(opt) | Offset | Type(opt) | ||
|---|---|---|---|---|---|---|---|---|---|---|---|---|---|---|
| (J2000.0) | (J2000.0) | (AB) | (AB) | (erg s-1) | (Å) | (erg cm-2s-1) | (J2000.0) | (J2000.0) | (arcsec) | |||||
| (1) | (2) | (3) | (4) | (5) | (6) | (7) | (8) | (9) | (10) | (11) | (12) | (13) | (14) | (15) |
| GALEX095954+021707 | 149.97779 | 2.2852787 | 22.17 | 23.93 | 1.163 | 43.24 | 304 | -14.7 | ||||||
| GALEX100145+023237 | 150.43904 | 2.5436927 | 23.59 | 24.84 | 1.154 | 43.35 | 15813 | 150.43942 | 2.5435109 | 1.5 | 1.149bbThis paper’s DEIMOS spectra | AGN | ||
| GALEX100016+015104 | 150.06776 | 1.8512265 | 21.74 | 23.40 | 1.140 | 43.63 | 574 | -13.6 | AGN | 150.06784 | 1.8513390 | 0.5 | 1.134bbThis paper’s DEIMOS spectra | AGN |
| GALEX100031+023012 | 150.13260 | 2.5034525 | 22.72 | 25.38 | 1.103 | 43.21 | 596 | 150.13235 | 2.5033109 | 1.0 | 1.099b,cb,cfootnotemark: | |||
| GALEX095918+014933 | 149.82753 | 1.8260336 | 22.89 | 25.11 | 1.070 | 43.38 | 10910 | 149.82774 | 1.8258640 | 1.0 | 1.069b,cb,cfootnotemark: | |||
| GALEX095916+015048 | 149.81704 | 1.8467845 | 21.94 | 24.30 | 1.034 | 43.20 | 334 | -14.0 | AGN | 149.81688 | 1.8467280 | 0.6 | 1.034bbThis paper’s DEIMOS spectra | AGN |
| GALEX100141+021029 | 150.42197 | 2.1748164 | 21.83 | 23.00 | 0.989 | 43.47 | 655 | -13.5 | AGN | 150.42221 | 2.1754150 | 2.3 | 0.982dd[alt] Alternative counterpart at 218.79877, 35.394573, 4.0, (0.977)bbThis paper’s DEIMOS spectra (R.A., Decl., Offset, ) | AGN |
| GALEX100150+020936 | 150.45907 | 2.1598448 | 22.75 | 25.61 | 0.927 | 43.11 | 797 | 150.45946 | 2.1603360 | 2.3 | 0.926b,cb,cfootnotemark: | AGN | ||
| GALEX100124+021447 | 150.34970 | 2.2463910 | 22.34 | 23.46 | 0.900 | 43.23 | 778 | -13.8 | 150.34988 | 2.2461319 | 1.1 | 0.894ddArchival Magellan spectra from Trump et al. (2009) | ||
| GALEX100202+020145 | 150.51078 | 2.0290676 | 22.95 | 24.72 | 0.894 | 43.20 | 1249 | -13.6 | 150.51064 | 2.0292540 | 0.8 | 0.898ddArchival Magellan spectra from Trump et al. (2009) | AGN | |
| GALEX100049+021707 | 150.20630 | 2.2852412 | 23.88 | 24.96 | 0.877 | 42.96 | 18130 | -13.7 | 150.20627 | 2.2857921 | 2.0 | 0.874ddArchival Magellan spectra from Trump et al. (2009) | AGN | |
| GALEX100136+020653 | 150.40266 | 2.1148013 | 22.28 | 25.06 | 0.853 | 42.92 | 425 | 150.40346 | 2.1155031 | 3.8 | 0.849b,cb,cfootnotemark: | |||
| GALEX100133+015451 | 150.39033 | 1.9141639 | 21.85 | 24.96 | 0.848 | 43.02 | 373 | 150.39020 | 1.9144530 | 1.1 | 0.844b,cb,cfootnotemark: | |||
| GALEX100002+021628 | 150.00988 | 2.2746592 | 21.90 | 23.78 | 0.847 | 42.99 | 344 | -13.5 | 150.00922 | 2.2755051 | 3.9 | 0.850ddArchival Magellan spectra from Trump et al. (2009) | AGN | |
| GALEX100207+021119 | 150.53190 | 2.1886307 | 22.31 | 22.60 | 0.838 | 43.25 | 10119 | -14.0 | 150.53186 | 2.1889460 | 1.1 | 0.830ddArchival Magellan spectra from Trump et al. (2009) | ||
| GALEX100113+022548 | 150.30739 | 2.4301342 | 22.76 | 23.40 | 0.757 | -13.6 | 150.30808 | 2.4300640 | 2.5 | (0.374)eeArchival VLT spectra from Lilly et al. (2007) | AGN | |||
| GALEX100029+022129 | 150.12442 | 2.3581919 | 22.26 | 23.42 | 0.739 | 42.93 | 669 | -13.6 | AGN | 150.12370 | 2.3582580 | 2.6 | 0.728eeArchival VLT spectra from Lilly et al. (2007) | AGN |
| GALEX095910+020732 | 149.79323 | 2.1258027 | 22.12 | 22.22 | 0.730 | -14.8ffSource not detected in X-ray hard band but detected in the soft 0.5-2 keV flux band | 149.79295 | 2.1256490 | 1.1 | (0.353)ddArchival Magellan spectra from Trump et al. (2009) | ||||
| GALEX100017+020013 | 150.07274 | 2.0037061 | 22.69 | 23.04 | 0.729 | -13.6 | 150.07301 | 2.0035551 | 1.1 | (0.350)ddArchival Magellan spectra from Trump et al. (2009) | AGN |
Note. —