X-ray Emission from Eta Carinae near Periastron in 2009
I: A Two State Solution
Abstract
X-ray emission from the supermassive binary system Car declines sharply around periastron. This X-ray minimum has two distinct phases — the lowest flux phase in the first 3 weeks and a brighter phase thereafter. In 2009, the Chandra X-ray Observatory monitored the first phase five times and found the lowest observed flux at 1.910-12 ergs cm-2 s-1 (38 keV). The spectral shape changed such that the hard band above 4 keV dropped quickly at the beginning and the soft band flux gradually decreased to its lowest observed value in 2 weeks. The hard band spectrum had begun to recover by that time. This spectral variation suggests that the shocked gas producing the hottest X-ray gas near the apex of the wind-wind collision (WWC) is blocked behind the dense inner wind of the primary star, which later occults slightly cooler gas downstream. Shocked gas previously produced by the system at earlier orbital phases is suggested to produce the faint residual X-ray emission seen when the emission near the apex is completely blocked by the primary wind. The brighter phase is probably caused by the re-appearance of the WWC plasma, whose emissivity significantly declined during the occultation. We interpret this to mean that the X-ray minimum is produced by a hybrid mechanism of an occultation and a decline in emissivity of the WWC shock. We constrain timings of superior conjunction and periastron based on these results.
1 Introduction
A significant fraction of evolved massive stars are binaries (Sana et al., 2012). Strong winds with velocities of hundreds to thousands of km s-1 from two stars collide, thermalize to 107 K, and emit X-rays. The conventional theories of the wind-wind collision (WWC) phenomenon (e.g., Usov, 1992; Pittard & Stevens, 2002) suggest that the X-ray luminosity depends on the mass loss rates, the wind velocities and the binary separation. However, similar binary systems often exhibit very different X-ray properties (Gagné et al., 2012). The relation of the X-ray luminosity and the stellar parameters needs to be tested with observations.
The evolved massive binary systems, Carinae ( Car, Davidson & Humphreys, 2012) and WR 140, have highly eccentric orbits (0.9, Nielsen et al., 2007; Monnier et al., 2011; Fahed et al., 2011). Their stellar separations vary by a factor of 20, so that these systems are useful for studying the dependence of WWC X-ray activity on stellar separation. The X-ray observatory, RXTE (Bradt et al., 1993), monitored both binary systems and measured a strong increase in the X-ray luminosity that is approximately inversely proportional to the binary stellar separation, as predicted by WWC theory (e.g., Corcoran, 2005). However, sudden unpredicted declines occur in their X-ray fluxes around periastron. In particular, the X-ray decline of Car to the X-ray minimum extending for a period of 3 months in 1998.0 and 2003.5 cannot be explained by a simple eclipse model (Ishibashi et al., 1999; Parkin et al., 2011).
The unexpected X-ray behavior of Car may betray extreme physical conditions at the end of a supermassive star’s life. The primary star ( Car A) is one of the most massive stars known, with a current mass of 90 (Hillier et al., 2001), and is believed to be in the Luminous Blue Variable (LBV) stage. One hundred and seventy years after a series of great eruptions formed the bipolar Homunculus nebula (HN), Car A still drives strong winds with 8.510-4 M⊙ yr-1 and 420 km s-1 (Groh et al., 2012), whose enormous kinetic luminosity is about 51037 ergs s-1. The secondary star is not observed directly, but the WWC X-rays from kT4 keV plasma and the variable UV photoionization of nearby circumstellar clouds (Iping et al., 2005; Mehner et al., 2010) suggest it to be an O supergiant or WN star with 3000 km s-1 and 10-5 M⊙ yr-1(Pittard & Corcoran, 2002; Verner et al., 2005). These strong winds may collide in an extreme way at periastron, when the two stars pass within a few AU of each other.
The XMM-Newton (Jansen et al., 2001) and Chandra (Weisskopf et al., 2002) observations revealed two distinct states across the 2003.5 X-ray minimum (Hamaguchi et al., 2007). In the first state, which we call “the deep X-ray minimum”, the X-ray emission declined to its minimum observed value, lasting approximately 3 weeks. In the second state, which we call “the shallow X-ray minimum”, the emission abruptly increased by a factor of 3 from the deep minimum level, and then the hard band flux above 6 keV did not change at all through the shallow minimum for 1.5 months. The RXTE flux curve showed virtually identical changes across the 2003.5 minimum compared to the 1998.0 minimum, so we considered the change to be repetitive. However, something drastically changed in the system in 2009, causing the X-ray minimum to end a month earlier (Corcoran et al., 2010). This change may be due to a drop in Car’s mass loss rate or wind terminal velocity, but that explanation is controversial (Mehner et al., 2010; Teodoro et al., 2012).
| Abbreviation | Sequence ID | Observation Start | Exposure | |
|---|---|---|---|---|
| Date | (ks) | |||
| (1) | (2) | (3) | (4) | (5) |
| CXO090110 | 9933 | 2009 Jan. 10, 19:09 | 1.997 | 13.8 |
| CXO090116 | 9934 | 2009 Jan. 16, 01:27 | 2.000 | 14.2 |
| CXO090122 | 9935 | 2009 Jan. 22, 06:42 | 2.003 | 13.8 |
| CXO090129 | 9936 | 2009 Jan. 29, 06:40 | 2.006 | 13.6 |
| CXO090203 | 9937 | 2009 Feb. 3, 14:26 | 2.009 | 12.5 |
Note. — Col. (1): Abbreviation adopted for each observation. Col. (2): Observation identification number of each observation. Col. (3): Time of the observation start. Col. (4): The X-ray ephemeris in Corcoran (2005), = (JD[observation start] 2450799.792)/2024. Col. (5): Exposure time excluding the detector deadtime.
In 2003, Chandra and XMM-Newton performed four pointed observations during the shallow minimum, but both acquired only one observation each during the deep minimum. Since the X-ray flux dropped below the RXTE sky background during the minimum, we could not measure with RXTE the flux variation during the deep minimum, which is crucial to understand the cause of the X-ray decline. To better define the X-ray spectrum, we performed 5 Chandra observations around the deep minimum of 2009.0. This paper reports their flux variations and discusses their origin.
2 Observations
We observed Car with the Chandra X-ray observatory five times at 57 day intervals across the 2009.0 deep X-ray minimum (Table 1). Chandra observations during the deep minimum are required to spatially resolve emission from the binary from the other nearby emission sources, including time-delayed X-ray emission reflected from the HN (Corcoran et al., 2004). We placed Car on the ACIS-S3 chip, which has good quantum efficiency and energy resolution between 0.38 keV. To minimize photon pile-up and instrumental dead time, we used the 1/8 window mode with 0.4 sec frame exposures. We used the analysis software CIAO version 4.3, which employs the energy-dependent sub-pixel event-repositioning (EDSER) algorithm. Following Hamaguchi et al. (2007), individual Chandra observations are designated CXO, subscripted with the year, month and day of the observation.
Eta Carinae was relatively bright in the first observation, CXO090110, a few days before the onset of the deep X-ray minimum, and suffered mild photon pile-up of 9.7 %. During subsequent observations, the photon count rate was sufficiently low that pile-up was unimportant.
3 Results
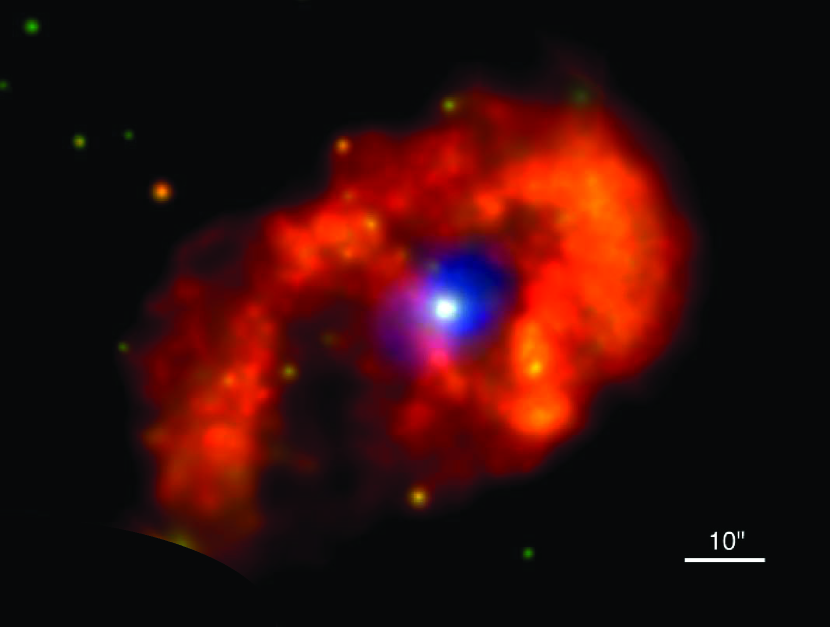
During each observation, Chandra detected a point-like source centered on the star (Figure 1). As seen in the 2003.5 deep minimum image (Corcoran et al., 2004), the central point source (CPS) is embedded in an extended 18′′ hard X-ray source, which is the X-ray emission produced by the WWC, reflected from the bipolar lobes of the HN (Corcoran et al., 2004). These hard X-ray sources are surrounded by soft X-ray emission extending to 1′ (Seward et al., 2001). The faint diffuse structure of the soft X-ray emission is seen clearly, thanks to the good sensitivity of the ACIS-S imaging in the soft band.
We derived absolute coordinates of the CPS in each observation. With the source detection software wavdetect in the CIAO package, we measured the CPS position along with other detected X-ray sources above 4 significance in the fov111For this measurement, we use data calibrated with the CIAO version 4.2 and used the SER method for the sub-pixel algorithm (Li et al., 2003, 2004; Tsunemi et al., 2001).. We cross-correlated the detected sources except for the CPS with the X-ray sources identified in the Chandra Carina Complex Project (Townsley et al., 2011) and shifted the coordinate frame of each observation to match them. The fov shift was 0.33′′ on average. All the CPS coordinates after this adjustment fell within 0.2′′ from the position of Car, which is within the accuracy of the Chandra positional determination.
We also measured the CPS source size for each observation with the CIAO tool srcextent. The CPS size does not change significantly between observations at 0.50′′ 0.01′′ (1), and is slightly larger than the PSF images at 0.44′′0.04′′ (1), produced with MARX222http://space.mit.edu/CXC/MARX/ simulations for similar observing conditions. Based on this, the CPS could be extended up to 0.2′′(460 AU at = 2.3 kpc).
We extracted X-ray light curves and spectra within 1.5′′ from the CPS peak, which include more than 95% of the total point-source flux. We obtained background within 2′ from Car, excluding areas with X-ray emission associated with Car (40′′), X-ray sources detected at above the 4 level and areas of smaller exposure due to the satellite dithering motion. We produced light curves with 1 ksec binning from individual observations; these did not show any significant variations.
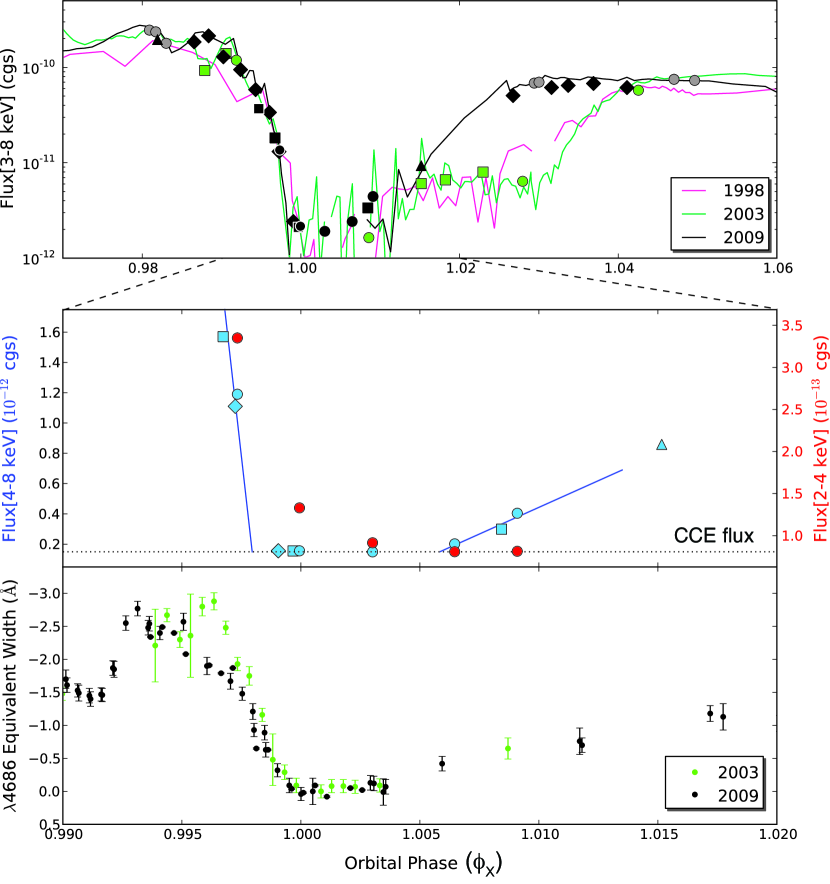
We measured the CPS fluxes for individual observations between 3–8 keV from fits to their spectra by an empirical model (bremsstrahlung emission plus 6 Gaussian lines, multiplied by photoelectric absorption) with XSPEC (Arnaud, 1996). We also convolved the pileup model for a fit to the CXO090110 spectrum to account for photon pile-up. The top panel of Figure 2 plots the CPS flux variation. We also added the CPS fluxes measured with XMM-Newton, Suzaku (Mitsuda et al., 2007), Swift (Burrows et al., 2005), and Chandra HETGS observations between the orbital phases 0.971.06, excluding the Suzaku observation at the middle of the deep X-ray minimum, for which the unresolved X-ray contamination of the HN and surrounding sources is not easy to estimate. For comparison to the earlier published papers, we also overlay the RXTE/PCA light curves in the 210 keV band. The RXTE fov of 1∘ (FWHM) includes many X-ray sources in the field, among which the brightest hard X-ray source is the Wolf-Rayet (WR) binary, WR25. We subtracted the estimated contribution of WR 25 (Pollock et al. in preparation) corrected for the collimator response (96% at the location of WR 25) from the RXTE light curve. We also corrected the RXTE light curve of the CPS for X-ray emission from weak sources in the RXTE fov, which we estimated from our Chandra deep-minimum observations. We then converted the RXTE count rates to the energy flux assuming emission from a kT= 4.5 keV plasma suffering absorption of NH= 51022 cm-2, which is appropriate for the absorption through the HN (Hamaguchi et al., 2007). The RXTE light curves nicely match measurements by the other X-ray imaging observatories.
The first Chandra observation (CXO090110) was performed when the X-ray flux was rapidly declining from maximum to minimum. From this observation to CXO090116, the X-ray flux between 38 keV dropped by a factor of 6 and decreased slightly more by CXO090122 to its minimum observed of 1.910-12 ergs cm-2 s-1. It then recovered slightly by the 4th observation and further increased by the 5th observation.
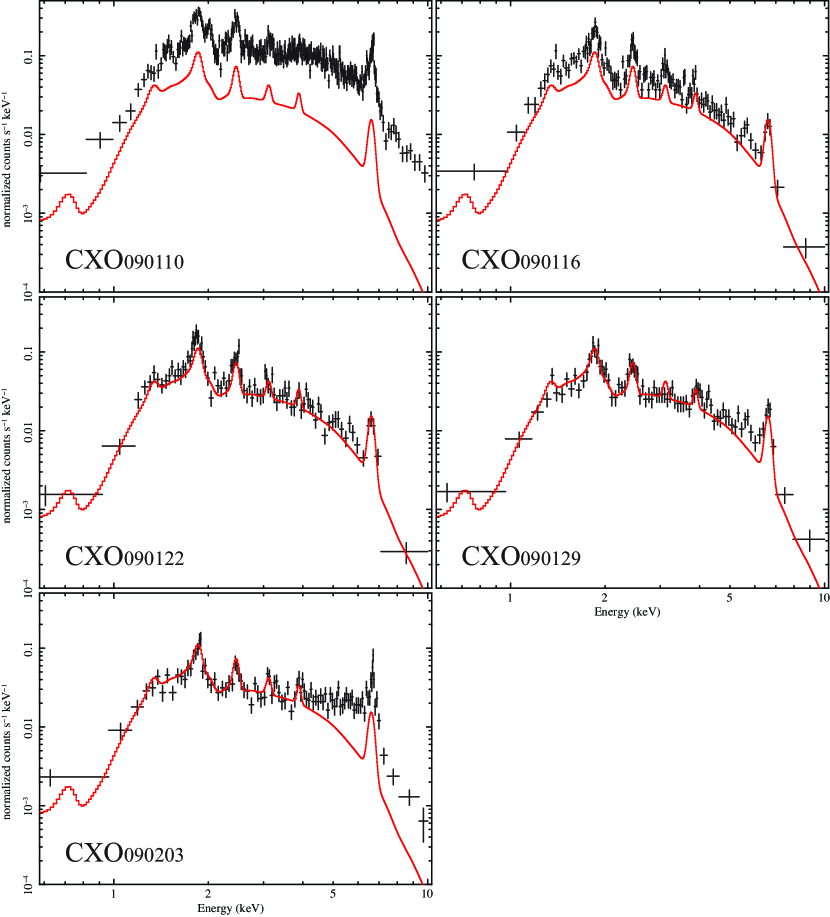
Figure 3 shows spectra of the CPS from all the Chandra observations. Through these Chandra observations, the emission was strong between 110 keV, with multiple emission lines from Fe, Ca, Ar, S, Si and Mg ions. From CXO090110 to CXO090116, the flux declined by a factor of 34 in both the hard and soft bands (middle panel of Figure 2). After that, the hard band (6 keV) spectrum did not change through CXO090122, but then it gradually increased at CXO090203. The soft band spectrum gradually decreased until CXO090129 and then stayed at that level. Thus the hard X-ray emission reached its minimum value between CXOCXO090122, while the soft X-ray minimum was not reached until sometime between CXO090122 and CXO090129.
This result clearly shows that the emission from the CPS at its lowest flux is due to the Central Constant Emission (CCE) component discovered by Hamaguchi et al. (2007). The CCE probably arises from stable hot plasma bubbles outside of the binary system, which are thermalized by collision of ambient gas with the secondary’s stellar winds ejected in previous orbital cycles as seen in 3-D SPH models (Russell, 2013; Madura et al., 2013). The Chandra observations in 2009 now show that this spectrum extends up to 10 keV, as we discuss more fully in an upcoming paper (Hamaguchi et al., in preparation).
4 Discussion
X-ray emission from the WWC region is the excess over the CCE contribution, that is, the excess above the solid lines in Figure 3. Hard X-ray emission from the WWC diminished first just before CXO090116 and began to recover by CXO090129. Soft X-ray emission from the WWC gradually faded until sometime between CXO090122 and CXO090129. The WWC spectrum in CXO090203 showed the strongest soft band cut-off among the 2003 and 2009 observations. We fit this residual WWC component in CXO090203 by an absorbed one temperature plasma model with a Gaussian for the fluorescent iron K line, fixing the plasma temperature at 4 keV and assuming the solar elemental abundances for both the plasma and cold absorber. The absorption column density is, then, NH 1024 cm-2, the highest among the Car observations. These results suggest that the hottest X-ray emitting plasma (kT 3 keV) is localized near the leading side of the bow-shock apex, which enters into and emerges from an X-ray thick absorbing region; the softer emission (kT 3 keV) is mostly produced in an extended region associated with the tail of the bow shock, which succeedingly enters behind the thick primary wind. In this model, the deep minimum is produced by an eclipse of the WWC plasma. The Chandra data show that the onset and end of the deep minimum, barely seen in the RXTE light curve, are similar among 1998, 2003 and 2009, which shows that this event is caused solely by orbital motion. The flux difference at between 2003 and 2009 (the green and black filled circles in the top panel of Figure 2) may be caused by a change in the CCE spectrum or in the blocking material or both. A detailed discussion of this point will be discussed in an upcoming paper.
Since the WWC apex is located between the primary and secondary stars, the deepest part of the X-ray minimum marks the time of superior conjunction. The exact timing of the deepest eclipse is not easy to estimate because, near periastron, the secondary star moves rapidly relative to the primary; the size, relative location and intrinsic luminosity of the WWC plasma change quickly. Nevertheless, linear extrapolations of the hard band (48 keV) light curve before and after the hard X-ray minimum (see the middle panel of Figure 2) suggests that the deepest eclipse of the WWC apex occurs between Jan 12 and Jan 28, so that superior conjunction occurs within this timespan. The onset of the deep minimum, Jan 12, was 4 days earlier than the predicted using the ephemeris in Corcoran (2005). This may suggest that the orbital period is a few days shorter than 2024 days, as suggested by Damineli et al. (2008).
The shallow minimum was not clearly seen in 2009, but there may be a brief shallow minimum interval seen by Suzaku at 1.015 in 2009. The strong variation in the X-ray light curves between 2003 and 2009, possibly due to the wind momentum change (Corcoran et al., 2010), occurred during the shallow minimum. This suggests that the low X-ray activity seen during the shallow minimum is caused by the collapse of the WWC activity around periastron. The X-ray light curve in 2003 clearly shows a remaining X-ray activity above the CCE flux level during the shallow minimum. Since the observed hard X-ray emission above 6 keV did not change significantly during the shallow minimum in 2003 (see Figure 4 in Hamaguchi et al., 2007), this hard X-ray emission must not depend on the orbital motion of the companion. This residual emission perhaps arises from shocked gas produced by the collision of the companion’s wind with the ”wall” of primary wind extending behind the companion near periastron. The complete X-ray minimum seen by RXTE is thus the result of a hybrid mechanism: an eclipse of the WWC plasma during the deep minimum followed by a collapse of the WWC activity seen during the shallow minimum.
The collapse of the WWC shock is very probably related to the extreme environment near periastron, e.g., high density (which could produce a dramatic increase in the cooling rate) or strong UV radiation (which could radiatively inhibit the companion’s wind). This suggests that periastron passage occurs sometime during the decay of the intrinsic X-ray activity. Since the WWC emission is not seen directly during the deep minimum, the wind collapse may have started earlier than the shallow minimum, which is defined by transition of the observed X-ray light curve: the onset of the wind collapse can be as early as the start of the deep minimum. The RXTE light curve starts to recover by Feb. 18, so that the WWC collapse, and periastron passage, probably occurs between 0.9981.016. In this solution, periastron comes around superior conjunction, i.e., our view from the argument of periapsis () around 270∘. This is consistent with a 3-D hydrodynamic simulation of the X-ray light curve (Okazaki et al., 2008; Parkin et al., 2011; Russell, 2013).
The hard X-ray emission from the WWC region dropped concurrently with the He II Å emission line (Teodoro et al., 2012, see middle and bottom panels of Figure 2). The HeII Å emission line dropped on Jan 151 and recovered on Jan 262, which agrees quite well with the hard X-ray drop between Jan 12 and Jan 28. This result indicates that the He II Å line is produced near the WWC apex. The HeII Å line requires recombination of He++ ions (Steiner & Damineli, 2004; Martin et al., 2006; Teodoro et al., 2012), which in principle can be supplied by shocks at the WWC apex.
The intrinsic WWC activity is still strong at the beginning of the deep minimum, so that the occulter must be sufficiently optically thick to block WWC X-rays up to 10 keV (optical depth below 10 keV when NH 51023 cm-2). One candidate for the occulter is the photosphere of Car A itself. Within the expected ranges of orbital parameters (0.850.95, 240285∘, inclination 3555∘, wind momentum ratio 0.24), the occulter has to be 180320 R⊙ to block the hard X-ray emission for 7.810-3, the phase interval of the hard X-ray drop during the deep minimum. This is significantly larger than the current best estimate of the primary stellar radius (60R⊙), which has, however, large uncertainty (Hillier et al., 2001). Another candidate is the primary wind. When we assume a smooth wind of the solar abundance matter flowing with the velocity of 420 km s-1 and the mass loss rate of 8.510-4 M⊙ yr-1 (Groh et al., 2012), the hydrogen column density to the WWC apex can be as high as 81024 cm-2 at the impact parameter of 500 R⊙, which is enough to block X-ray emission at 10 keV. The X-ray spectrum of CXO090203 shows an absorption column to the WWC emission of NH 1024 cm-2(assuming solar abundance). The absorption column to the WWC plasma would be much higher than this NH in the middle of the deep minimum.
5 Summary
Chandra observations during the X-ray minimum in 2009 have for the first time given us a detailed picture of the behavior of X-ray emission from the WWC between the primary and secondary stars in the extremely massive, long-period, highly eccentric binary Car. We interpret the observed spectrum variations as driven by orbital motion: an initial occultation of the apex of the wind-wind bow shock followed by a disruption of the shock due to increase in density and/or UV radiation near periastron passage. Using these data, we constrain superior conjunction to occur between X-ray phase 0.9981.006, and periastron passage to occur in the X-ray phase interval 0.9981.016. The large opacity at high energies during the “deep minimum” suggests occultation by the thick inner wind or by the stellar photosphere of the primary LBV itself. If the latter, then the periastron distance is comparable to the radius of the primary star’s photosphere.
References
- Arnaud (1996) Arnaud, K. A. 1996, in Astronomical Society of the Pacific Conference Series, Vol. 101, Astronomical Data Analysis Software and Systems V, ed. G. H. Jacoby & J. Barnes, 17
- Bradt et al. (1993) Bradt, H. V., Rothschild, R. E., & Swank, J. H. 1993, A&AS, 97, 355
- Burrows et al. (2005) Burrows, D. N., Hill, J. E., Nousek, J. A., et al. 2005, Space Sci. Rev., 120, 165
- Corcoran (2005) Corcoran, M. F. 2005, AJ, 129, 2018
- Corcoran et al. (2004) Corcoran, M. F., Hamaguchi, K., Gull, T., et al. 2004, ApJ, 613, 381
- Corcoran et al. (2010) Corcoran, M. F., Hamaguchi, K., Pittard, J. M., et al. A. 2010, ApJ, 725, 1528
- Damineli et al. (2008) Damineli, A., Hillier, D. J., Corcoran, M. F., et al. 2008, MNRAS, 384, 1649
- Davidson & Humphreys (2012) Davidson, K., & Humphreys, R. M., eds. 2012, Astrophysics and Space Science Library, Vol. 384, Eta Carinae and the Supernova Impostors
- Fahed et al. (2011) Fahed, R., Moffat, A. F. J., Zorec, J., et al. 2011, MNRAS, 1711
- Gagné et al. (2012) Gagné, M., Fehon, G., Savoy, M. R., et al. 2012, in Astronomical Society of the Pacific Conference Series, Vol. 465, Astronomical Society of the Pacific Conference Series, ed. L. Drissen, C. Rubert, N. St-Louis, & A. F. J. Moffat, 301
- Groh et al. (2012) Groh, J. H., Hillier, D. J., Madura, T. I., & Weigelt, G. 2012, MNRAS, 423, 1623
- Hamaguchi et al. (2007) Hamaguchi, K., Corcoran, M. F., Gull, T., et al. 2007, ApJ, 663, 522
- Hillier et al. (2001) Hillier, D. J., Davidson, K., Ishibashi, K., & Gull, T. 2001, ApJ, 553, 837
- Iping et al. (2005) Iping, R. C., Sonneborn, G., Gull, T. R., Massa, D. L., & Hillier, D. J. 2005, ApJ, 633, L37
- Ishibashi et al. (1999) Ishibashi, K., Corcoran, M. F., Davidson, K., et al. 1999, ApJ, 524, 983
- Jansen et al. (2001) Jansen, F., Lumb, D., Altieri, B., et al. 2001, A&A, 365, L1
- Li et al. (2003) Li, J., Kastner, J. H., Prigozhin, G. Y., & Schulz, N. S. 2003, ApJ, 590, 586
- Li et al. (2004) Li, J., Kastner, J. H., Prigozhin, G. Y., et al. 2004, ApJ, 610, 1204
- Madura et al. (2013) Madura, T. I., Gull, T. R., Okazaki, A. T., et al. 2013, MNRAS, submitted
- Martin et al. (2006) Martin, J. C., Davidson, K., Humphreys, R. M., Hillier, D. J., & Ishibashi, K. 2006, ApJ, 640, 474
- Mehner et al. (2010) Mehner, A., Davidson, K., Humphreys, R. M., et al. 2010, ApJ, 717, L22
- Mitsuda et al. (2007) Mitsuda, K., Bautz, M., Inoue, H., et al. 2007, PASJ, 59, 1
- Monnier et al. (2011) Monnier, J. D., Zhao, M., Pedretti, E., et al. 2011, ApJ, 742, L1
- Nielsen et al. (2007) Nielsen, K. E., Corcoran, M. F., Gull, T. R., et al. 2007, ApJ, 660, 669
- Okazaki et al. (2008) Okazaki, A. T., Owocki, S. P., Russell, C. M. P., & Corcoran, M. F. 2008, MNRAS, 388, L39
- Parkin et al. (2011) Parkin, E. R., Pittard, J. M., Corcoran, M. F., & Hamaguchi, K. 2011, ApJ, 726, 105
- Pittard & Corcoran (2002) Pittard, J. M., & Corcoran, M. F. 2002, A&A, 383, 636
- Pittard & Stevens (2002) Pittard, J. M., & Stevens, I. R. 2002, A&A, 388, L20
- Russell (2013) Russell, C. M. P. 2013, PhD thesis, University of Delaware
- Sana et al. (2012) Sana, H., de Mink, S. E., de Koter, A., et al. 2012, Science, 337, 444
- Seward et al. (2001) Seward, F. D., Butt, Y. M., Karovska, M., et al. 2001, ApJ, 553, 832
- Steiner & Damineli (2004) Steiner, J. E., & Damineli, A. 2004, ApJ, 612, L133
- Teodoro et al. (2012) Teodoro, M., Damineli, A., Arias, J. I., et al. 2012, ApJ, 746, 73
- Townsley et al. (2011) Townsley, L. K., Broos, P. S., Chu, Y.-H., et al. 2011, ApJS, 194, 15
- Tsunemi et al. (2001) Tsunemi, H., Mori, K., Miyata, et al. 2001, ApJ, 554, 496
- Usov (1992) Usov, V. V. 1992, ApJ, 389, 635
- Verner et al. (2005) Verner, E., Bruhweiler, F., & Gull, T. 2005, ApJ, 624, 973
- Weisskopf et al. (2002) Weisskopf, M. C., Brinkman, B., Canizares, C., et al. 2002, PASP, 114, 1