Chandra and MMT observations of low-mass black hole active galactic nuclei accreting at low rates in dwarf galaxies
Abstract
We report on Chandra X-ray observations of four candidate low-mass black hole ( ) active galactic nuclei (AGNs) that have the estimated Eddington ratios among the lowest () found for this class. The aims are to validate the nature of their AGNs and to confirm the low Eddington ratios that are derived from the broad H line, and to explore this poorly studied regime in the AGN parameter space. Among them, two objects with the lowest significance of the broad lines are also observed with Multi-Mirror Telescope, and the high-quality optical spectra taken confirm them as Seyfert 1 AGNs and as having small black hole masses. X-ray emission is detected from the nuclei of two of the galaxies, which is variable on timescales of s, whereas no significant (or only marginal at best) detection is found for the remaining two. The X-ray luminosities are on the order of or even lower, on the order of for non-detections, which are among the lowest regimes ever probed for Seyfert galaxies. The low X-ray luminosities, compared to their black hole masses derived from H, confirm their low accretion rates assuming typical bolometric corrections. Our results hint at the existence of a possibly large population of under-luminous low-mass black holes in the local universe. An off-nucleus ultra-luminous X-ray source in one of the dwarf galaxies is detected serendipitously, with a luminosity (6–9) in 2–10 keV.
Subject headings:
galaxies: active – galaxies: nuclei – galaxies: Seyfert – X-rays: galaxies1. Introduction
Black holes (BHs) with masses in the range of , termed intermediate-mass BHs (IMBHs), are an astrophysically and cosmologically important class linking stellar mass BHs and massive/supermassive BHs at the center of galaxies. They can be found by virtue of the accretion-powered radiation shining as active galactic nuclei (AGNs) in nearby small/dwarf galaxies, albeit much less luminous than their more massive counterparts. However, only a few hundred IMBHs are known so far, and very few have been studied in detail.111 These include, e.g., NGC 4395—the prototype and the best-studied of this type (e.g. Filippenko et al., 1993; Lira et al., 1999; Filippenko & Ho, 2003), POX 52 (Barth et al., 2004) and SDSS J160531.84+174826.1 (Dong X.-B. et al., 2007) Their apparent rarity, as indicated by the turnover of the (observed) mass function of BHs in AGNs toward the lower end (Greene & Ho, 2007a), raises a question as to whether they are truly scarce in the universe or there exists a large population yet to be discovered. In another word, whether the majority of dwarf galaxies—the most abundant galactic population and building blocks of large galaxies—harbor a BH at their centers. The answer, whatever it is, would have significant implications for testing and constraining models of the birth and growth of galaxies and BHs (e.g. Volonteri et al., 2008).
The first samples of AGNs with BH masses at the lower end of the mass function ( ) 222Following Greene & Ho (2007b) and Dong X.-B. et al. (2012), we refer to such BHs as low-mass BHs and to AGNs hosting them as low-mass AGNs throughout the paper. were found by Greene & Ho (2004, 2007b) from the Sloan Digital Sky Survey (SDSS). Most of those AGNs have (relatively) high Eddington ratios (), based on BH masses estimated from the broad H line. The apparent dearth of (relatively) low-accretion low-mass AGNs () naturally explains the observed drop in the BH mass function below . It is not yet settled by observations that, whether there is a true decline or even a cutoff in the BH mass function as discussed theoretically (e.g. a few times as in Haehnelt et al. 1998), or if this is simply a selection bias. The latter comes into play since low-mass AGNs accreting at low rates are difficult to detect for the extreme faintness of their continuum and line luminosities (e.g. an AGN with = has a bolometric luminosity of for =0.01), and the dilution by host galaxy starlight further aggravates the situation. To bear this out, low-accretion-rate, low-mass AGNs are to be sought out observationally as a population.
Few low-mass AGNs have been found with reliably measured low thus far, however, because the multi-waveband spectral energy distribution (SED) is difficult to observe. The best case known is NGC 4395, which happens to be a low-Eddington ratio object with depending on the measured value (e.g. Filippenko & Ho, 2003; Peterson et al., 2005; Moran et al., 2005; Iwasawa et al., 2010), which is possibly the lowest among low-mass AGNs observed333 This is in contrast to Seyfert galaxies with supermassive BHs ( ), in which as low as were found (Ho, 2009; Singh et al., 2011). In fact, in homogeneously selected AGN samples the observed lower bound of the distribution increases with decreasing , which may be explained by selection biases (see Dong X. et al. 2012). . It is the least luminous Seyfert 1 nucleus (Filippenko et al., 1993), with of the order of based on the multi-waveband SED, which happens to be comparable to the empirical estimate from the monochromatic luminosity (Iwasawa et al., 2010). It was detected by virtue of its proximity and the absence of a galactic bulge, hence the reduced diluting starlight. There are more candidates in the less stringent sense where the bolometric luminosities are estimated from only one waveband. A small number of low-mass AGNs with estimated from H have been found in the Greene & Ho (2007b) sample. A few more possible candidates may have also been found in the search of weak AGN activity in nearby (small) galaxies in other wavebands (X-ray, infrared, radio) in some of the recent studies (Desroches & Ho, 2009; Satyapal et al., 2008), but their Eddington ratios are subject to large uncertainties due to a lack of reasonable estimation of .
In a recent search of low-mass AGNs designed to be more complete and homogeneous, we (Dong X.-B. et al., 2012) presented a sample of 309 objects (hereafter D12 sample) selected from the forth SDSS data release (DR4), finding more low-accreting systems down to , and in 30% of the objects. If the estimates, which are solely based on the broad H line luminosities (the values were estimated from the broad H line widths and luminosities using the same formalism as in Greene & Ho 2007b), are largely correct, this finding has at least two implications. First, the presence of a postulated population of low-mass BHs accreting at low rates can thus be anchored to observations. This would naturally hint at the possible existence of a continuous distribution in the accretion rate for low-mass BHs and, hence, a population of low-mass BHs with weak activity. Second, concerning theory and observation of BH accretion physics, this regime in the parameter space is largely unexplored. They may provide a clue that may reconcile some of the observed differences between massive BSs and stellar-mass BHs in X-ray binaries.
However, the estimation of the Eddington ratios based on H (especially for low- objects) may be susceptible to some effects, and thus independent scrutiny is essential. First, the measurement of the broad H component in low- systems (hence low H luminosity) has large uncertainties, owing to their narrowness and weakness and to the uncertainty in subtracting starlight from the host galaxy (see Dong X. et al. 2012 for details). Second, it is susceptible to dust reddening, which is also difficult to measure from either the AGN continuum or the Balmer decrement of the broad emission lines due to their faintness. Although the measurements of the Balmer decrement are considered to be reliable for the D12 sample in a statistical sense, which is consistent with no dust reddening for the bulk of the sample, the exact value for individual objects may suffer from large uncertainties.
X-ray observation is a powerful tool to verify their AGN nature and to estimate the bolometric luminosity independently. Given their expected low luminosities, not much brighter than off-nucleus ultra-luminous X-ray sources (ULXs), both high spatial resolution and high sensitivity are needed. As a pilot study along this line, with Chandra, we observed a small sample of four candidate low-mass, low- () AGNs selected from the SDSS, which are among the lowest found of this class. Among them, two objects have significance levels among the lowest of SDSS low-mass AGNs in terms of the detection of the broad H and H lines, owing partly to their weakness and narrowness and partly to the contaminating stellar spectrum. In order to scrutinize the reliability of their broad H/H lines and, thus, their low-mass BH nature, we also observed these two objects with the Multi-Mirror Telescope (MMT) to acquire optical spectra with better spatial resolution (i.e. smaller aperture size, so as to reduce starlight contamination) and higher signal-to-noise ratio (S/N) than those of the SDSS spectra. In this paper, we report the results from our Chandra and MMT observations. We assume a cosmology with = 70 km s-1 Mpc-1, , and .
2. Sample
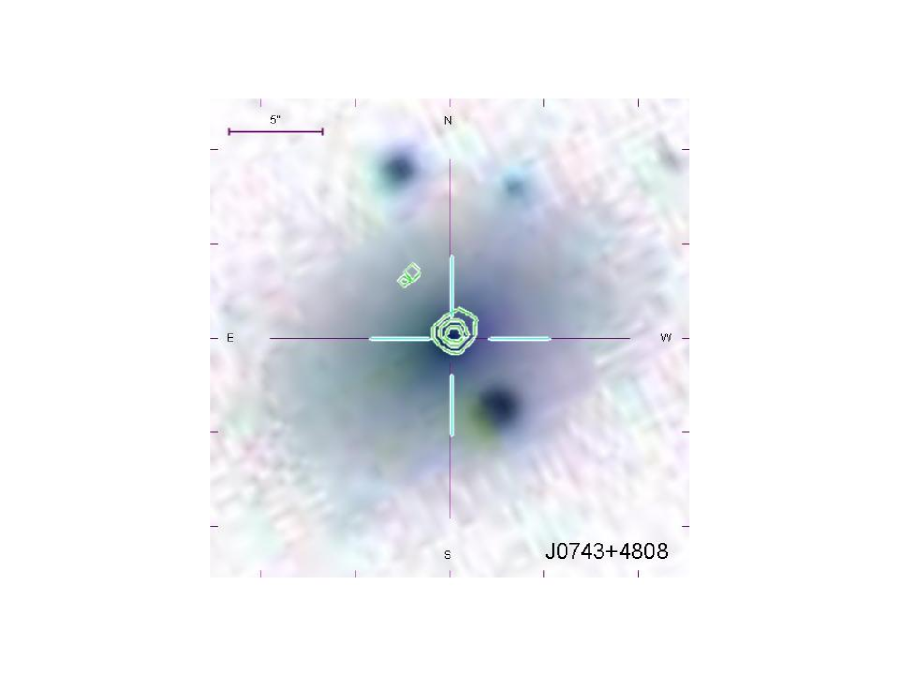
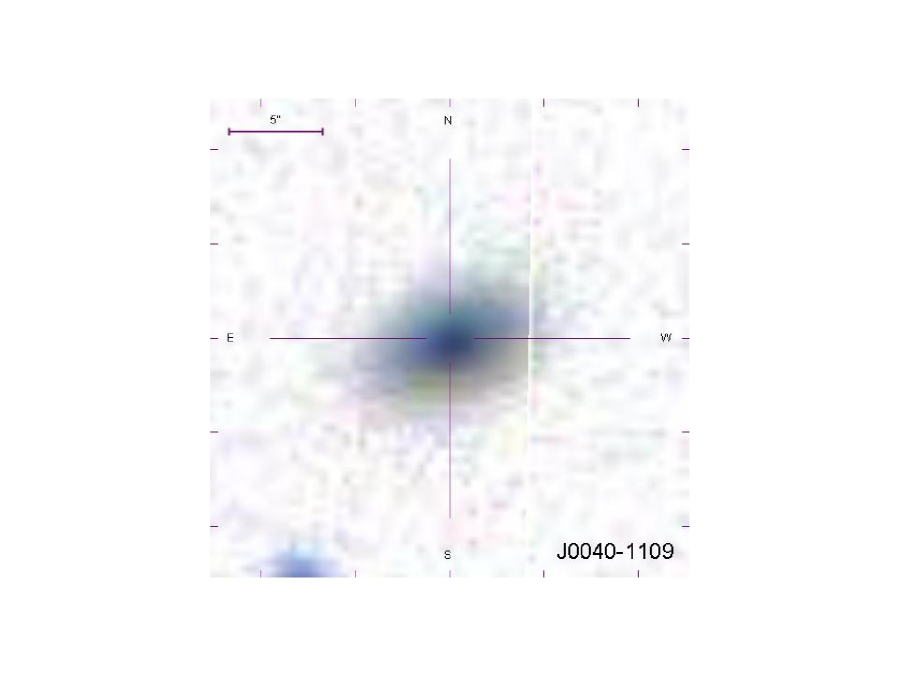
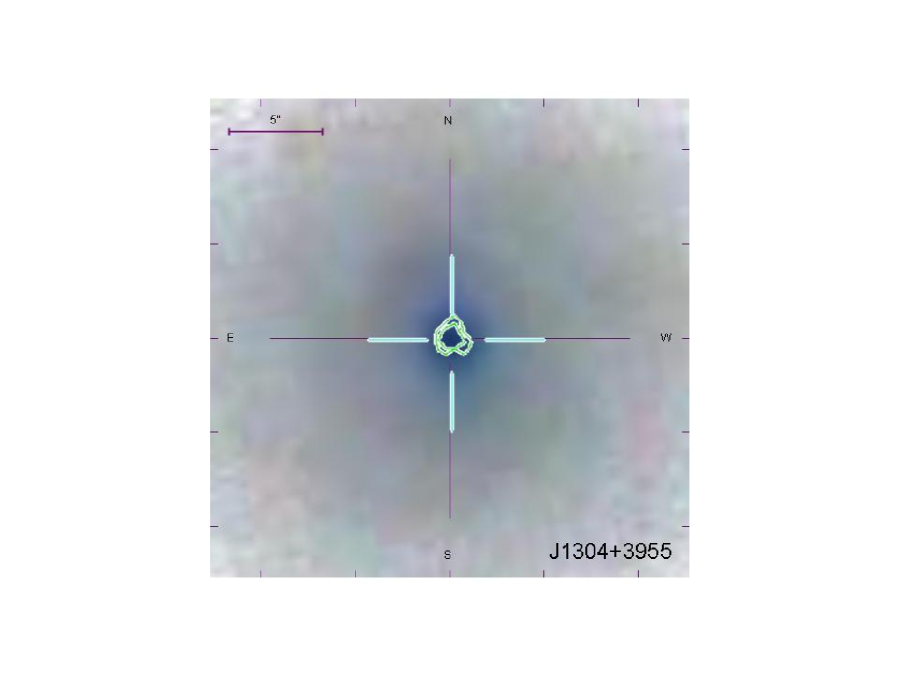
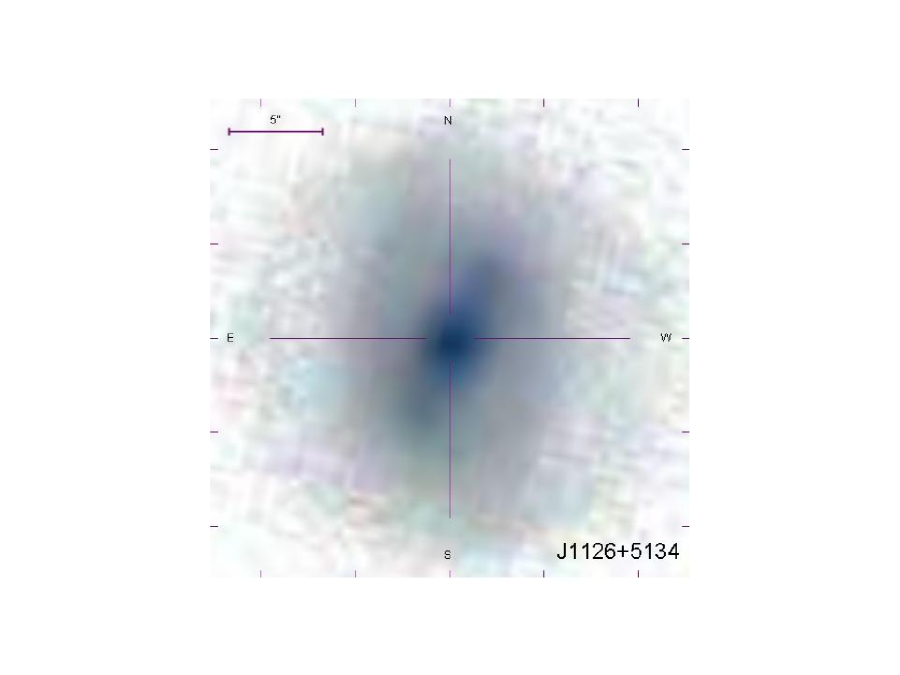
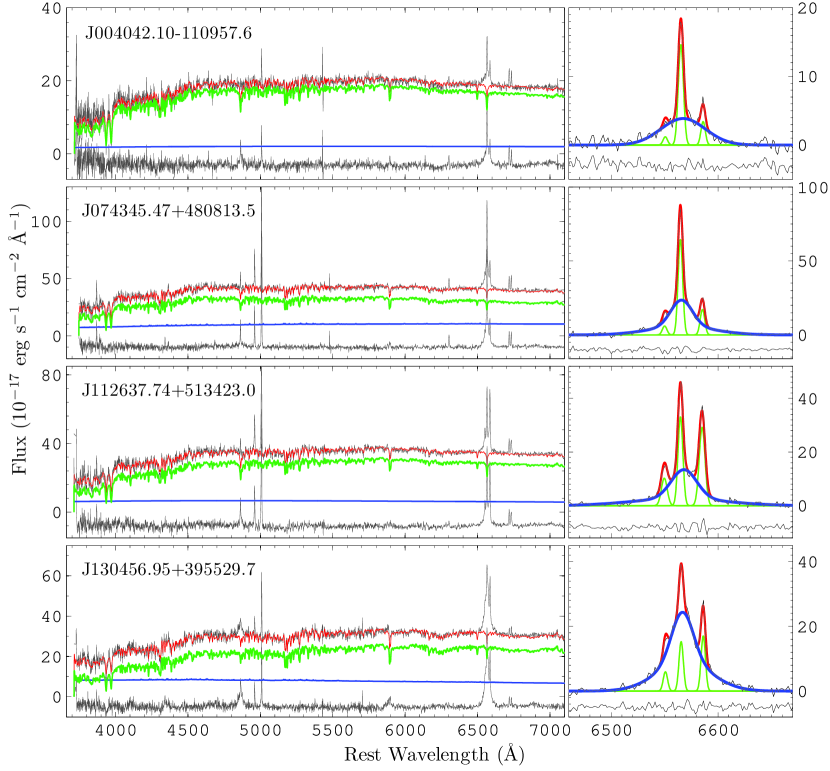
We selected candidate low-accretion low-mass AGNs from the SDSS DR5, and a number of objects with the lowest Eddington ratios () were found. We chose the nearest four objects within 100 Mpc in consideration of easy detection in X-ray (Table 1). Their optical images taken by the SDSS are shown in Figure 1. Two objects among them, J004042.10110957.6 and J112637.74+513423.0 (referred to as J00401109 and J1126+5134 hereafter), have been presented in the D12 sample selected from the SDSS DR4. The remaining two objects, SDSS J074345.47+480813.5 (J0743+4808) and J130456.95+395529.7 (J1304+3955), only available in the DR5, are selected using exactly the same data analysis and selection procedures 444 We used an elaborate spectral analysis algorithm, which performs spectral decomposition of AGN and the host galaxy starlight and de-blending of the broad and narrow emission lines. The black hole masses, bolometric luminosities and Eddington ratios were estimated in the same way as in Greene & Ho (2007b), which makes use of the luminosity and FWHM of the broad H line, Å) (McLure & Dunlop, 2004), and the Å–H luminosity relation (Greene & Ho, 2005). See Dong X.-B. et al. (2012) for details. as described in Dong X.-B. et al. (2012). The spectra where they were identified, as well as those of the two objects in the D12 sample, are shown in Figure 2 along with the best-fit spectral models (see Dong X.-B. et al. 2012 for the method of spectral fitting). The derived parameters are listed in Table 1; for the two in the D12 sample, the parameters are taken from that paper. They have BH masses and the estimated Eddington ratios around a few percent.
As can be seen from their SDSS spectra in Figure 2, a broad H component is evident in both J00401109 and J1304+3955; a broad H component is also clearly present in J1304+3955, whereas in J00401109 such a component can only be seen after the proper removal of starlight. However, these lines appear to be comparatively narrower and weaker in J0743+4808 and J1126+5134, causing their detection significance not to be high, but merely above the threshold adopted in Dong X.-B. et al. (2012). Furthermore, the presence of a broad H line is elusive in these two objects. To verify the detection of the broad H and possibly the broad H lines, and thus their low-mass AGN nature, we also observed these two objects with MMT to acquire optical spectra with better spatial resolution and S/N.
3. Results of MMT observations
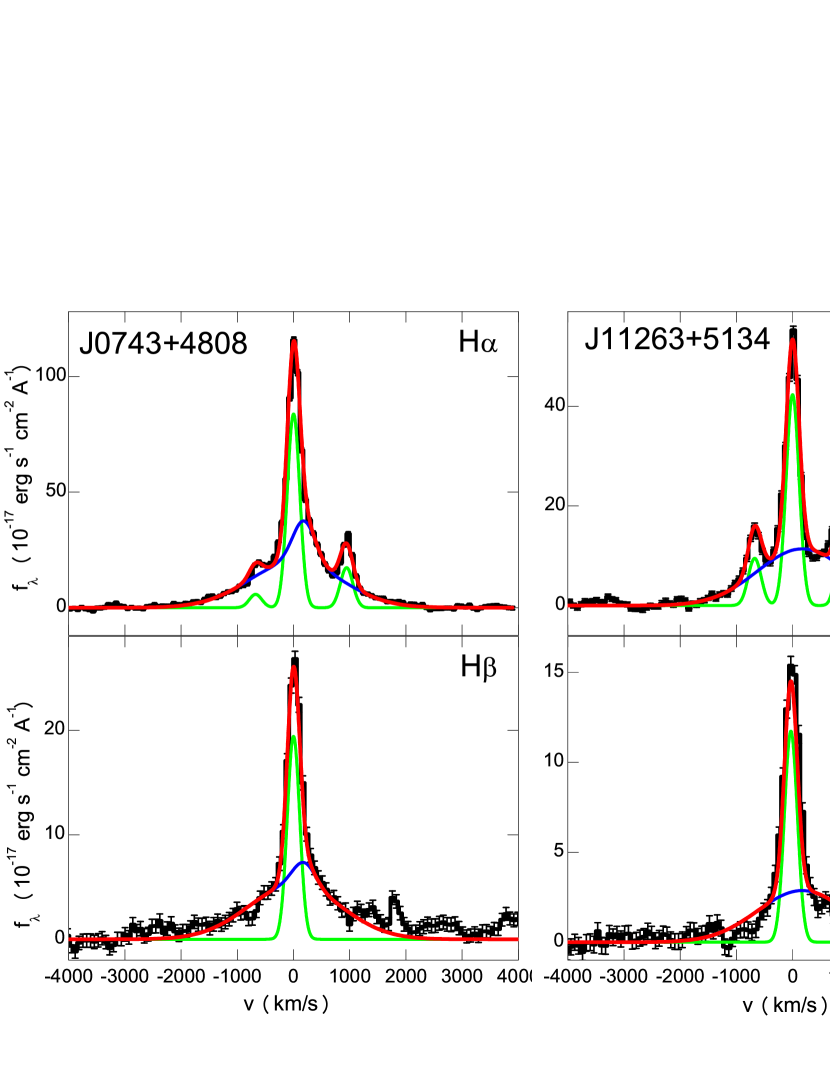
To scrutinize the reliability of the broad lines in J0743+4808 and J1126+5134, we observed them with the blue-channel spectrograph of the 6.5m MMT telescope on 2008 February. We used the setting of 500 l mm-1 gratings blazed at 6000Å, which covers a wavelength range from the H to H lines. A slit width of 1″ was chosen to match the seeing; this is essential for reducing starlight contamination. The total exposure time was 30 minutes for each object (two frames taken, each with a 15 minute duration). The corresponding spectral resolutions are 3.8Å in FWHM, as measured from the comparison lamp lines. A KPNO standard star was observed for flux calibration. The data reductions, including bias subtraction, flat-field correction, and cosmic-ray removal, were accomplished with standard procedures using IRAF. One-dimensional spectra were extracted, and were calibrated using the observed standard star. Since the continua of both objects are dominated by starlight, only the (broad) emission lines can be used as an indicator of the AGN luminosity. To improve the spectrophotometric calibration, we further recalibrate the resulting spectra using the [OIII] emission line against that in the corresponding SDSS spectra555 At a redshift of 0.018 (for J0743+4808; it is even higher for J1126+5134), 1 arcsec corresponds to 360 pc, which is much larger than the expected size of the narrow-line region (NLR). Both the NLR and broad-line region (BLR) can thus be considered as a point source for the ground-based (MMT) observations. On the other hand, the narrow-line intensity ratios are almost the same for the MMT and SDSS spectra, which are typical of Seyfert 2 AGNs; this indicates that the contamination of HII regions in the host galaxy is negligible. Therefore, we could use the SDSS spectra for spectrophotometric calibration, although they were taken within a fiber aperture of 3″, which is larger than the slit width used in our MMT observations. , which are generally well calibrated to an accuracy of %. Galactic extinction is corrected by using the extinction map of Schlegel et al. (1998) and the reddening curve of Fitzpatrick (1999). The redshifts measured from the SDSS spectra are used.
The spectral analysis is performed in the same way as that in D12 (see also Zhou et al. 2006), and is only outlined here. Host galaxy starlight, though with considerably less contribution compared to the SDSS spectra—thanks to the 1″ slit, is carefully modeled and removed using our algorithm described in Lu et al. (2006). The emission lines are de-blended into a narrow and a broad component by fitting multi-Gaussian component models, with the least number of components required (set by a -test). As demonstrated in D12, these procedures work well for modeling the optical spectra of low-mass AGNs. The emission line spectra in the H and H regions of the reduced MMT spectra are shown in Figure 3, along with the best-fit emission line models.
The MMT spectra have much higher S/N than the SDSS spectra. In both objects, broad components of both H and H are clearly detected. The measured line widths, with smaller errors compared to the SDSS values, are generally consistent with the SDSS measurements within typical mutual uncertainties. We derive the BH masses and Eddington ratios using the new MMT measurements of the H line width,666 Note that we use the broad H luminosities of the SDSS spectra in this calculation, in consideration of the light loss due to the small slit aperture used in the MMT observations. as given in Table 1. The new and values are within a factor of compared to those from the SDSS, which are well within the statistical uncertainties of the BH masses estimated from the SDSS data (0.3 dex, see Dong X.-B. et al., 2012). We use the new and values for these two objects in the rest of the paper. To conclude, J0743+4808 and J1126+5134 are confirmed to be type 1 AGNs with a low-mass BH and a relatively low, H-derived Eddington ratio. This suggests that the low-mass AGNs with low found in the D12 sample should largely be reliable.
4. Results of Chandra X-ray observations
4.1. Data Reduction and Source Detection
We performed snapshot observations for the four low-mass BHs with Chandra ACIS-3, each for 5 ks, as a Guest Observer program (observation ID 09233-09236). The observation logs are listed in Table 2. The data analysis is performed using the standard CIAO tools. A level 2 event file is created from the provided level 1 data following the standard procedure. Events with grades of 0, 2, 3, 4 and 6 in the 0.3–8 keV energy range are selected. Source detection is performed using the ”celldetect” task with default parameters. Of the four objects, J0743+4808 and J1304+3955 are significantly detected at the 14 and 10 significance levels, respectively. The X-ray sources coincide with the positions of the galactic nuclei in optical given by the SDSS. We extract their source X-ray counts using a 3″ radius aperture, and the background counts using an annulus of inner and outer radii of 6″ and 9″, respectively. J0743+4808 and J1304+3955 have net source counts of 194 and 94, respectively. The observational logs and source detection results are summarized in Table 2.
For the remaining two objects not detected by the source detection algorithm, X-ray counts are extracted from a 2″ radius aperture centered at the optical positions of the nuclei, yielding 2 counts for J1126+5134 and 2.5 counts for J0040-1109. The expected local background counts within the aperture are estimated by averaging the background in a much larger source-free region around the optical position, yielding 0.16 and 0.27 for J1126+5134 and J0040-1109, respectively. The probability of obtaining the counts as observed or more when the above mean background counts are expected is for J1126+5134 and for J0040-1109, based on Poisson statistics. This may be a hint for the possible existence of an X-ray source, as discussed in Vignali et al. (2001). However, detections at such significance levels are uncertain or marginal at best, and thus we do not consider them as reliable detections.
Here we estimate the upper bound of the X-ray counts (mean expected) from a postulated X-ray source at the optical position within an exposure time , making use of both the observed counts and the estimated mean of the background (). The total mean counts expected are . The Poisson probability of obtaining counts or more when counts are expected is . As a conservative case, we require this probability to be as high as or, equivalently, . For given observed counts , the mean counts can be obtained, which we consider as the upper limit at the confidence level, since for any emission with a mean smaller than only lower counts () could be obtained at the same probability. In this way, we find =5.32 and 6.68 for J1126+5134 () and J0040-1109 (), respectively. Thus, the upper bound of the expected counts of any possible source can be obtained as . Adopting the values derived above, we find for J1126+5134 and for J0040-1109. The upper bounds on the expected count rates are obtained as and for J1126+5134 and J0040-1109, respectively, in 0.3–8 keV.
4.2. X-Ray Spectra and Luminosities
The detected X-ray counts of J0743+4808 and J1304+3955 are just enough for a rough characterization of their X-ray spectral properties. This is very useful for determining the intrinsic X-ray luminosities (and the Eddington ratios) of the objects, which is the main goal of this study. The X-ray spectra of the source and backgrounds are extracted, respectively, from the above regions in the 0.3–8 keV band. The RMF and ARF files are created at the source positions using CIAO. We use XSPEC for spectral fitting. Galactic absorption is always included and the HI column density is fixed in the spectral fit. The uncertainties of the parameters derived from the X-ray data are quoted at the 68% confidence level throughout the paper.
4.2.1 J0743+4808
The spectrum of J0743+4808 is binned to have 25 net source counts in each bin to achieve a S/N, resulting in eight energy bins (Figure 4). The fitting results are given in Table 3. A power-law model with Galactic absorption gives a statistically acceptable fit (=0.21), resulting in a photon index and a 2–10 keV luminosity . The spectrum and the best-fit power-law model are shown in Figure 4 (left-hand panel). Setting the (neutral) absorption column as a free parameter leads to an even flatter spectrum () and, in the worst case, no absorption occurring (cf. the Galactic value ), which is physically unacceptable. Setting to steeper values, such as the typical value for Seyfert 1 galaxies =1.7 (Mushotzky et al., 1993) in 2–10 keV, yields no acceptable fits (reduced =4.1 for =1.7 and fixed at the Galactic value). We thus conclude that the observed X-ray spectrum is apparently flat. Interestingly, a similar flat X-ray spectrum was also observed occasionally in NGC 4395, which resembles J0743+4808 in both and . However, it is well known that an apparently flat X-ray continuum may result from reflection or absorption (ionized and/or partial covering) of an intrinsically steep continuum. Here we also explore these alternative models.
Reflection models, either neutral or ionized (pexrav and pexriv in XSPEC, respectively), yield unacceptable or at most marginally acceptable fits over a range of values (from to 2.0) and, in the worst case, require an unphysically large reflection albedo (). Thus they are not considered to be viable models.
Here we consider the case where the power-law continuum is absorbed and adopt the ionized absorption model zxipcf, that is parameterized by a column density , an ionization parameter 777 Defined as , where is the ionizing luminosity, the ion density and the distance of the absorber to the central ionizing source. and a covering factor . First, when fixing the covering factor to unity, the best fit is achieved with an ionized absorber () and a steeper continuum than above (), resulting in =4.4 for 4 degrees of freedom (dof.), =0.35. The best-fit model is shown in Figure 4 (right-hand panel). Freely fitting the covering factor also leads to . The fitted power-law photon index is somewhat flatter than, but still marginally consistent with (within 90% uncertainty), the typical value for Seyfert galaxies, . Alternatively, we further assume for the intrinsic continuum. Fixing yields an acceptable fit (=0.24), with a moderately ionized absorber of . Fitting as a free parameter improves the fit only marginally (=0.26), and results in and a slightly increased . We also try an absorber model with low ionization by fixing at the lower bound , which gives similar fitting statistics (=0.26) and covering factor, but reduced ; in this case a partial covering absorber is required, as full coverage can be ruled out (=0.01). In summary, the observed spectrum of J0743+4808 can also be reproduced by a steep power-law () subject to absorption with of the order of ; the ionization status is poorly constrained, ranging from ”cold” absorber with a covering factor to ionized gas with a large or full coverage.
All the acceptable models above give similar flux densities and luminosities (corrected for intrinsic absorption) in the 2–10 keV band, which are actually consistent with one another within mutual statistical errors (Table 3). In the analysis below, we take the representative value as the nominal luminosity for the intrinsic absorption model, which is the case for fixing and freely fitting all the absorption parameters; its uncertainty is assigned as either the statistical errors or the systematic luminosity differences among the various models above, whichever is the largest.
4.2.2 J1304+3955
Given the low source counts, we bin the spectrum to have at least 15 counts per energy bin, and adopt the C-statistic in the spectral fitting. A power-law with Galactic absorption yields an excellent fit (C-statistic = 1.5 for six data bins), and a photon index , which is well consistent with the typical values of Seyfert galaxies. We also try the absorption models as in J0743+4808, and find that the fitted absorption is consistent with zero, leading to almost the same fitting results. Thus the X-ray spectrum of J1304+3955 can be described by a simple power-law (with Galactic absorption) with an index typical of normal Seyfert galaxies. The spectrum and the best-fit power-law model are shown in Figure 4. The luminosity in the 2–10 keV band is .
4.2.3 X-Ray Non-detections
For the two undetected objects, upper bounds on their X-ray luminosities are derived using XSPEC as the following. First a spectral model (absorbed by the Galactic ) is assumed with the normalization set to an arbitrary value, and is convolved with the response matrix and effective area (the RMF and ARF files). Then the normalization is determined by matching the predicted count rates in the 0.3–8 keV band to the upper bounds derived from the observations above. Assuming a power-law model with two distinctive photon indices, as found in J1304+3955 (and in typical Seyfert galaxies) and in J0743+4808, we find, for , for J1126+5134 and for J0040-1109 (see Table 4). Note that assuming the alternative intrinsic absorption model found in J0743+4808 yields similar luminosity limits. The X-ray luminosities are constrained to be extremely low, comparable to or even lower than some ULXs.
4.3. X-Ray Variability
For J0743+4808 and J1304+3955 background-subtracted lightcurves in 0.3–8 keV are constructed, using bin sizes of 500 s for all except one of the bins (Figure 5). As can be seen, for both objects, the X-ray count rates appear to be variable within the observational intervals. We test hypothesized constant X-ray counts over time bins of 500 seconds, using the test (Bevington & Robinson, 1992). This yields a null probability =0.9% and =4.6% for J0743+4808 and J1304+3955, respectively, indicating at least marginally significant variability. The proper determination of the variability timescales is limited by the modest count rates and exposure time, however. Here we estimate the timescales as the intervals between the minimum and maximum fluxes which varied by at least a factor of two. This results in about 2000 s or less in both objects. Such timescales are short for AGNs, and are consistent with what has been observed in NGC 4395 and Pox 52 (Moran et al., 2005; Vaughan et al., 2005; Dewangan et al., 2008), and other low-mass AGNs (e.g. Dewangan et al., 2008; Miniutti et al., 2009; Ai et al., 2011).
4.4. Off-nucleus X-Ray Source in J0743+4808
Interestingly, in the galaxy J0743+4808, an off-nucleus X-ray source (denoted as J0743+4808 X-1), is detected at 3.3 significance, with 12 source counts and a count rate of . Its position (RA=07h43m45.7s, Dec=+43d08m17s) is 4.″3 away from the nucleus, corresponding to a projected physical distance of 1.62 kpc (Figure 1). We calculate its luminosity by deriving the count rate to flux conversion factor, assuming a power-law spectrum without intrinsic absorption. Assuming , we obtain a flux density of and a luminosity in 2-10 keV. Clearly, it is a new ULX detected in dwarf galaxies. Assuming that its X-ray emission is not beamed, the observed X-ray luminosity sets a lower limit on the BH mass of 48(70) (if the BH is accreting at a rate not significantly higher than the Eddington rate, as commonly believed). No optical counterpart is found based on the SDSS image.
5. Estimation of Eddington ratios
The ratios of the 2–10 keV luminosities to the Eddington luminosities are calculated (Table 4). They are a few times for the two X-ray detected objects (for J0743+4808, the spectral modelings with or without intrinsic absorption lead to only small differences). For the two non-detections, the upper limits are on the order of , depending on the power-law photon index assumed. To estimate the bolometric luminosities and the Eddington ratios, the hard X-ray to bolometric correction factor needs to be known. The determination of is difficult, requiring simultaneous observations of the nuclear broad-band luminosities of a sample of AGNs. Albeit with large scatters, recent studies suggest that clusters around 10–20 for typical Seyfert galaxies with and mostly in the range (Vasudevan et al. 2009, see also Vasudevan & Fabian 2007, 2009; Ho 2009). For low-mass AGNs, however, there is a lack of estimation, except for the intensively studied prototype NGC 4395, which has a small correction (Moran et al., 2005). As a reasonable assumption, we adopt the X-ray bolometric correction factor to be within the above broad range, i.e. , for low-mass AGNs.
For J1304+3955, the Eddington ratio is estimated to be , somewhat smaller than or at most comparable to the H-based estimation. For J0743+4808, it is ; although its lower end is comparable to the H-based estimation, its upper bound is no longer in the low accretion regime. For the two non-detections, the upper limits on are in the range , depending on and assumed. If this is the case, J1126+5134 and J0040-1109 would be intrinsically extremely weak in X-rays and also highly sub-Eddington, and the upper bounds are comparable to that of NGC 4395 (Peterson et al., 2005, see, however, Nardini & Risaliti (2011) for a different estimate of 0.01).
We note that the Eddington ratios constrained for the two non-detections are at least one order of magnitude lower compared to their values derived from the H line. This discrepancy may be accounted for by a few factors, or a combination of them. First, variability of the radiation in the X-ray or/and H, as often seen in AGNs, can never be ruled out. Second, low-mass AGNs may have different broad-band SEDs and consequently different bolometric corrections from massive Seyfert galaxies, given the (albeit weak) dependence of the temperature of accretion disks on BH mass (see also Section 6.3 in below). Third, the X-ray emission in these two objects may be attenuated by absorbers with a large covering factor.
Here we investigate the effect of X-ray absorption on the derived Eddington ratios. X-ray absorbers are sometimes found in massive Seyfert galaxies, as well as in NGC 4395 (Iwasawa et al., 2010, ionised absorber with ) and potentially in J0743+4808 studied in this work. The column densities of the absorbers are at most on the order of for type 1 Seyfert galaxies (e.g. Mateos et al., 2010). We re-estimate the limits on the ”intrinsic” X-ray luminosities of these two objects by assuming the presence of absorbers with the condition similar to that inferred in J0743+4808 (we adopt the case of a partial covering, ionized an absorber with = ; see Table 3), using the method described in Section 4.2.3. For both objects, this results in upper limits on the Eddington ratio for a covering factor of 0.78 as in J0743+4808, which are similar to the case assuming a flat power-law of . In the extreme case where the covering factor is unity, we find , and its upper bound becomes comparable to those derived from H. We consider these values to be the most conservative limits for both objects.
Thus the Chandra observations confirm the low Eddington ratios in most, if not all, of our objects, which are about a few percent or even lower, for a reasonable range of the X-ray-to-bolometric correction factor. These values are generally compared to, or even smaller than, the estimates from optical using H. The true Eddington ratios may lie somewhere in between the values estimated in these two bands.
6. Discussion
6.1. The Nature of an AGN with a Low-mass Black Hole
The MMT optical spectra of J0743+4808 and J1126+5134 confirm the presence of a broad component in the Balmer lines suggested by the SDSS spectra, with the FWHM measurements consistent with those from the SDSS. These results confirm their type 1 AGN nature and BH mass estimates. The two objects detected in X-ray with Chandra, J0743+4808 and J1304+3955, both show X-ray spectra (see Section 6.2 for discussion) typical of Seyfert galaxies and rapid variability on timescales as short as s. These properties indicate that the observed X-rays must originate from an AGN, rather than dominated by hot gas or integrated emission from a population of stellar-mass X-ray sources in the nuclear region, which might be a concern given the very low X-ray luminosities observed. Their X-ray luminosities, on the order of or even lower, are at the lowest luminosity end of Sefyert galaxies, and actually comparable to bright ULXs. A few Seyfert galaxies in this luminosity regime have been found in the literature (e.g. Thornton et al., 2009), including NGC 4395.
The variability timescales on the order of s are among the shortest observed in radio-quiet AGNs, and comparable to what is observed in NGC 4395 (e.g. Iwasawa et al., 2000, 2010; Moran et al., 2005) and other AGNs with small BH masses (Miniutti et al., 2009; Ai et al., 2011). Specifically, NGC 4395 shows a ”break frequency” at Hz in the X-ray power spectrum density (Vaughan et al., 2005), for a BH mass of (Peterson et al., 2005). These values are comparable to the dynamical timescale —the shortest characteristic timescales associated with accretion flows—at small radii of the accretion disk, where the hot corona producing the hard X-rays is located. We have ) s, where is the Schwarzschild radius (Czerny, 2006); for and an X-ray-emitting region at , s. Such short time-scale variations are indicative of small BH masses ( ) in these objects.
6.2. X-ray Spectral Property
The two Chandra detected objects show distinct X-ray spectral shapes. While J1304+3955 exhibits an unabsorbed power-law with a photon index () typical of Seyfert galaxies, J0743+4808 shows an unusually flat spectrum (). Interestingly, a flat X-ray spectrum was also observed occasionally in NGC 4395, which is similar to J0743+4808 in both and . In fact, its 1–10 keV spectrum is strongly variable from (Shih et al., 2003; Iwasawa et al., 2010) to even (Moran et al., 2005) on timescales of a year or less, which is mainly accounted for by changes in the emission continuum shape with little changes in flux (rather than changes in the warm absorber). If the observed flat spectra are intrinsic, the diverse spectral shapes in these two objects as well as in NGC 4395 indicate that, at the low and regime, the physical conditions of the corona producing X-rays differ largely from one object to another and strongly vary (the former may be a consequence of the latter). Such a result seems not to comply with the claimed – relation888A correlation has been suggested recently between and the Eddington ratio (e.g. Risaliti et al., 2009), that predicts a flatter at lower . However, it is not clear whether this relation holds at the low range studied here, given the sparse sampling and large scatters (see their Figure 2). , or is at least suggestive of a large scatter at the low- end. Spectral fitting of the X-ray data of a few small samples of low-mass AGNs, taken with both XMM-Newton and Chandra, show =1.5–2.7 (Dewangan et al., 2008; Miniutti et al., 2009; Desroches et al., 2009; Ai et al., 2011; Dong R. et al., 2012); however, all those objects are accreting at high rates around Eddington or a substantial fraction of Eddington.
Alternatively, as shown above, the flat spectrum found in J0743+4808 may also be reproduced with a steep power-law undergoing X-ray absorption, either ionized and/or partial covering, on the order of . Partially ionized absorption is not uncommon in Seyfert 1 galaxies, and so is a partially obscuring absorber (termed a partially obscured AGN). The derived absorption parameters are also typical of those observed in type 1 AGNs. For low-mass AGNs, partially ionized absorption has been detected in NGC 4395 (Iwasawa et al., 2000; Shih et al., 2003; Moran et al., 2005) and also possibly in Pox 52 (Dewangan et al., 2008). Future X-ray observations with better S/N will be able to distinguish the two cases—intrinsic flat spectrum or ionized/partial absorption.
6.3. Properties of Low-mass AGNs Accreting at Low Rates
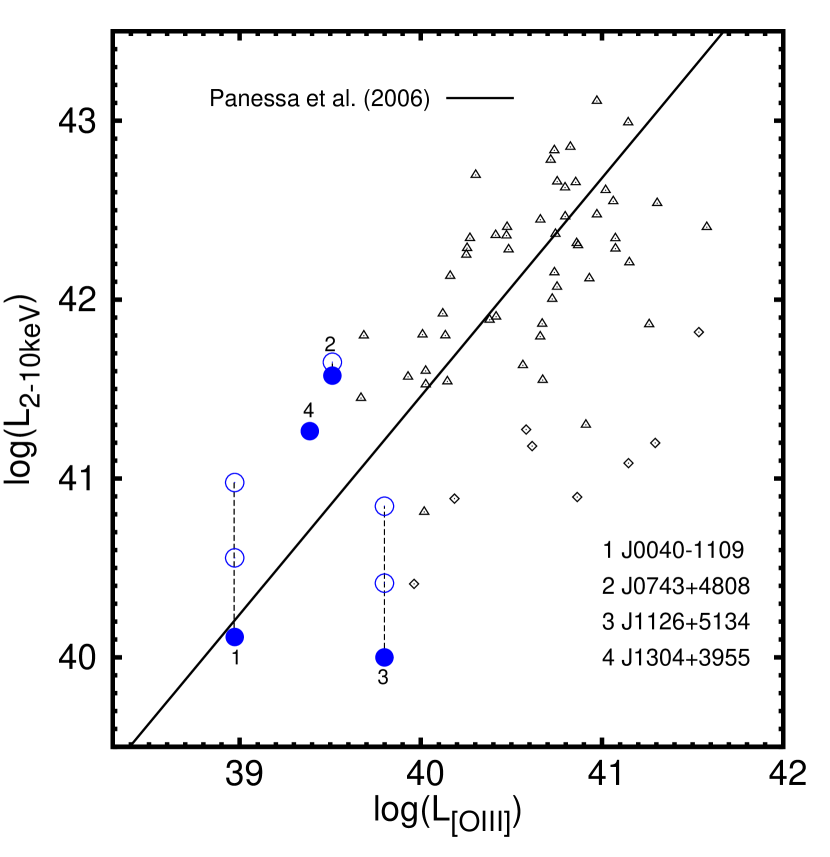
Here the multi-wavelength properties of these under-luminous low-mass AGNs are investigated and compared to other AGN samples. The X-ray and [OIII] line luminosity relation is shown in Figure 6 (left panel); also plotted is the low-mass AGN sample with high Eddington ratios () from Dong R. et al. (2012). For J0040-1109 and J1126+5134, the upper limits on the X-ray luminosities are shown, which correspond to the three cases from the most stringent to the most conservative limits: (i) assuming a power-law spectrum with without intrinsic absorption (filled dots); (ii) corrected for assumed absorption of partial covering as discussed in Section 5 (open circles); (iii) the same as (ii) but assuming fully covering absorber (open circles). As can be seen, our objects are systematically fainter than their high-accretion counterparts, and extend the previously known – relation down to the lowest luminosity regime ever probed for AGNs. The trend is roughly consistent with the extrapolation of the previously known relations for classical AGNs with high BH masses (e.g. Panessa et al., 2006), albeit with large scatters. The scatter may be contributed from a few sources: for instance, X-ray variability, as seen from this work and other observations of low-mass AGNs (Vaughan et al., 2005; Dewangan et al., 2008; Miniutti et al., 2009; Ai et al., 2011); or possible absorption of the X-ray emission in some objects. For J1126+5134, its X-ray weakness may be at least partly ascribed to absorption, as its deviation from the – relation gets smaller once the luminosity limit is corrected for absorption (with on the order of ). On the contrary, little or no X-ray absorption is inferred in J0040-1109, suggestive of an extremely low intrinsic X-ray luminosity that is comparable or even lower than that of NGC 4359—the least luminous dwarf AGN known so far.
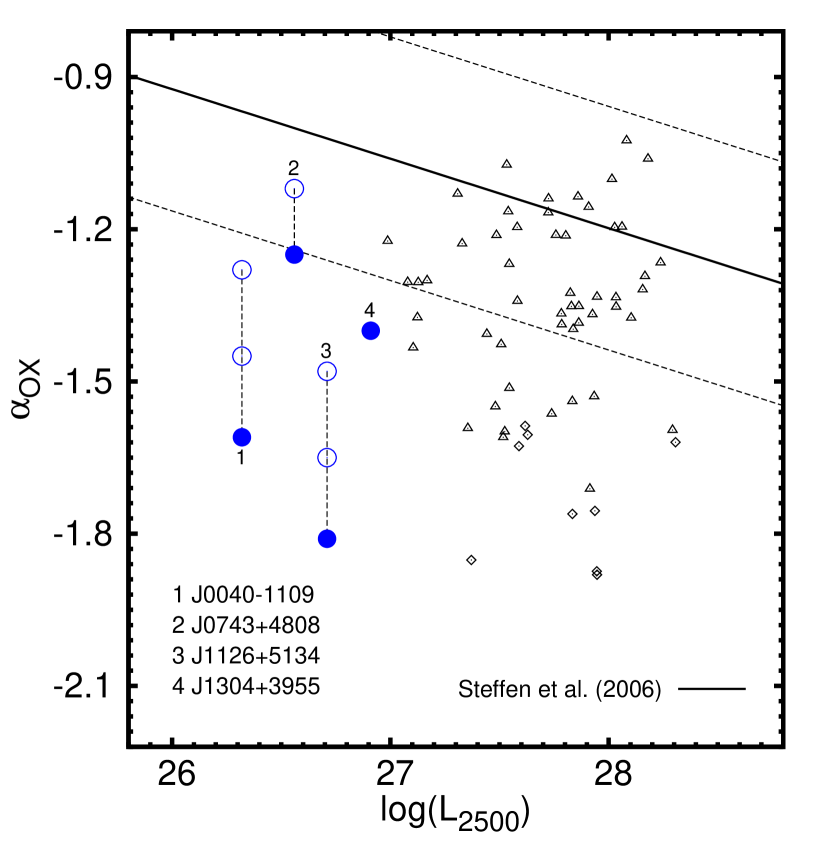
The optical/UV (Å) to X-ray (2 keV) effective spectral indices are calculated (Table 4), which is defined as the two-point effective spectral index between Å and 2 keV999 . The luminosity is calculated from the Å luminosity which is estimated from the broad H line assuming an optical spectral index (). For the X-ray non-detections the lower limits are calculated from the nominal X-ray luminosity limits. Their values are plotted versus the Å luminosities in Figure 6 (right panel). For J0040-1109 and J1126+5134, we adopt the limits corresponding to the X-ray luminosity limits shown in the left panel of the figure, i.e. considering the cases of X-ray absorption (see above). It shows that our objects are comparable to the luminous low-mass AGN sample of Dong R. et al. (2012) in the distribution, which has a large scatter. It also shows that our objects, being one order of magnitude fainter in than the Dong R. et al. (2012) sample, do not follow the extrapolation of the previously found – relation, such as that in Stefen et al. (2006) (see Yuan et al. 1998 for a different view, however). In particular, the two non-detections appear to be ‘X-ray weak’, with respect to their optical/UV emission. This is possibly true for J0040-1109, which requires little or no X-ray absorption, whereas X-ray absorption might play a role in J1126+5134, however, as argued above based on their luminosities.
The deviation from the empirical - relation at low is not surprising, as theoretically should directly depend on both and accretion rates, rather than . It should be noted that this deviation would be aggravated if the optical light suffers from dust extinction, though we do not consider it to be significant. The steep values are not unexpected at low Eddington ratios in accretion disk emission models (e.g. Done et al., 2012), despite the somewhat ad hoc modeling of the X-ray emission. This is simply a consequence of that the peak of the multi-temperature blackbody spectrum of the accretion disk is shifted toward low energies with decreasing accretion rates. (see Figure 6 of Dong R. et al. 2012 for discussion on these dependences). Furthermore, variability may also play a role, as the X-ray and optical observations were not simultaneous. In addition to the expected large amplitude X-ray variability for their small BH masses, recent observations show that, statistically, long-term optical variability is increasing with a decrease of the Eddington ratios in AGNs (Ai et al., 2010).
6.4. A Large Population of Low-mass BH in the Local Universe?
The Eddington ratios of our objects are close to the critical accretion rate in Galactic BH X-ray binaries, typically around 2%–3% of the Eddington accretion rate, below which a standard thin disc is truncated with its inner region replaced by an advection dominated accretion flow (Narayan & Yi, 1994). Theoretical studies show that this process is also applicable in AGNs (Liu & Meyer-Hofmeister, 2001). AGNs with lower Eddington ratios than the critical rate might undergo such an inner disk truncation. This would result in a reduced UV continuum and hence weaker emission lines, making their line spectra even less prominent against the contamination of host galaxy starlight and, hence, difficult to detect. Moreover, absorption/obscuration would make the objects dimmer in the X-ray and/or optical bands. It has been suggested that the fraction of obscured AGNs increases significantly with decreasing X-ray luminosity (e.g. Burlon et al., 2011). If this trend holds for low-mass AGNs, obscuration must be very common in such objects, especially in objects with low . In fact, as discussed above, obscuration of the X-ray emission may be inferred in at least one of our objects. A combination of these effects would further aggravate the elusion of low-mass AGNs from detection in optical (and also X-ray) surveys.
The intrinsic Eddington ratio distribution function (ERDF) for local active BHs () in the mass range of was derived by Schulze & Wisotzki (2010), based on a well-defined sample and taking selection biases into account. The ERDF can be described by a Schechter function and exhibits a monotonic rise toward the lower end down to . Assuming that the same ERDF holds for low-mass AGNs, we try to estimate the ”intrinsic” number of low-mass AGNs at the lower end from the detected objects at the higher end; the latter are comparatively much brighter and can thus be considered to be more or less complete (volume limited with ). For the high- end we choose () () as a reasonable value, and there are 40 such objects in the D12 sample. We find that, by integrating the ERDF, objects with () make up only 0.06% of all the objects with (). This predicts a total of at least low-mass AGNs with (), a factor of about 200 more than what have actually been detected from SDSS. This number would be even larger when extending to below . It should be noted that only type 1 AGNs are considered in the above estimation. The number ratio of type 2 to type 1 AGNs is not known in this regime. For more massive Seyfert galaxies, the ratio shows an increase toward low X-ray luminosities and reaches or even higher at the lowest luminosity (e.g. Burlon et al., 2011). If this ratio is not largely different from that for massive Seyfert galaxies, the expected number of low-mass AGNs would be even larger by a factor of four or more. We thus conclude that, unless their intrinsic ERDF exhibits a significant drop below , a large population of low-mass BHs or IMBHs with probably exists in the local universe.
7. Summary and implications
We performed X-ray observations with Chandra of four low-mass AGN candidates ( ) selected from the SDSS, aiming at validating them as AGNs and having low Eddington ratios that were inferred based on broad H. In addition, for two objects (J0743+4808 and J1126+5134) having the lowest significance of broad H, optical spectroscopic observations with MMT were performed at better spatial resolution, which confirm them as Seyfert 1 galaxies and low . Of the four dwarf galaxies, X-ray emission from the nuclei of two (J0743+4808 and J1304+3955) is detected, which varies on timescales as short as s, indicating an AGN origin in both. For the remaining two, the detection is not significant, or only marginal at best. These results imply that the vast majority, if not all, of the objects in the D12 sample are low-mass Seyfert 1 galaxies, which were selected purely based on their broad H lines. Serendipitously, an off-nucleus ULX in the dwarf galaxy J0743+4808 is detected, with a 2–10 keV luminosity of assuming typical spectral indices for ULXs, which may imply a BH with a mass of at least 50–70 if it is accreting at the Eddington rate and radiating isotropically.
The X-ray luminosities of the sample objects are found to range from below to a few times in 2–10 keV. This luminosity regime is among the lowest ever probed for an AGN, and is actually comparable to bright ULXs. Extending to such extremely low luminosities, our data are still broadly consistent with the known – relation, but seem to deviate from the previous – relation. The two detected objects show diverse X-ray spectral shapes, with a power-law photon index = in J1304+3955 and an apparently unusually flat = in J0743+4808 (68% confidence level). The Eddington ratios range from to , for a range of reasonable X-ray-to-bolometric luminosity corrections and spectral models. Thus their low Eddington ratios are confirmed. This implies that the detection of the low-, low-mass AGNs in the D12 sample should mostly be reliable.
The low- objects found in the D12 sample are already at the detection limit of the SDSS data for a low-mass AGN by means of the broad emission line method as employed therein. Low-mass AGNs in dwarf galaxies with even lower , or at larger distances, or residing in brighter nuclear star clusters would have most likely been missed in the SDSS survey, as generally expected. Therefore, there likely exist a possibly large population of black holes with or even less in the local universe. Future sky surveys at multi-wavelengths, such as eROSITA in X-ray, will reveal more objects of this population.
References
- Ai et al. (2011) Ai, Y.L., Yuan, W., Zhou, H.Y., Wang, T.G., Zhang, S.H. 2011, ApJ, 727, 31
- Ai et al. (2010) Ai, Y.L., Yuan, W., Zhou, H.Y., Wang, T.G., Dong, X.-B., et al. 2010, ApJ, 716, L31
- Barth et al. (2004) Barth, A. J., Ho, L. C., Rutledge, R. E., & Sargent, W. L. W. 2004, ApJ, 607, 90
- Bevington & Robinson (1992) Bevington, P.R. & Robinson, D.K. 1992, Data reduction and error analysis for the physical sciences, 2nd ed. (WCB/McGraw-Hill)
- Burlon et al. (2011) Burlon, D., Ajello, M., Greiner, J., Comastri, A., Merloni, A., Gehrels, N. 2011, ApJ, 728, 58
- Czerny (2006) Czerny, B. 2006, in ASP Conference Series, 360 AGN Variability from X-Rays to Radio Waves, ed. C. M. Gaskell et al. (San Francisco, CA:ASP), 265
- Desroches et al. (2009) Desroches, L.-B., Greene, J. E., & Ho, L. C. 2009, ApJ, 698, 1515
- Desroches & Ho (2009) Desroches, L.-B. & Ho, L.C. 2009, ApJ, 690, 267
- Dewangan et al. (2008) Dewangan, G.C., Mathur, S., Griffiths, R.E., Rao, A.R. 2008, ApJ, 689, 762
- Done et al. (2012) Done, C., Davis, S.W., Jin, C., Blaes, O., & Ward, M. 2012, MNRAS, 420, 1848
- Dong R. et al. (2012) Dong, R., Greene, J.E. & Ho, L.C. 2012, ApJ, 761, 73
- Dong X.-B. et al. (2012) Dong, X.-B., Ho, L.C., Yuan, W., Wang, T.-G., Fan, X., Zhou, H., Jiang, N. 2012, ApJ, 755, 167
- Dong X.-B. et al. (2007) Dong, X.-B., Wang, T.-G., Yuan W., et al. 2007, ApJ, 657, 700
- Filippenko & Ho (2003) Filippenko, A. V., & Ho, L. C. 2003, ApJ, 588, L13
- Filippenko et al. (1993) Filippenko, A. V., Ho, L. C. & Sargent, W. L. W. 1993, ApJ, 410, L75
- Fitzpatrick (1999) Fitzpatrick, E. L. 1999, PASP, 111, 63
- Greene & Ho (2004) Greene, J. E., & Ho, L. C. 2004, ApJ, 610, 722
- Greene & Ho (2005) Greene, J. E. & Ho, L. C. 2005, ApJ, 630, 122
- Greene & Ho (2007a) Greene, J. E. & Ho, L. C. 2007a, ApJ, 656, 84
- Greene & Ho (2007b) Greene, J. E. & Ho, L. C. 2007b, ApJ, 670, 92
- Haehnelt et al. (1998) Haehnelt, M. G., Natarajan, P. & Rees, M. J. 1998, MNRAS, 300, 817
- Ho (2009) Ho, L.C. 2009, ApJ, 699, 626
- Iwasawa et al. (2000) Iwasawa, K., Fabian, A.C., Almanini, O., et al. 2000, MNRAS, 318, 879
- Iwasawa et al. (2010) Iwasawa, K., Tanaka, Y., Gallo, L.C. 2010, A&A, 514, 58
- Lira et al. (1999) Lira, P., Lawrence, A., O Brien, P., et al. 1999, MNRAS, 305, 109
- Liu & Meyer-Hofmeister (2001) Liu, B.F. & Meyer-Hofmeister, E. 2001, A&A, 372, 386
- Lu et al. (2006) Lu, H., Zhou, H., Wang, J., Wang, T., Dong, X., Zhuang, Z., & Li, C. 2006, AJ, 131, 790
- Mateos et al. (2010) Mateos, S., Carrera, F.J., Page, M.J., Watson, M.G., Corral, A., et al. 2010, A&A, 510, 35
- Miniutti et al. (2009) Miniutti, G., Ponti, G., Greene, J. E., Ho, L. C., Fabian, A. C., & Iwasawa, K., 2009, MNRAS, 394, 443
- McLure & Dunlop (2004) McLure, R. J. & Dunlop, J. S. 2004, MNRAS, 352, 1390
- Moran et al. (2005) Moran, E.C., et al. 2005, AJ, 129, 2108
- Mushotzky et al. (1993) Mushotzky, R.F., Done, C., Pounds, K.A. 1993, ARA&A, 31, 717
- Narayan & Yi (1994) Narayan, R. & Yi, I. 1994, ApJ, 428, L13
- Nardini & Risaliti (2011) Nardini, E. & Risaliti, G. 2011 MNRAS, 417, 2571
- Panessa et al. (2006) Panessa, F., Bassani, L., Cappi, M., et al. 2006, A&A, 455, 173
- Peterson et al. (2005) Peterson, B.M., et al. 2005, ApJ, 632, 799
- Risaliti et al. (2009) Risaliti, G., Young, M., & Elvis, M. 2009, ApJ, 700, 6
- Satyapal et al. (2008) Satyapal, S., Vega, D., Dudik, R. P., Abel, N. P., & Heckman, T. 2008, ApJ, 677, 926
- Schlegel et al. (1998) Schlegel, D. J., Finkbeiner, D. P. & Davis, M. 1998, ApJ, 500, 525
- Schulze & Wisotzki (2010) Schulze, A. & Wisotzki, L. 2010 A&A, 516, 87
- Shih et al. (2003) Shih, D.C., Iwasawa, K. & Fabian, A.C. 2003, MNRAS, 341, 973
- Singh et al. (2011) Singh, V., Shastri1, P. & Risaliti, G. et al. 2011 A&A, 533, 128
- Stefen et al. (2006) Steffen, A.T., Strateva, I., Brandt, W.N., et al. 2006, AJ, 131, 2826
- Thornton et al. (2009) Thornton, C.E., Barth, A.J., Ho, L.C., Greene, J.E. 2009, ApJ, 705, 1196
- Vasudevan & Fabian (2007) Vasudevan, R.V. & Fabian, A.C. 2007, MNRAS, 381, 1235
- Vasudevan & Fabian (2009) Vasudevan, R.V. & Fabian, A.C. 2009, MNRAS, 392, 1124
- Vasudevan et al. (2009) Vasudevan, R.V., Mushotzky, R.F., Winter, L.M. & Fabian, A.C. 2009, MNRAS, 399, 1553
- Vaughan et al. (2005) Vaughan, S., Iwasawa, K, Fabian, A.C., Hayashida, K. 2005, MNRAS 356, 524
- Vignali et al. (2001) Vignali, C., Brandt, W. N., Fan, X., Gunn, J. E., Kaspi, S., et al. 2001, AJ, 122, 2143
- Volonteri et al. (2008) Volonteri, M., Lodato, G., & Natarajan, P. 2008, MNRAS, 383, 1079
- Yuan et al. (1998) Yuan, W., Siebert, J., Brinkmann, W. 1998, A&A, 334, 498
- Zhou et al. (2006) Zhou, H., Wang, T.-G., Yuan, W., Lu, H., Dong, X.-B., Wang, J., & Lu, Y. 2006, ApJS, 166, 128
| SDSS name | redshift | FWHM(H) | L(H) | |||
|---|---|---|---|---|---|---|
| mag | ||||||
| (1) | (2) | (3) | (4) | (5) | (6) | (7) |
| J004042.10110957.6 | 0.027 | 2240 | 3.4 | 1.22 | 1.0 | |
| J074345.47+480813.5 | 0.018 | 1287(1450) | 6.5 | 0.51(0.66) | 4.3(3.3) | |
| J112637.74+513423.0 | 0.026 | 1481(1875) | 9.7 | 0.83(1.35) | 3.7(2.3) | |
| J130456.95+395529.7 | 0.027 | 1413 | 16.5 | 0.95 | 5.2 |
Note. — Values given in brackets are measurements from the MMT observations. Col. (1): SDSS names; Col. (2): redshift; Col. (3): linewidth of the broad H component; Col. (4): luminosity of the broad H line; Col. (5): black hole mass; Col. (6): Eddington ratio; Col. (7): -band absolute magnitude of host galaxy
| short name | obs-ID | date | cts | CR | ||
|---|---|---|---|---|---|---|
| sec | ||||||
| (1) | (2) | (3) | (4) | (5) | (6) | (7) |
| J00401109 | 09235 | 2007-12-27 | 2.37 | 4686 | ||
| J0743+4808 | 09233 | 2007-12-14 | 5.40 | 4675 | 194 | 41.5 |
| J0743+4808 X-1 | 09233 | 2007-12-14 | 5.40 | 4675 | 12 | 2.3 |
| J1126+5134 | 09234 | 2008-03-26 | 1.18 | 4667 | ||
| J1304+3955 | 09236 | 2008-04-05 | 1.46 | 4699 | 94 | 20.0 |
Note. — Col. (1): object names; J0743+4808 X-1 denotes the off-nucleus X-ray source in J0743+4808; Col. (2): Chandra observation ID; Col. (3): observational date; Col. (4): Galactic HI column density; Col. (5): exposure time; Col. (6): source counts in 0.3–8 keV (upper limits are at the 90% confidence level); Col. (7): count rate in 0.3–8 keV.
| wabs * model | /d.o.f. | ||||||
|---|---|---|---|---|---|---|---|
| (1) | (2) | (3) | (4) | (5) | (6) | (7) | (8) |
| power-law | – | – | – | 8.4/6 | 0.21 | ||
| power-law | 1.7 (fixed) | – | – | – | – | 29/7 | |
| PL*zxipcf | 1 (fixed) | 4.4/4 | 0.35 | ||||
| PL*zxipcf | 1.7 (fixed) | 1 (fixed) | 6.8/5 | 0.23 | |||
| PL*zxipcf | 1.7 (fixed) | 5.3/4 | 0.26 | ||||
| PL*zxipcf | 1.7 (fixed) | -3 (fixed) | 6.5/5 | 0.26 |
Note. — Col.(1) XSPEC models; wabs: absorption with column density fixed at the Galactic value; PL: power-law; zxipcf: partial covering photoionized absorption based on XSTAR; (2) photon index of power-law spectrum (); (3) flux density (2–10 keV) in the observer’s frame corrected for Galactic and intrinsic (if any) absorption; (4) intrinsic absorption column density; (5) ionization parameter; (6) covering fraction; (7) and degree of freedom of the fits; (8) corresponding null probability for the .
| name | |||
|---|---|---|---|
| (1) | (2) | (3) | (4) |
| J00401109 | -1.61(-1.48) | ||
| J0743+4808 | -1.25(-1.12) | ||
| J1126+5134 | -1.81(-1.68) | ||
| J1304+3955 | -1.40 |
Note. — Col.(1): object names; (2): 2–10 keV luminosity (corrected for absorption, if any); (3): ratio of 2–10 keV luminosity to the Eddington luminosity; (4): optical to X-ray effective spectral index. For J0743+4808, the values preceding brackets are for the case of a power-law model, and those in brackets correspond to the case corrected for the intrinsic absorption (model No. 5 in Table 3). In the cases of J00401109 and J1126+5134 (X-ray non-detections), the values preceding brackets are for the case of an assumed power-law model with the photon index , and those in brackets are for .