The impact of a young radio galaxy: clues from the cosmic-ray electron population
Abstract
In the framework of hierarchical structure formation AGN feedback shapes the galaxy luminosity function. Low luminosity, galaxy-scale double radio sources are ideal targets to investigate the interplay between AGN feedback and star formation. We use VLA and BIMA observations to study the radio continuum emission of NGC 3801 between and . We find a prominent spectral break at 10 GHz, where the spectrum steepens as expected from cosmic-ray electron (CRe) ageing. Using the equipartition magnetic field and fitting JP models locally we create a spatially resolved map of the spectral age of the CRe population. The spectral age of agrees within a factor of two with the dynamical age of the expanding X-ray emitting shells. The spectral age varies only little across the lobes, requiring an effective mixing process of the CRe such as a convective backflow of magnetized plasma. The jet termination points have a slightly younger CRe spectral age, hinting at in-situ CRe re-acceleration. Our findings support the scenario where the supersonically expanding radio lobes heat the ISM of NGC 3801 via shock waves, and, as their energy is comparable to the energy of the ISM, are clearly able to influence the galaxy’s further evolution.
keywords:
cosmic rays – galaxies: individual: NGC 3801 – galaxies: quasars: general – galaxies: jets – radiation mechanisms: non-thermal – radio continuum: galaxies1 Introduction
In the framework of the CDM Universe hierarchical structure formation feedback, either by star formation or processes connected to active galactic nuclei (AGN), shape the observed galaxy population in today’s Universe (e.g., Croton et al., 2006). Powerful FR I and FR II radio galaxies are well studied but relatively rare; the energy input from lower luminosity jets may be as important for galaxy evolution, but it is much less well understood. Low-luminosity, galaxy-scale double radio sources on scales of 1–10 kpc are found in a number of elliptical galaxies, where they either resemble young, twin-jet FR I sources (e.g., NGC 1052, NGC 3801, Kadler et al., 2004; Croston et al., 2007) or in Seyfert and spiral galaxies where they typically show twin bubble/lobe features without obvious jets (NGC 6764, Markarian 6, Croston et al., 2008b; Mingo et al., 2011). In both cases the jet-driven radio outflows can inject large amounts of energy into their environments, and may represent an important galaxy feedback mechanism (Croston et al., 2008a).
Shock heating by the radio lobes is a very efficient way of transferring energy from the AGN to the surrounding galaxy environment . The best studied example is Centaurus A, a low-power FR I source, where shocks surrounding the inner radio lobes heat the gas and accelerate cosmic rays to high energies (Kraft et al., 2003; Croston et al., 2009). Deep observations show the X-ray emitting gas to be concentrated in shells that are upstream of the radio lobes, constraining the jump conditions in the interstellar medium (ISM). The energy content of the radio lobes is a few times , comparable to the estimated thermal energy of the host galaxy’s ISM. This can be seen when one multiplies the energy density of the ISM, (Croston et al., 2007), with the volume within 11 kpc radius assuming a vertical height of 100 pc on both sides of the galactic midplane, which results in a thermal energy of . A number of additional galaxies with supersonically expanding lobes have been found including NGC 3801 (Croston et al., 2007), Markarian 6 (Mingo et al., 2011) and the Circinus galaxy (Mingo et al., 2012). The lobes of large FR I radio galaxies are not thought to be over-pressurized, but the majority of sources are likely to pass through a stage of evolution in which the lobes inflate supersonically and can hence drive shocks into their environment (e.g., Heinz et al., 1998).
For understanding the dynamics and evolution of radio galaxies, it is important to establish the particle content in FR I jets and lobes. For the powerful FR II lobes, the synchrotron minimum-energy estimates are roughly in equipartition with the external pressure measurements (e.g., Hardcastle et al., 2002; Belsole et al., 2004; Croston et al., 2004). This finding is corroborated by inverse Compton (IC) X-ray emission, which indicates that the electron energy density in FR II lobes are almost in equipartition with the magnetic field energy density in the absence of an energetically important proton population (e.g., Croston et al., 2005; Kataoka & Stawarz, 2005). On the other hand, it has been known for a long time that in lower-power (FR I) radio galaxies the cosmic-ray electrons (CRe) as derived from energy equipartition can not provide enough pressure to balance that of the external medium (e.g., Morganti et al., 1988; Hardcastle et al., 1998; Worrall & Birkinshaw, 2000). Electrons can not be responsible for the missing energy as they would be detected in X-ray emission via IC radiation which is not observed (Croston et al., 2003). Hot, thermal gas with a temperature similar to that of the external medium would also be detectable in X-ray emission. Croston et al. (2008a) showed that entrainment likely plays an important role, with protons contributing the missing pressure: so-called ‘bridged’ FR I radio galaxies, where the jet has only a small contact area with the environment, have pressures much closer to the equipartition value than ‘plumed’ FR I sources, where the jet seemingly interacts with the ISM. A detailed study of the particle content in the plumed FR I source 3C 31 further supports this scenario (Croston & Hardcastle, 2014).
Radio continuum (RC) observations are a good way to establish the content of the relativistic cosmic rays and magnetic fields. This is particularly the case if one has a wide range of frequencies available to quantify the spectrum of the RC emission which can be used in conjunction with electron ageing models (e.g., Alexander & Leahy, 1987). Single-burst injection models (e.g., Jaffe & Perola, 1973) have been shown to provide good fits to the spectral behaviour of lobes in large radio galaxies (e.g., Alexander, 1987; Carilli et al., 1991; Liu et al., 1992; Hardcastle & Looney, 2008; Harwood et al., 2013). They predict a characteristic break frequency in the synchrotron spectrum of the aged plasma, which is related to the magnetic field strength and the time since the population was accelerated. The spectral age estimate can be compared with the dynamical time-scales derived from the X-ray emission and the lobe expansion velocity and lets us investigate the history of the particle acceleration in the lobes. This is crucial for determining the energy released in shocks throughout the life of the source. In addition, this technique provides us with information about the spatial distribution of the CRe age, something that can be used to locate the areas where the young plasma is injected into the lobes (Harwood et al., 2013). There is some discussion as to the extent to which spectral ages are reliable, because in some radio galaxies the spectral and dynamical age as obtained from the source expansion history are discrepant (e.g., Rudnick et al., 1994; Eilek & Arendt, 1996; Blundell & Rawlings, 2000; Hardcastle & Croston, 2005; Goodger et al., 2008; Harwood et al., 2013). However, for young radio galaxies like NGC 3801 with a dynamical age much smaller than , spectral ages have been suggested to be much more accurate (Blundell & Rawlings, 2000).
In this paper, we present new RC observations of the low-power FR I object NGC 3801. The radio lobes in this galaxy are small () and buried within the ISM of the S0/a host galaxy, which shows a disturbed morphology. It has two prominent dust lanes, one along the minor axis and another roughly perpendicular extending from the centre to the eastern edge (Heckman et al., 1986). The S-shaped radio lobes are surrounded by hot X-ray emitting gas shells detected by Chandra observations from which Croston et al. (2007) derived an expansion velocity of . Das et al. (2005), using the BIMA millimetre-wave array, found a ring of cool molecular gas with a radius of 2 kpc, aligned with the minor axis, traced by line emission around the galaxy’s nucleus. Atomic hydrogen H I emission imaging studies by Hota et al. (2009) and subsequently by Emonts et al. (2012) have shown the presence of a possible gas disc of 30 kpc size and rotating around the host galaxy. The detection of several compact sources in far-ultraviolet (FUV) radiation using GALEX observations shows star-formation activity in the last few 100 Myr, suggesting that NGC 3801 could be a transition object where the increased star formation following a gaseous merger is about to be quenched by the expanding radio lobes that disturb the ISM (Hota et al., 2012).
Throughout this paper, we adopt a cosmology with , , and . We adopt a luminosity distance for NGC 3801 of , obtained by correcting the heliocentric velocity of (Lu et al., 1993) to the CMB frame of reference, which gives an angular scale of . Other properties of NGC 3801 are listed in Table 1.
2 Observations and data reduction
2.1 VLA observations
Observations with the Karl G. Jansky Very Large Array (VLA)111The
National Radio Astronomy Observatory (NRAO) is a facility of the National
Science Foundation operated under cooperative agreement by Associated
Universities, Inc. were taken in March and May 2010 in the ‘open shared
risk observing’ (OSRO) time. We used a bandwidth of 128 MHz with 64 channels
of 2 MHz bandwidth at each observing frequency in -band ( and
) and -band ( and ). The sub-band
frequencies in -band and -band were both observed simultaneously. We
observed a flux calibrator, 3C 286, once during each observing session, and a
phase calibrator every 5–10 min. For the data reduction we used the
Common Astronomy Software Applications package (CASA)222Available at http://casa.nrao.edu. The necessary steps are laid out in the continuum tutorial of 3C 391 observations on the CASA homepage333http://casaguides.nrao.edu/index.php?title=...
...EVLA_Continuum_Tutorial_3C391, which we summarize in the following.
We used a model of 3C 286, because the calibrator becomes partially resolved at our high resolution, and calibrated the flux scale using the ‘Perley–Taylor–99’ calibration scale (Perley & Butler, 2013). Our -band observations suffered from a failure to successfully observe the flux calibrator, 3C 286. This led us carry out some additional steps for the data reduction as described below. Continuum VLA observations are essentially now in spectral line mode, so that the bandpass has to be determined first, again using 3C 286. Phase and amplitude solutions were found by calibrating the secondary (phase) calibrator J1215+1654 and the flux scale bootstrapped from 3C 286. The time interpolated solutions were copied to our source NGC 3801.
| Bandwidth | Array | Resolution | Time on | Noise | Dynamic | Date | Code | References | |
| source | range | ||||||||
| 100 | AB | 1.50.5 h | 1000 | Feb. 2006 | AC805 | Croston et al. (2007) | |||
| 100 | BC | 1.00.5 h | 440 | Jun. 2006 | AC805 | Croston et al. (2007) | |||
| 100 | A | 0.8 h | 180 | Feb. 2006 | AC805 | this paper | |||
| 128 | D | 1.5 h | 240 | Mar. 2010 | AC980 | this paper | |||
| 128 | D | 1.5 h | 250 | Mar. 2010 | AC980 | this paper | |||
| 128 | D | 2.8 h | 140 | May 2010 | AC980 | this paper | |||
| 128 | D | 2.8 h | 160 | May 2010 | AC980 | this paper | |||
| Notes. The observations at and were made with the VLA prior to the correlator upgrade. They were also combined with pre-existing | |||||||||
| archive data (AB920). The GHz data in A-configuration were merged with those from the B- and C-configuration. | |||||||||
We checked our data for radio-frequency interference (RFI) prior to imaging. About of our -band data needed flagging, either due to RFI or because of weak antenna response resulting in high antenna noise after calibration, reducing the effective bandwidth to 100 MHz. The theoretical noise level in -band with on-source time are 35 and for and , respectively. Our achieved noise levels are 42 and respectively, only 10–20 per cent higher than theoretically expected. In -band we needed to flag 50 and 30 per cent of the data at and , respectively. This high fraction of data that needed to be flagged is likely due to a calibration difficulty, which we will discuss below. This reduces the effective bandwidth to 60 and 90 MHz resulting in theoretical noise levels of 37 and , respectively, with on-source observing time. Our achieved noise levels of 63 and , respectively, are 60–70 per cent above the theoretical expectation. This can be explained by a generally poor data quality, which was obvious by inspecting the (u,v)-data visually in CASA. We notice that the bandwidth of the observations is relatively small, so that the (u,v)-coverage is not very much affected by reducing the effective bandwidth.
We self-calibrated the -band data in each channel determining new phase and amplitude solutions using the task BANDPASS three times, improving the r.m.s. noise level of our maps. In -band (at only) we self-calibrated our data in phase only taking all channels together using the task GAINCAL. For the imaging we used a multi-frequency multi-scale (MS–MFS) CLEAN algorithm as described by Rau & Cornwell (2011). As our available relative bandwidth was fairly small, it was not necessary to use the spectral index fitting that this variety of the CLEAN algorithm can handle.
In order to establish an approximate flux scale for our -band observations, we calibrated -band data taken by other observing projects around our observing date of 2010 May 13. We used the averaged flux scale from May 12 and 14 (both AS1013) to bootstrap the flux density of our secondary calibrator J1215+1654 as at . In -band the flux density of this calibrator is known to be changing significantly on consecutive days, so we calibrated our data with 3C 286 observations on several days. The observed flux density of our secondary calibrator was ranging from to , with the exception of May 11 where it was . Disregarding the outlier on May 11, the flux density scale variation is which we thus adopt as the systematic error of our flux density measurements at -band. We applied the flux scale as measured at also to the observations at , correcting for the radio spectral index of 3C 286, because at the latter frequency the data was strongly affected by weak antenna gains, which resulted in a high flagging fraction of . Thus, we presume that the observations at provide us with a more reliable flux scale. The bandpass was determined from 3C 286 observations on May 12 where we used their spectral window ‘SPW=0’ to calibrate our ‘SPW=0’ and vice versa with ‘SPW=1’. This provided the best possible solution for the bandpass as checks of calibrated phases and amplitudes of our phase calibrator indicated.
Of course, we are aware of the limitations that our flux density scale approximation has, but as we will see below, the RC spectra we obtain show that our flux density measurements in -band are broadly consistent with those we obtained from -band, which were unaffected by the missing 3C 286 observations. We will discuss this point in Section 4.1 in more detail, where we will investigate the spectral behaviour of our RC data.
2.2 VLA archive observations
Observations with the VLA prior to the correlator upgrade were taken in 2006 in - () and -band () and published by Croston et al. (2007). The -band data were taken in A- and B-configuration, so that the resolution was matched with the -band data taken in B- and C-configuration. For both bands the observations were taken in continuum mode with two intermediate frequencies (IFs) with 50 MHz bandwidth each. The data were reduced in AIPS with self-calibration in phase and amplitude (for -band) and phase calibration in -band. The L-band data were combined with archive data (AB923) for better (u,v)-coverage. Details of the data reduction are given by Croston et al. (2007). We also created a high resolution map in -band by combining so far un-published A-configuration data with those in B- and C-configuration.
We used CASA’s MS–MFS clean algorithm (Rau & Cornwell, 2011) to create new images using the original reduced (u,v)-data. We used no fitting of the spectral index as our relative bandwidth is small and there are not enough channels to do so. However, the multi-scale option results in much smoother images, particularly of the -band data, in comparison with the AIPS cleaned version using only one scale. We used a Briggs robust weighting (ROBUST=0). The r.m.s. noise of the -band image is and for -band. The theoretical expected r.m.s. noise is both for - and -band. Hence, our measured noise level is only higher than the thermal noise level.
We created a set of images with a matched (u,v)-coverage to be sensitive to the same angular scale of emission. For this we used a UVRANGE of 0–, which matches the -band () observations, which have the lowest angular resolution. For -band we also used robust weighing more inclined to natural weighting (ROBUST=0.5) to have an angular resolution of , close to the -band observations. The same was done for the -band observations. The shortest baseline in D-configuration is 35 m (ignoring projection effects at low elevations), so that the largest angular scale (LAS) is in -band. NGC 3801 is dominated by two radio lobes which have a maximum angular extent of . Hence, we expect to be able to image all extended emission at -band. At all other observing bands the LAS measurable by the instrument is significantly larger.
3 Morphology of the radio continuum emission
In Fig. 1 we present the distribution of the total power RC emission for our six observing frequencies. The angular resolution444Throughout this paper we refer to the angular resolution of a map as the full-width-half-mean (FWHM) of the synthesized beam (RC) or the point-spread-function (X-ray and FUV)., r.m.s. noise level, and further details of the observations are tabulated in Table 2. Figures 1a and b show an overlay on a three-colour composite made from SDSS - (red) - (green) and -filter (blue) data. Figures 1c and d show an overlay on GALEX FUV data at 155 nm, which we convolved with a Gaussian kernel to a resolution of . For the false-colour representation of the FUV data we used a lower cut-off of the r.m.s. noise level. The data used for the overlays in Figs. 1e and f are Chandra X-ray data between –, which were convolved with a Gaussian kernel to resolution (see Croston et al., 2007, for further details). The radio emission is clearly contained within the lobes and the wings, which show very sharp edges. We do not see any more extended emission at , where the CRe lifetime is the longest. At this low frequency the emission is almost as well contained as at GHz and similarly at and GHz. Only at the highest frequencies, and GHz, the RC emission is contained in a smaller area than at the lower frequencies. This can be explained by the lower signal-to-noise ratio of the high frequency observations, which have a similar r.m.s. noise level but a reduced peak flux density than the other maps.
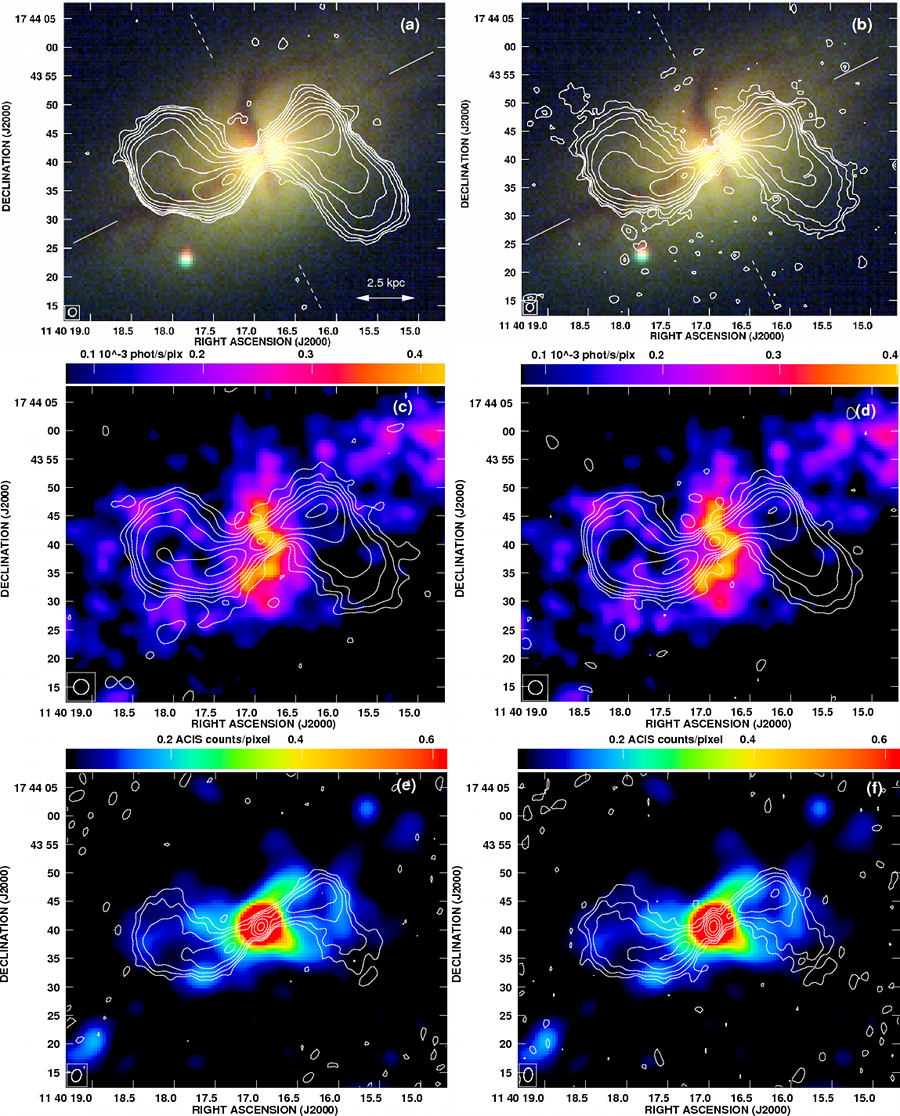
The nucleus clearly has a different spectral behaviour from the radio lobes. It is not visible at and against the bright background emission from the jet, but at the higher frequencies it becomes ever more prominent and at and it is the peak of the RC emission. On both sides, the jet emanates from the nucleus and then blends into the radio lobes. We notice that the maximum of the RC emission in the lobes is not coming from an area close to the nucleus but from an area further away, about 5–10 arcsec (corresponding to –) away from the nucleus. Both lobes have extensions, known as wings, where the eastern wing extends at an angle of to the north-east and the western wing extends at angle of to the south. Where the jet termination points are located, assuming a straight jet from the nucleus to the end of the lobes, the contour lines are compressed (this is best visible in the GHz map) indicating some interaction with the surrounding ISM. There is a faint extension at the termination point of the western lobe, both in the and GHz map, but no such extension is seen at the termination point of the eastern lobe – particularly in the GHz map, although there is some spurious emission at and GHz where the structure is less well defined and does not resemble an extension by the jet.
The positions where the jet has its termination point and bends do correspond to the shells that are seen in X-ray emission, as can be seen from the overlays of the RC emission on to the Chandra X-ray emission (Figs. 1e and f). This suggests a strong connection between the cosmic-ray population in the jets responsible for the RC emission and the hot X-ray emitting gas, as discussed by Croston et al. (2007). We will return to this point in Section 6.2.
4 Radio spectral analysis
4.1 Radio lobes
For the analysis of the radio spectral index we convolved our RC maps to a matched resolution with a Gaussian kernel (). The flux densities were integrated within a rectangular area, using IMSTAT (part of AIPS). The flux density of the nucleus was determined by fitting a Gaussian function to it using IMFIT (part of AIPS). The values for the integrated flux density, for the nucleus and for the lobes are tabulated in Table 3. As the nucleus has a very different spectral behaviour, we subtract the flux density of the nucleus to measure the integrated flux density of the lobes only. We combine our data with those of Das et al. (2005) who used the BIMA interferometer to measure flux densities in the sub-millimetre wavelength regime. We note that we have adjusted their quoted flux density error estimate of 10–20 per cent to take account of the fact that the subtraction of the nucleus in their lower resolution maps () is difficult, introducing further uncertainties. To separate the continuum emission from the radio lobes and the nucleus, they scaled a map with matching resolution to , assuming a constant spectral index of . However, the spectral index varies across the lobes with an amplitude that we infer to be (Das et al., 2005, their fig. 2), which introduces a further error of . Assuming a calibration error the flux density of the radio lobes is . For the flux density of the nucleus, the subtraction is not so critical since the emission is not distributed, so that we only assume a calibration error of .
| Notes. Total integrated flux density, flux density of the nucleus | |||
| and of the radio lobes. Data for are from | |||
| Das et al. (2005). | |||
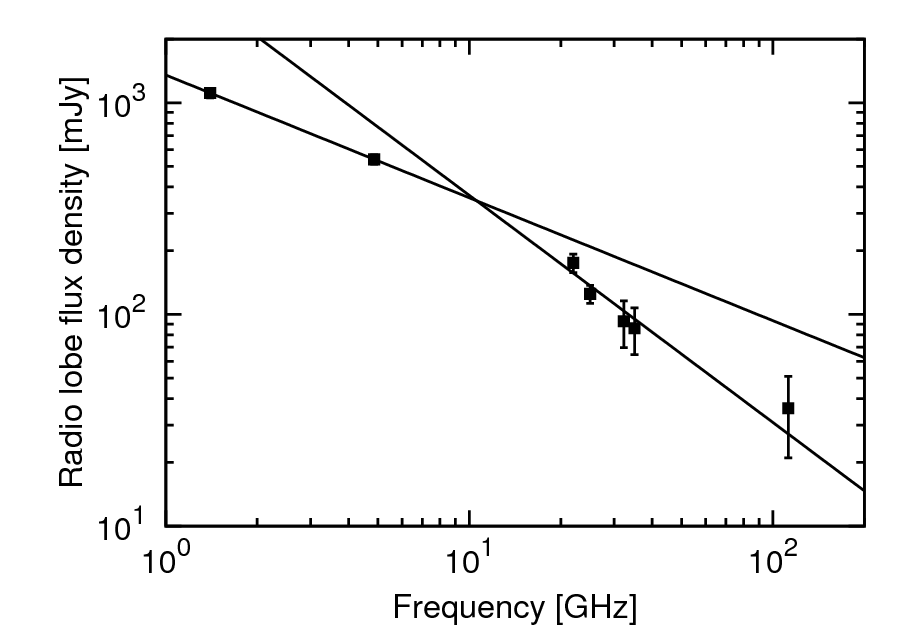
The integrated spectrum of the RC emission in the radio lobes is presented in Fig. 2. It is obvious that the spectrum can not be described by a single power-law fit, corresponding to a constant spectral index. Rather, the spectrum shows some significant steepening at frequencies larger than 10 GHz leading to a curved spectrum. We have therefore fitted two different power-laws to the data, one between 1 and 10 GHz, and one between 20 and . The resulting spectral indices are and . Here, we have defined the radio spectral index by , where is the radio continuum flux density at the observing frequency . We notice that a least-square fit to the VLA data alone between 20 and 35 GHz leads to a much steeper spectral index of . Particularly between and , the spectral index is very steep. Nevertheless, within the error bars, a single power law can be fitted through all five data points with . This means that the flux densities -band at and are consistent with the other measurements, lending support to our chosen way of establishing a flux density scale for the -band data (Section 2.1). We hence proceed with using the -band data in our spatially resolved analysis of the spectral ages, which we present in Section 5.3.
4.2 Nucleus
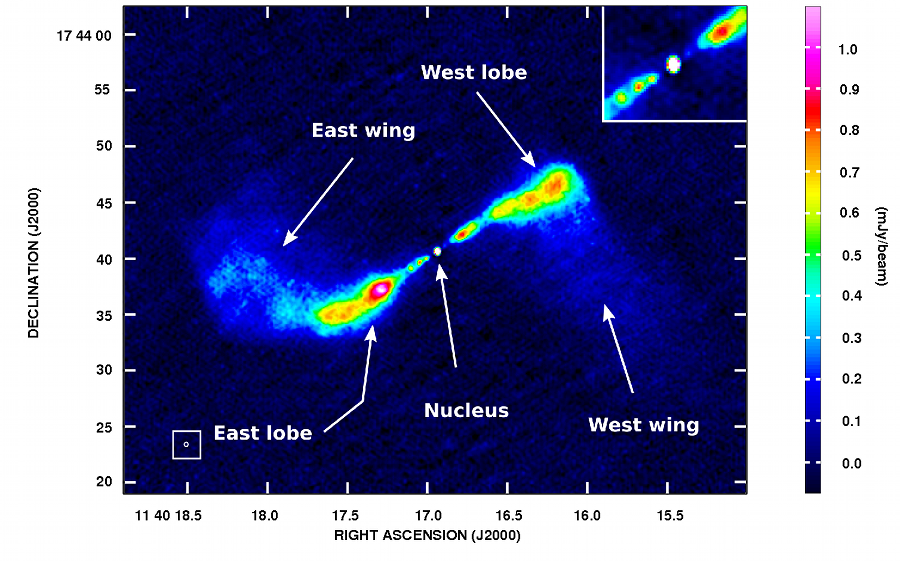
The nucleus has a very different radio spectral index behaviour. It is not detected at among the bright background emission of the jet, so that we can only derive an upper limit for its flux density. At the nucleus can be detected with difficulty in our map made from - and -configuration data. However, our high resolution map made from a combination with -configuration data, presented in Fig. 3, shows the nucleus clearly resolved. At higher frequencies, between and , the nucleus becomes ever more prominent. In the BIMA map at GHz, presented by Das et al. (2005), it has a peak flux density twice as high as the radio lobes. A Gaussian fit using IMFIT to the high-resolution map allows us to determine its position as (). This position agrees with that measured by Das et al. (2005) from the BIMA map, at least within the estimated error which is for the BIMA position. It agrees also within the quoted position uncertainty of with the position of the X-ray nucleus at (Chandra Source Catalog, Evans et al., 2010). The optical position at (2MASS Redshift Survey, Huchra et al., 2012) agrees within with the position of the radio nucleus. We can test the pointing error of the VLA by measuring the position of the nucleus and comparing it with the above position from the high-resolution map, where we find that between and 35 GHz the positional accuracy is better than .
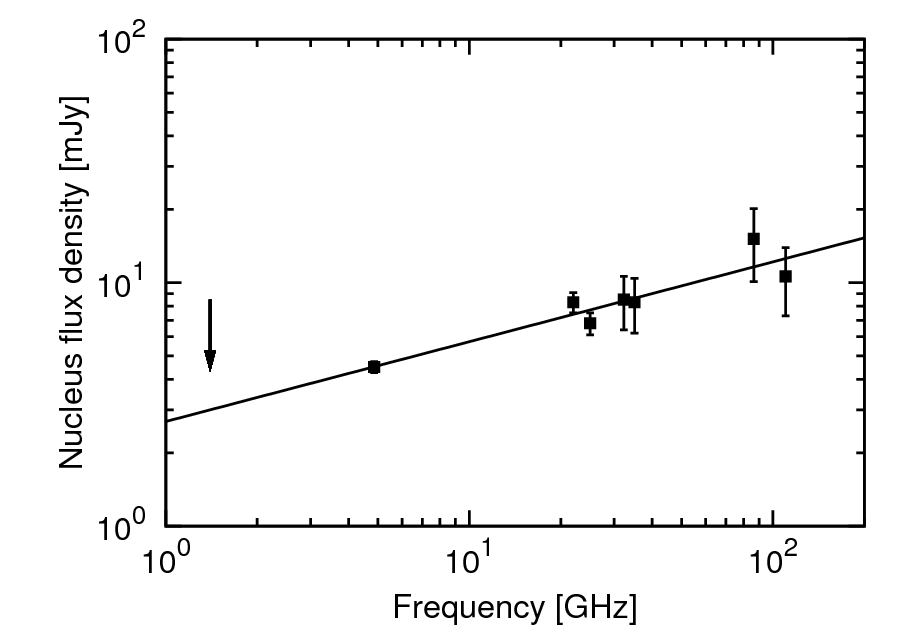
We present the spectrum of the nucleus in Fig. 4, where we include two more data points from the BIMA observations of Das et al. (2005). We can see that the nucleus has clearly an inverted spectrum. A least-square fit to the data points results in . The inverted spectrum can be explained by an optically thick nucleus either due to synchrotron or free-free self-absorption. In case of synchrotron self-absorption we would expect a frequency dependence of the RC intensity as (e.g., Hughes, 1991), and for free-free absorption we would expect . The fact that both jets have approximately the same brightness suggests that relativistic beaming towards the observer plays only a minor role. This means that the jet axis is close to the plane of the sky and we are looking at viewing angles on to the jet axis, where is the Lorentz factor of the relativistic flow in the jet. Thus, we expect the RC emission near the nucleus to be partially optically thin synchrotron emission, with spectral indices of (Marscher, 1980). Our observed spectrum is consistent with this.
4.3 Spectral index distribution
In Fig. 5 we present the distribution of the radio spectral index at a angular resolution of (). As explained in Section 2.2, the maps were imaged with a similar (u,v)-coverage and convolved with a Gaussian kernel to the same resolution, so that they are sensitive to emission on the same angular scale. The maps were then registered to the same grid using HGEOM (part of AIPS), where the alignment is accurate within (Section 4.2). We used the program BRATS (Broadband Radio Analysis ToolS, Harwood et al., 2013) to compute the radio spectral index. This program selects regions within a given set of maps that have emission above a certain signal-to-noise cut-off. Where the flux densities are sufficiently high, the region size is small of the order of one or only a few pixels. In areas of lower flux densities, the region size can be as large as one beam size to increase the amount of flux in it and thus to improve the signal-to-noise ratio. A least-square fit is applied to each map, taking into account the error of the flux density scale and the variation of emission within a certain region. We assumed a flux density error of (), (), and () and a signal-to-noise cut-off of 10. We notice that the and maps dominate the signal-to-noise cut-off and we have applied the same regions to all spectral index maps to ease the comparison between them. We excluded the nucleus in the spectral index study as it has a very different spectral behaviour, as discussed in Section 4.2.
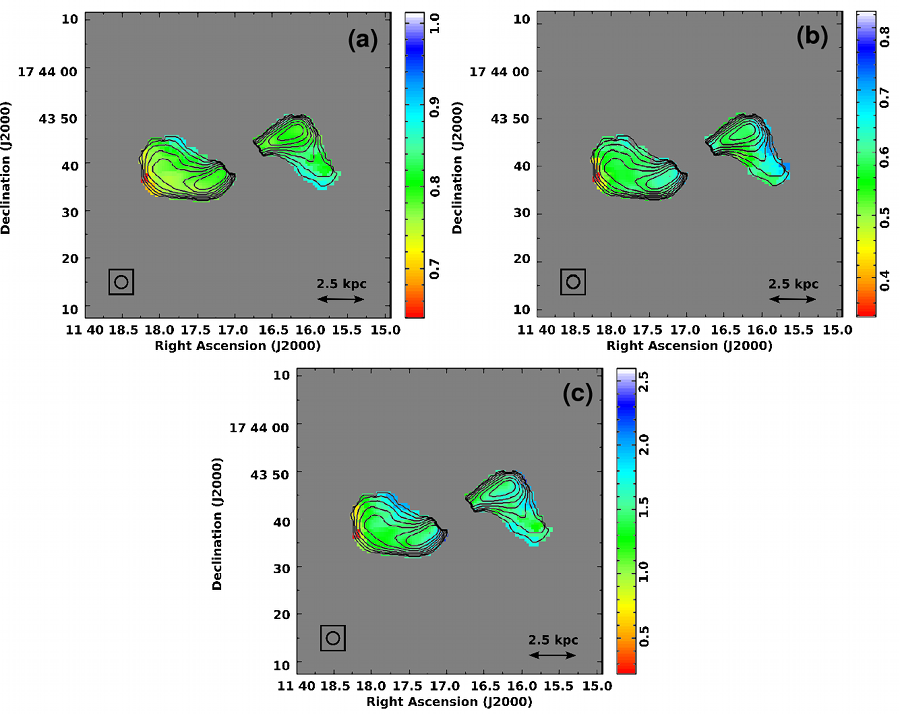
In Fig. 5a the radio spectral index between and is shown. We can see that the spectral index lies in a narrow range between and with little variation in most parts of the lobes where it is around . The flattest spectral indices are found near the termination point of the eastern jet with values between and , whereas the steepest spectral indices are found at the southern tip of the western lobe with values reaching up to .
As we have seen already in Section 4.1, we can fit the RC spectrum by two power laws on both sides , where the spectrum steepens. In Figs. 5b and c we present the radio spectral index between and and between and , respectively. The spectral index between and is mostly ranging between and in the lobes. Close to the eastern termination point, the spectral index is flatter with . The western lobe has a somewhat steeper spectral index at the western edge, where the spectral index has values between and . In contrast, the radio spectral index between and is much steeper with values between and . There is again little variation of the spectral index as function of position within the lobes, with the flattest spectral index close to the eastern termination point ().
Interestingly, at the termination of the western jet the spectral index is even steeper than in the surrounding area, with values between and . Such a steep spectral index is otherwise only found at the western tip at the eastern lobe close to the nucleus. Hota & Saikia (2006) find an east-west asymmetry in the radio spectral index distribution of the southern radio lobe in NGC 6764 and attribute this to a possible asymmetry in the distribution of thermal gas, which contributes a flat RC via free-free emission. The H flux of , measured with HST by Verdoes Kleijn et al. (1999), results in a thermal RC flux density of only 1 mJy at 1 GHz (using the conversion by, e.g., Deeg et al., 1997). This is negligible even at 35 GHz, where the lobes have a flux density of 86 mJy. However, Spitzer dust/PAH and GALEX FUV emission show that star formation is present, which is not seen in the HST H map. It is hence conceivable that some ionized hydrogen is present, enshrouded by dust, which would be visible as thermal RC emission. Croston et al. (2008b) found that the asymmetry in the radio spectral index in NGC 6764 can be seen in the hardness ratio of the X-ray emission as well. They explained this with shock heating of the gas in the ISM, which leads to an increase in X-ray temperature and to a flattening of the RC spectrum due to localized CR re-acceleration. In NGC 3801, however, the X-ray emitting shell of hot gas surrounding the eastern lobe has a lower temperature of than the western shell (). The origin of the radio spectral index asymmetry seen near the jet termination points thus remains unclear.
For the resolved radio spectral index distribution we hence can confirm the results we found for the integrated emission in Section 4.1: we find a flat spectral index of between and and a steep spectral index of between 22 and 35 GHz. We find only little spatial variation of the spectral index across the radio lobes, indicating that the CRe population has an evolutionary history that varies only little as function of position. In Section 5.3 we will use this information to derive a spatially resolved map of the age of the CRe population within the radio lobes.
5 Spectral ageing
5.1 Synchrotron emission
Lobes of radio galaxies are sites of particle acceleration, where cosmic rays can be generated that could be detected directly in Gamma-ray emission (Hardcastle & Croston, 2011). Recently, observations were able to find strong evidence of shock heating in the boundaries of outflowing radio lobes, similar to particle acceleration by supernova remnants (SNRs, Croston et al., 2009; Mingo et al., 2011). We will now work with the assumption that we are observing the synchrotron emission of shock accelerated CRe, similar as in Galactic (or extra-galactic) SNRs. This assumption is supported by our finding above that the radio spectral index between and is with , consistent with that what is found for galactic SNRs (Green, 2009). At higher frequencies, the electron show signs of ageing which is caused by the dominant synchrotron and IC radiation, which are dependent on the square of the electron energy: the electrons with the highest energy are losing their energy fastest. This results in a significant steepening of the radio spectrum above a certain break frequency . The break frequency is as a function of the spectral age , which is the time that has elapsed since freshly accelerated CRe were injected.
The synchrotron emission of a single CRe has a broad peak at the critical frequency , which is related to the electron energy and the strength of the magnetic field component perpendicular to the line-of-sight (e.g., Rybicki & Lightman, 1986):
| (1) |
The radiation losses by synchrotron and IC radiation of a single CRe are given by:
| (2) |
where is the radiation energy density, is the magnetic field energy density, is the Thomson cross section, and is the electron rest mass. Equation 2 is independent of the electron pitch angle , because it assumes that the pitch angles are isotropic, as expected for self-generated magnetic turbulence induced by cosmic-ray streaming (Kulsrud & Pearce, 1969).
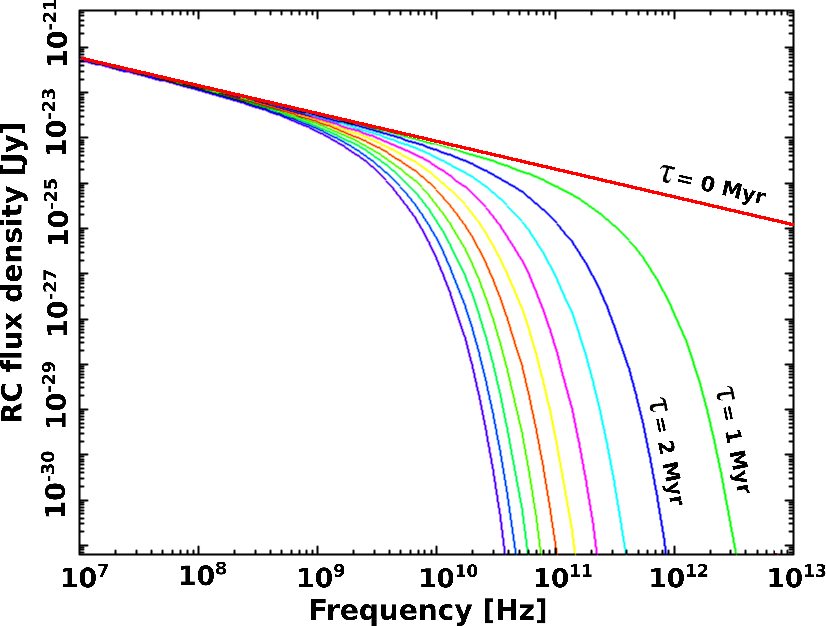
The RC spectrum as a function of time can be numerically integrated using the CRe energy distribution as presented in Kardashev (1962) and the standard synchrotron radiation formula found in Pacholczyk (1970). It steepens above the break frequency for which we find (e.g., Hughes, 1991):
| (3) |
Here, the equivalent cosmic microwave background (CMB) magnetic field strength is defined so that the magnetic energy density is equal to the CMB photon energy density. The break frequency moves with time to lower frequencies. In Fig. 6 we show a selection of JP model spectra, with spectral ages between 0 and 10 Myr with an increment of 1 Myr. We notice that the RC spectrum steepens at much lower frequencies than the actual break frequency, so that model spectra have to be fitted to the data. For instance, for a spectral age of 2 Myr the break frequency is , much higher than the frequency of 10 GHz above where we found a steepening of the RC spectrum (Section 4.1). In order to calculate the synchrotron spectrum and the break frequency we need to estimate the magnetic field strength, which we will do in Section 5.2.
The spectral behaviour above the break frequency is different in various models. The so-called JP model by Jaffe & Perola (1973) assumes that the CRe pitch angles with respect to the magnetic field are isotropized, whereas the KP (Kardashev–Pacholczyk) model assumes that the CRe pitch angle is retained from its injection into the radio lobe. The JP model has the advantage that it better corresponds to the picture of self-generated turbulence due to Alfvén waves (e.g., Kulsrud & Pearce, 1969). The CRe pitch angle with respect to the magnetic field lines will be isotropized in the rest frame of the magnetized plasma. The break frequency is hardly affected by the choice of either the KP or JP model. The main difference between the two models is that the JP model predicts an exponential cut-off, whereas the KP model predicts a spectral steepening of . This is because there are always some electrons at small pitch angles that still do emit synchrotron radiation, even for CRe that are observed above the break frequency. Both the JP and KP model assumes that the CRe are accelerated and injected in a single burst, which are referred to as single injection (SI) models. In addition to the single burst injection models, there are also continuous injection models (e.g., Kardashev, 1962; Pacholczyk, 1970). These models show also a spectral break, but the steepening is with much smaller than what SI models predict.
5.2 Equipartition magnetic field strength
In order to calculate the magnetic field strength the use of the equipartition assumption between the cosmic ray and the magnetic field energy density is the standard method (e.g., Beck & Krause, 2005). FR I radio galaxies appear to have under-pressurized radio lobes if equipartition is used, so that the combined pressure from cosmic rays and magnetic fields is lower than the surrounding pressure of the thermal hot gas as measured from X-ray emission (e.g., Morganti et al., 1988; Croston et al., 2003). In NGC 3801 the shells of hot X-ray emitting gas, which are upstream of the radio lobes, have a thermal pressure that exceeds the pressure inside the lobes by a factor of –5. As the radio lobes are clearly expanding (Croston et al., 2007), the pressure inside the radio lobes as determined from equipartition must be an underestimate. In many FR I radio lobes the equipartition pressure is even lower than that of the surrounding ISM. However, NGC 3801 is an exception to this rule as well as Centaurus A: the pressure in the X-ray emitting shells and hence the true pressure inside the radio lobes is more than an order of magnitude higher than in the surrounding ISM (Croston et al., 2007). This suggests that the deviation from equipartition may not be very large and we use the equipartition estimate as a lower estimate for the magnetic field strength.
We calculated the equipartition minimum internal pressure of the radio lobes, using measurements of the flux density for each lobe to normalize the synchrotron spectrum. Following Croston et al. (2007) we estimate the volumes of the lobes as spheres, finding for the western lobe and for the eastern lobe . These numbers are uncertain, because it is difficult to estimate the line-of-sight depth of the radio lobes. We assumed a broken power-law CRe number distribution with an injection index of . This is the theoretical expectation from first-order Fermi CRe acceleration by strong, non-relativistic shocks (Bell, 1978; Blandford & Ostriker, 1978). As we will see below in Section 5.3, we can fit for the asymptotic radio spectral index at low frequencies which is identical to the injection radio spectral index . We find corresponding to a CRe spectral index of (), in excellent agreement with the theoretical expectation. We integrated the CRe energy between the Lorentz factors of and , with a break at . As usual for radio lobes (both FR I and FR II) we assumed an electron–positron plasma with no contribution from protons. The resulting magnetic field strength is on average , where we assumed a error due to the uncertainty in the source geometry. In order to have pressure equilibrium with the X-ray shells a proton dominated model with and is needed, where is defined by the ratio of the sum of proton and electron energy density to that of the electron energy density alone. The most likely magnetic field strength lies between these two values, which we take into account when calculating the spectral age in Section 5.3.
The break in the CRe spectrum, and hence , depend on the magnetic field strength, and vice versa. As we have now determined that the spectrum steepens above 10 GHz (Section 4.1), we can test whether we have used the correct . From Eq. 1 we can estimate the electron energy at to (for the model with no proton contribution). The frequency of 10 GHz thus corresponds to , in agreement with our assumption above.
5.3 Spectral models
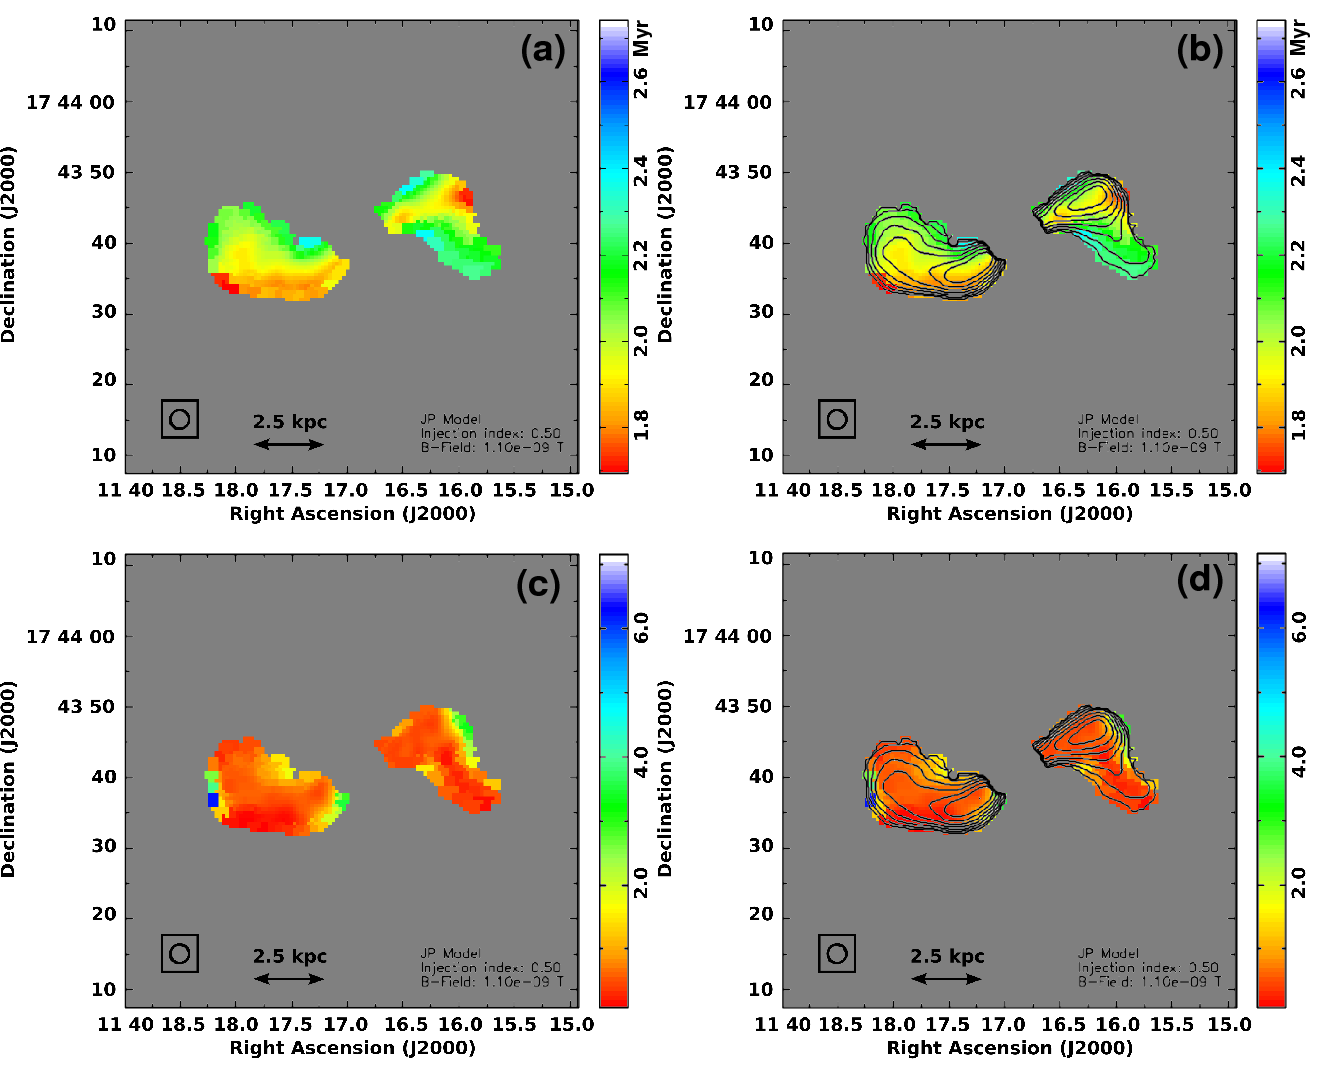
We used BRATS to fit JP models to our observed RC maps with the fitted regions and flux density errors identical to the ones used for calculating the radio spectral index (Section 4.3). A constant magnetic field strength (throughout this section we use ) is assumed throughout the source and the injection radio spectral index is prescribed as well. This leaves as free parameters the absolute flux density normalization and the spectral age, which we fit using a least-square procedure (with 6 frequencies we have as numbers of degrees-of-freedom). We present the spectral age maps that we have obtained, along with the distribution of the reduced () in Fig. 7. We define by
| (4) |
where is the th flux density measurement, the corresponding model value, and the error on the measured flux density. As already found in our analysis of the radio spectral index in Section 4.3, the variation of the radio spectral index is small across the lobes and so is the variation of the spectral age. The age lies within a range of and . The youngest CRe are found near the termination points of both the western and eastern jet, where the age is only . The area between the nucleus and the termination points, where the jet is presumably located, shows also a slightly younger age – than in most other areas of the lobes –. Areas where the age is larger than are sparse and found only at the outer edge of both lobes. We notice that these are to be considered as the upper limits of the spectral age, because we have used the lower limit on the magnetic field strength from equipartition. For the higher magnetic field strength, the ages are reduced by a factor of 10. The minimum spectral age, , is clearly larger than zero. This differs from FR II radio galaxies that have a so-called ‘hotspot’ with a spectral age consistent with zero (e.g., Harwood et al., 2013). The difference can be explained by the fact that in NGC 3801 there is no dominating young emission component such as found in the hotspots of FR II radio galaxies, because cosmic-ray transport plays an important role. We will come back to this aspect in more detail in Section 6.2.
A magnetic field strength of , with no contribution from protons, corresponds to a spectral age of 2 Myr in most parts of the radio lobes, in good agreement with the dynamical age of the lobes, as determined by Croston et al. (2007) based on the expansion speed of the X-ray emitting shells. For , however, the magnetic field strength derived for a proton dominated model, we find a spectral age of , which can be regarded as the lower limit. Thus, will use in the following the spectral ages for the lower magnetic field strength and refer to Section 6.2 for a detailed discussion of the most likely value for the age of the radio lobes.
We do not include the BIMA data point at when fitting for the spectral age. We tested the influence of the data by extrapolating the radio spectral index between and to . This is possible, because the radio spectral index between and is almost identical to the spectral index between and (Das et al., 2005). The result is that the spectral age is reduced by the inclusion of the data point to . This is because the break frequency is shifted to higher frequencies as the flux density at is too high for the JP model fitted to the data points between and only. As explained above, the RC emission at each location is not caused by a single-age plasma, but by a superposition of various CRe populations. In this case, we expect to observe a superposition of JP models, resulting in a more power-law type behaviour for higher frequencies in agreement with the BIMA observations. Alternatively, a different spectral model such as the KP model, which does not have an exponential decrease of the flux density at higher frequencies, may be fitted. A variety of the JP model is the so-called Tribble JP model, that drops the assumption of a constant magnetic field within the source (Tribble, 1993). Hardcastle (2013) modelled Tribble JP spectra, assuming a Maxwell–Boltzmann distribution of magnetic field strengths, and found that the shape of the spectrum at higher frequencies beyond the break frequency is not as steep as for a JP model. We hence fitted a Tribble JP model to the data and found that the fit is almost identical to the pure JP model (reduced , ). The same is true for the physically less motivated KP model. This may come as no big surprise, because we are fitting only for frequencies much smaller than the break frequency at and the difference between the JP, KP and Tribble JP model are only pronounced above the break frequency. The same result was found by Harwood et al. (2013), who fitted the various varieties of spectral models to data of two FR II sources and found only a small difference between them. The most promising aspect of the Tribble JP model is that it can explain the better fitting to the data points, as for a KP model, but without making the unphysical assumption of preserved electron pitch angles.
The quality of the fit is mostly very good, with almost all parts of the lobes having a reduced . Only at the edges of the lobes, where the signal-to-noise ratio is lowest, is the reduced larger with . The eastern edge of the eastern lobes has the highest reduced , which is at the area where no spectral steepening for frequencies larger than 10 GHz is observed (Section 4.3). We notice that the areas with the youngest spectral ages, hereafter called the ‘termination points’, do not coincide with a particular high value of reduced , nor does the younger area near the southern edge of the eastern lobe. Only the western edge of the western lobe has a slightly increased reduced . The oldest spectral ages are all located in areas of a low reduced . We conclude that the variation in CRe age is not due to a variation in the quality of the fit, supporting the idea that we are tracing an actual change of the spectral behaviour. We also varied the injection radio spectral index and found that , which is the theoretically expected value, minimizes the average reduced of the regions in our spectral age maps.
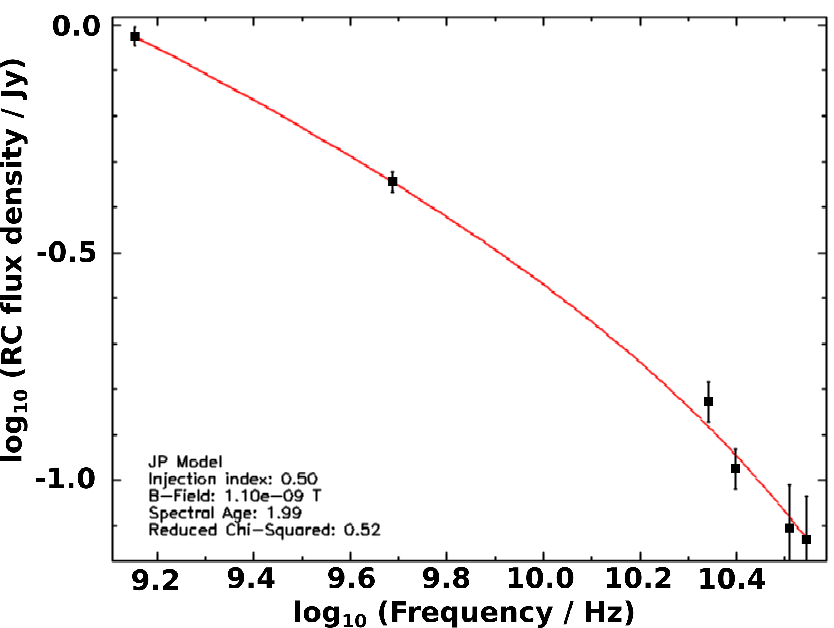
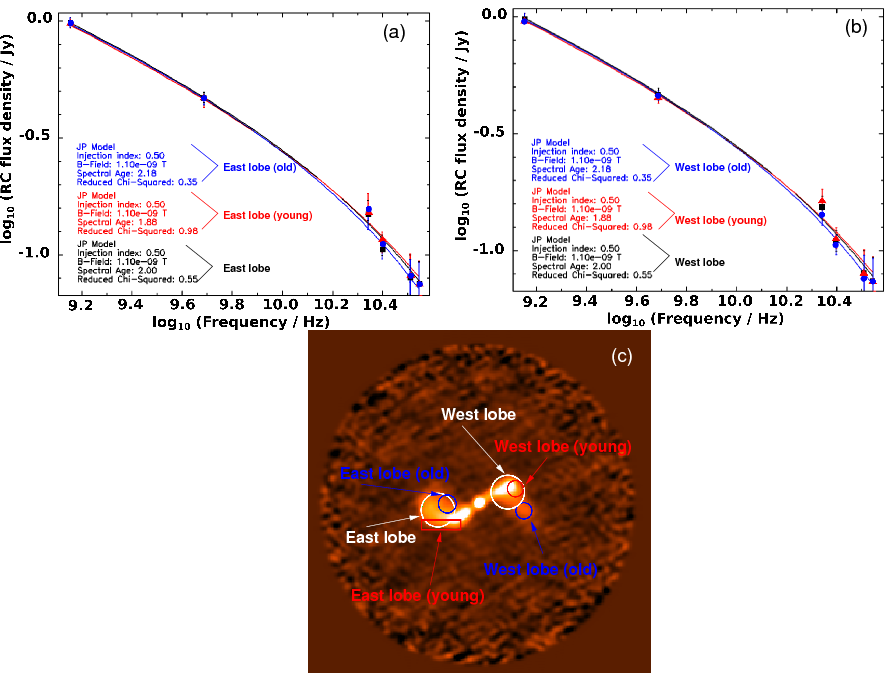
We can also repeat the spectral age analysis for the integrated flux densities as measured from the radio lobes. This is a valid procedure because of the small variations in the point-to-point fitted ages. The resulting spectrum and the JP model fit to the data are shown in Fig. 8. For the integrated measurements we derive a CRe age of with a reduced . This age is consistent with the spatially resolved analysis, which as described above shows only little variation of the spectral age across the lobes with values mostly between . In Fig. 9 we show spectra of RC emission integrated in small regions and fitted with a JP model. We plotted the spectra in each lobe on top of each other to highlight the small changes that can be seen for frequencies , where younger areas show a smaller degree of spectral steepening as expected. In order to estimate the error on our electron spectral ages, we varied the input parameters and repeated the fit of the JP model to the data. This was done for both the resolved and the integrated spectral age measurements. A change of the injection spectral index by has a effect on the derived electron ages. Hence, we adopt this number as the formal error of the spectral ages.
6 Discussion
6.1 Energetics of the radio lobes
NGC 3801 is an example of a radio galaxy with kpc-sized lobes that are surrounded by hot X-ray emitting gas. A key question is whether the radio lobes are heating the surrounding ISM of its elliptical host galaxy and are thus transferring the kinetic energy of the black hole powered jets to the environment. This can be done via shock heating where the radio lobes expand supersonically into the surrounding gas and are thus heating the gas via adiabatic compression. Such a model was proposed by Croston et al. (2007) who found that the density contrast of the X-ray emitting gas across the shock is a factor of , in agreement what is expected from Rankine–Hugoniot shock jump conditions. They found Mach numbers of 3–8, confirming a supersonic expansion of the radio lobes. The sound speed in the ISM is , so that a Mach number of corresponds to a lobe expansion speed of . If we take the distance between the nucleus and the re-acceleration site as , using the distance to the brightest parts of the symmetric radio lobes without the wings, we can derive the lobe dynamical age as . Our derived spectral age of () is a factor of two lower than this dynamical age, which can be considered as a good agreement given the uncertainties involved.
We now discuss the various effects to be taken into account that can alter the spectral age in comparison to the dynamical age of the lobes. These are IC and adiabatic losses, cosmic-ray transport (either by diffusion or convectively in the backflow from the termination points) and in situ re-acceleration. Any additional losses such as adiabatic losses and IC radiation would mean that the spectral age is an overestimate of the true lobe age. The ratio of IC losses to synchrotron radiation is proportional to the ratio of the radiation energy density to the magnetic field energy density . The magnetic field energy density for (Section 5.2) is . The radiation energy density consists of a contribution from the stellar radiation background field and heated dust as well as the CMB. We calculated the dust component from the far-infrared luminosity as measured by IRAS and used an area of to calculate the dust component as . We scaled the stellar component to the dust component by and added the CMB radiation energy density of . The resulting radiation energy density is , only of the magnetic field energy density. We hence conclude that energy losses of the CRe due to IC radiation are small in relation to losses due to synchrotron radiation.
The effect of adiabatic losses on the CRe can be estimated by comparing the work of the bubbles to carve the cavities into the ISM with the energy content of the radio lobes. Croston et al. (2007) estimate that the total energy in the shells, the sum of thermal and kinetic energy, is . This is in good agreement with the pressure work available from the internal pressure, which is . The energy required to inflate both cavities is only , a factor of lower than the energy stored in the shells. This discrepancy can be understood by the large ratio – of the internal pressure within the lobes to the pressure of the ISM, assuming that the internal pressure is equal to the pressure of the thermal X-ray emitting gas in the shells surrounding the radio lobes. Thus, adiabatic losses are only a small contribution to the CRe losses and will be neglected in the following discussion.
Cosmic-ray transport can play an important role in shaping the spectral age distribution: cosmic rays may diffuse along magnetic field lines or be transported convectively together with the magnetized plasma. In order to determine the structure of the magnetic field within the lobes, linear polarization measurements would be required; however a study by Hardcastle et al. (2012) of the FR I source 3C 305 suggests that there can be significant ordering of magnetic fields within radio lobes. This would allow CRe to stream along magnetic field lines with a maximum speed equal to the Alfvén velocity , where is the gas density. The gas density within the lobes is smaller than that of the ISM, , so that the Alfvén velocity within the lobes is larger than , comparable to the lobe expansion speed. During the dynamic age of the lobes the cosmic-ray diffusion length may be as high as 7 kpc, comparable to the size of the lobes. We hence expect cosmic-ray diffusion to be able in principle to even out any difference in the spatial distribution of the CRe spectral age. As an alternative to diffusion, cosmic rays can also be transported convectively together with the magnetized plasma. Hydrodynamical simulations of FR I galaxies by Perucho & Martí (2007) show that the backflow surrounding the radio lobes can have mildly relativistic velocities with –, much faster than the lobe expansion speed. A convective transport in the backflow is hence a second possibility to explain the very uniform distribution of CRe spectral ages within the lobes.
If IC and adiabatic losses were significant, we would overestimate the spectral age because we underestimate the CRe energy losses. The largest uncertainty comes however from the estimate of the magnetic field strength. For the higher magnetic field strength of , which assumes a pressure contribution from protons, the spectral ages are approximately a factor of (see Eq. 3) lower than for the equipartition magnetic field of (without the contribution from protons).
6.2 Dynamical age of the lobes
Now that we have established that IC and adiabatic losses of the CRe do not influence our estimate of the spectral age, but cosmic-ray transport does, we try to constrain the dynamical age of the lobes. In Section 5.3 we found that the minimum spectral age is () and hence larger than zero. This can be explained by cosmic-ray transport: the CRe population at any given location is not a single-age plasma but a superposition of CRe populations that have been transported from various locations within the lobes. This scenario is corroborated by the fact that the spectral age distribution is almost uniform across the lobes with only small variations. Moreover, we observe always a line-of-sight average of the spectral age, further reducing the age differences within the lobes. Ongoing CRe acceleration, for instance in the termination points, lowers the spectral age but since the older components are dominating, the observed variation in the spectral age is small. We refrain from using a continuous injection model to explain the spectral behaviour of our source, because such a model is only valid if one emission component dominates, which is for instance the case in a ‘hotspot’ of a FR II galaxy (Heavens & Meisenheimer, 1987). The oldest CRe we find in the radio lobes have an age of . Thus, the most likely dynamical age lies between the ages of and , where the latter value assumes a constant expansion speed of . The good agreement between spectral and dynamical age supports the assumption of an equipartition magnetic field strength with . A higher magnetic field strength, where the magnetic pressure is in equilibrium with the pressure of the X-ray emitting shells, is unlikely, because the resulting spectral ages would be a factor of 10–20 too low in comparison with the dynamical age.
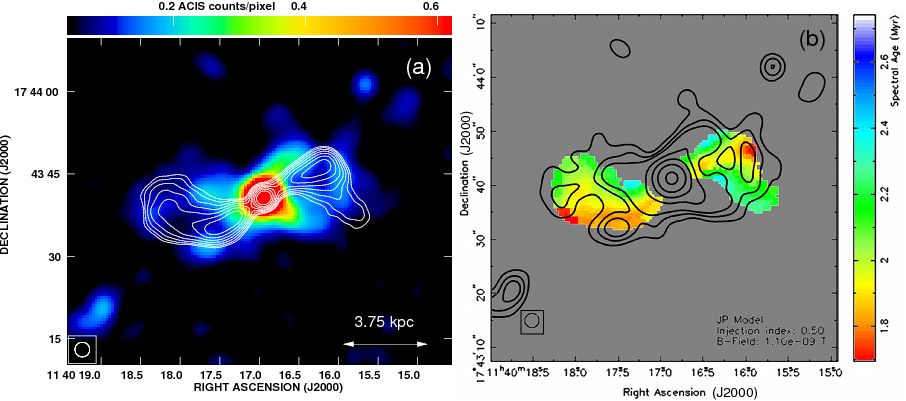
In Fig. 10 we present an overlay of the spectral age map on to the Chandra X-ray emission, in order to study the interplay between the CRe acceleration and the shock heating of the surrounding gas. We find that the termination points of the spectral age maps (see Fig. 7) are indeed spatially close to the X-ray shells, although the prominent eastern termination point is located within a gap of the X-ray emission. This strengthens our conclusion, and that of Croston et al. (2007), that the X-ray emitting shells are indeed stemming from shock heating due to the expanding radio lobes. The shocks upstream of the contact discontinuity heat the surrounding gas of the ISM and the shocks downstream of the discontinuity re-accelerate the CRe. We do not have the spatial resolution to resolve the two regions, but Croston et al. (2009) did find that the X-ray emission in Centaurus A is indeed upstream of the RC emission, displaced by a distance of .555In their case the X-ray emission is of non-thermal origin by highly energetic CRe that are emitting synchrotron radiation in the X-ray wavelength regime. This can be understood by the much larger lobe expansion speed of Centaurus A () in comparison to NGC 3801, which allows effective particle acceleration in shocks.
The age variation of the CRe in the lobes allows us to calculate the CRe bulk speed. The transport length is equal to the length of the wing, which is for both wings. The age difference between the CRe age at the termination points, , and the oldest CRe, , is , so that we find , far higher than the Alfvén speed of . The Alfvén speed is only a lower limit though, because we have used the gas density of the ISM to calculate it (Section 6.1) and the density within the radio lobes is likely much lower. We can hence not rule out the streaming of cosmic rays along the magnetic field lines as an alternative mode of transport. However, this would require a spatial ordering of the magnetic field structure. Linear RC polarization measurements find a fractional polarization that is generally less than the theoretical maximum expected for a purely ordered magnetic field. In the presence of a turbulent component, the transport can be characterized rather by diffusion, where the required diffusion coefficient of is with a factor of 10–100 higher than what is observed in the Milky Way or in other galaxies (e.g, Strong et al., 2007; Heesen et al., 2009; Berkhuijsen et al., 2013; Buffie et al., 2013; Tabatabaei et al., 2013). The more likely scenario is thus that the CRe are indeed transported not by diffusion but convectively together with the backflow of magnetized plasma. Such a backflow has been proposed to explain the spectral index gradient in giant FR II radio galaxies before (Alexander & Leahy, 1987), but is also seen in hydrodynamical simulations of FR I radio galaxies similar to NGC 3801 (Perucho & Martí, 2007).
Apart from the termination points, we see another area of younger CRe along the area where the jet probably lies within the lobes. This could attributed to re-acceleration either within the jet (i.e. close to the nucleus) or within the radio lobes. Shock waves in the jet can be formed by standing re-collimation shocks, which are seen in the simulations of Perucho & Martí (2007). Such shocks may be visible as knots in the RC emission, particularly at high resolution. In the inner jet of Centaurus A Hardcastle et al. (2003) find a number of knots, which do not have any detectable proper motion. Because they are almost stationary with respect to the relativistic flow in the jet, they are either candidates for standing shocks or shocks in the downstream flow of a collision with an obstacle (Goodger et al., 2010) – both are capable of in-situ particle acceleration within the jet. However, even in Centaurus A there are strong indications for another, more diffuse acceleration process in the outer of the jet, because the X-ray emission is truly diffuse and does not contain any knots (Kataoka et al., 2006; Hardcastle et al., 2007). Such diffuse X-ray emission is seen also in the jets of many other FR I sources (e.g., 3C 66B; Hardcastle et al., 2001).
The high-resolution map in Fig. 3, which has a spatial resolution of 100 pc, shows several knots of emission in the jet, with the most prominent one about away from the nucleus in the eastern lobe and three smaller knots in the eastern jet closer to the nucleus. In the western jet, there is an extended knot away from the nucleus and no other visible knots further downstream. But comparing these results with the spectral age map in Fig. 7, we do not find any striking similarities. We do not resolve in the spectral maps the inner knots within from the nucleus, because the nucleus confuses the emission, but we can already see that the jet is hardly younger than the surrounding plasma. Hence, we may be witnessing the influence of diffuse shock acceleration on the CRe and thus the RC emission. We notice that where the eastern jet bends from a south-eastern direction by to a western direction, most of the younger CRe in the eastern lobe are found. In the western lobe, where no such change of direction is seen, there is also no such prominent area of younger CRe. This favours the in-situ re-acceleration scenario, because if backflow was the cause the eastern and western jet should have a similar CRe age along the jet. At the position where the jet bends, there is a bright blob of hot X-ray emitting gas. We hence conclude that the CRe are accelerated by shock waves downstream of the contact discontinuity, where shocks upstream heat the ISM to X-ray emitting temperatures, in agreement with the observations of Centaurus A by Croston et al. (2009).
The similarity to Centaurus A extends also to the RC spectrum: the young inner lobes in Centaurus A do not show any spectral steepening up to observing frequencies of , indicating a very young CRe population with a spectral age of less than 1 Myr (Alvarez et al., 2000). Clarke et al. (1992) showed that the spatially resolved radio spectral index between and GHz has only little variation in both inner lobes. This can be explained again by an effective cosmic-ray mixing process such as convective transport in the backflow of the magnetized plasma.
6.3 The evolution of the radio lobes
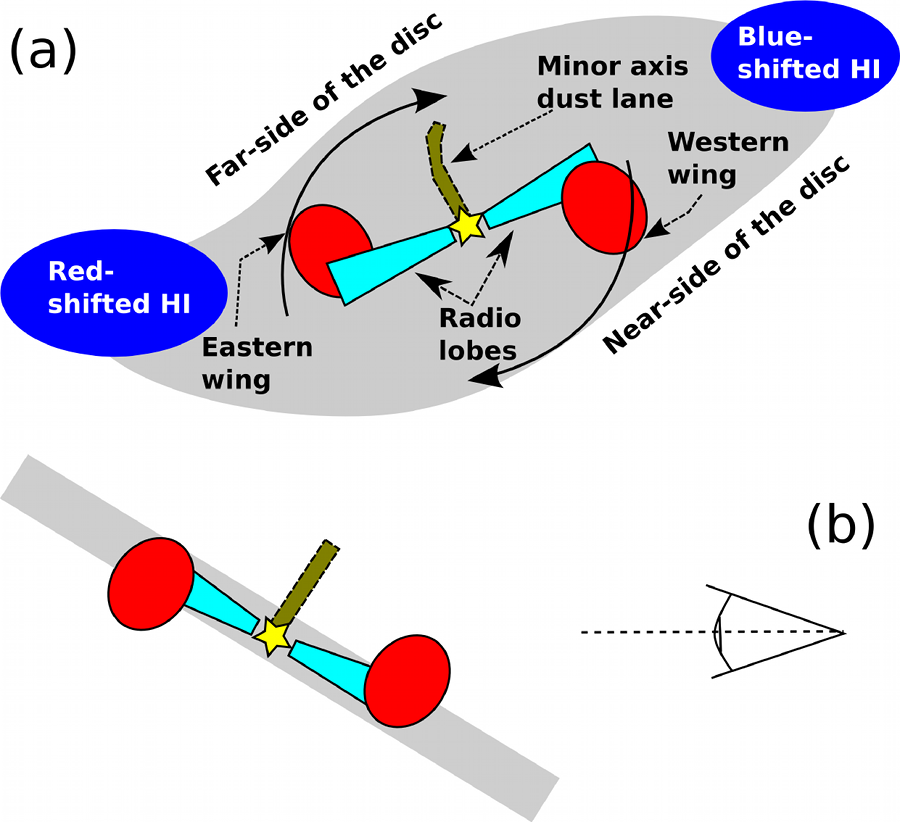
NGC 3801 is a young radio galaxy that we see in the early stages of its eventual transition to become a more developed FR I source. It has a so-called ‘Z’-shaped symmetry, with the wings of the radio lobes pointing in opposite directions. A possible explanation is that the jet hits a shell of denser gas and gets deflected. The rotating gas in the ISM then moves the magnetized plasma and shock heated gas downstream (Gopal-Krishna et al., 2012). Also, the radio lobes are more likely to expand along the vertical density gradient of the ISM. Typical H I scale heights in spiral galaxies are only a few hundred parsec which can be used as a reference, because much less is known about the scale height in elliptical galaxies. It is difficult to establish the exact geometry of the radio lobes, but we note that the jets are aligning well with the major axis of the galaxy (Figs. 1a and b). As noted by Das et al. (2005) it is very unlikely, however, that we are seeing the galaxy in edge-on position and that the dust lane extending to the south-east is indeed in the galactic plane. It is clear from H I measurements that the east side is redshifted and the west side is blue shifted (Hota et al., 2009). But we do not know whether the part north-east of the major axis is on the far or near side. We can try to make an educated guess by noting that the dust lane along the minor axis is much more prominent on the north side of the nucleus. This dust is likely associated with the molecular hydrogen as traced by the observations of Das et al. (2005). They found a gas ring with 2 kpc radius rotating around the nucleus and aligned with the minor axis. Hence, the dust extends vertically in front of the far side of the galaxy north-east of the nucleus, creating the visible dust lane. In this scenario, the wings would be indeed downstream of the jet explaining the ‘Z’-shaped symmetry. This geometry is shown in Fig. 11a ; for a five band multi-wavelength image, which encompasses the entire galaxy, we refer to Hota et al. (2012, their fig. 1).
Hota et al. (2009) measured the circular rotation speed as , which is a factor of three lower than the lobe expansion speed of . We hence would expect the wings to expand also into the direction opposite to the rotation of the gas, resulting in a structure more reminiscent of the X-shaped lobes of 3C 305 (Hardcastle et al., 2012), which is not observed. Also, the fact that the H I is observed in a ring surrounding the galaxy suggests that the geometry is close to an edge-on position. The deflection of the lobes downstream in the rotating ISM would be hardly visible because it is mainly directed along the line-of-sight. The rotating ISM scenario may hence not offer the sole explanation. An alternative scenario is that the jets lie not exactly in the plane of the galaxy, but slightly inclined. In this case the wings could expand vertically along the density gradient away from the gaseous disc (Fig. 11b). Because the jets are in exactly opposite directions, the wings would inflate into the opposite sides with respect to the galactic plane, creating the ‘Z’-shaped geometry. Even if the jets do lie exactly in the plane of the galaxy, any warping of the gaseous disc creates an asymmetry. The stellar distribution indeed shows a pattern reminiscent of a hysteresis loop (Heckman et al., 1986; Hota et al., 2012), indicative of such a warp. Thus, we propose that for NGC 3801 the scenario of the rising wings along the vertical density gradient of a gaseous, strongly warped, disc is the most likely explanation for the ‘Z’-shaped symmetry.
6.4 AGN feedback
NGC 3801 has been proposed by Hota et al. (2012) as a galaxy that is in transition from a star-forming galaxy to a so-called ‘red and dead’ galaxy. The extended 30 kpc ring of H I led Hota et al. (2012) to conclude that NGC 3801 underwent a gaseous merger one billion years ago, observing that the H I ring is very asymmetric having a rotation period of 300 Myr (Hota et al., 2009). If the gaseous merger had happened much longer ago, the H I distribution should be almost even. It is likely that this gaseous merger has initiated the star formation and also created the 2 kpc molecular ring that rotates perpendicular to the galactic plane. Hota et al. (2012) found the presence of GALEX FUV/NUV emission, indicating that the star formation occurred in the last few , whereas the young age (few Myr) of the radio lobes means that the AGN has only recently started to become active. This is in accordance with the results of Schawinski et al. (2007) who find that in general the AGN activity peaks about 500 Myr after the onset of the star formation.
In Figs. 1c and d we show an overlay of the RC emission on to GALEX FUV emission tracing star formation in the past 100 Myr. The distribution of the NUV/FUV emission is much more extended than the size of the radio lobes, so that we are presenting here only the inner third of the galaxy (see Hota et al., 2012, for the full map of FUV/NUV emission). The star formation is distributed in three main complexes following the wisp-shaped dust lane. The radio lobes are situated in the gaps between the star formation complexes, with the most prominent one roughly aligned with the dust lane along the minor axis. The central star forming complex is very similar to the disc of rotating molecular gas suggesting an association. Clearly, the jets and the lobes have not yet interacted with the molecular gas disc. The eastern lobe is surrounded by a rim of FUV emission, with the lobe residing in a depression of FUV emission. The wing of the western lobe is extending into a region, which contains little FUV emission. Hence, the distributions of the RC and the FUV emission display hints of an anti-correlation. It is possible that we are witnessing the early stages of the interaction between the star formation complexes and the radio lobes. Alternatively, the radio lobes are just expanding into the areas where the gas density is lower as already discussed in Section 6.3. It is sometimes proposed that feedback by AGN lobes can possibly even trigger star formation (e.g., van Breugel & Dey, 1993). We see no indication for young stars of a few Myr age, which would be detected by H emission (see map by Verdoes Kleijn et al., 1999). On the other hand, the age of the radio lobes is so small that it may well be that such stars are not yet formed or are still enshrouded by dust.
With the current expansion speed of the lobes the lobes will have expanded to the size of the galaxy in , thus possibly disrupting the star formation and eventually shutting it down. Our preferred scenario is hence that NGC 3801 is an example for a galaxy where the AGN feedback is able to quench star formation and hence shape the galaxy luminosity function as suggested by theoretical models (e.g., Croton et al., 2006).
7 Conclusions
We have observed the kpc-sized radio galaxy NGC 3801 with the VLA at frequencies between 22 and 35 GHz and combined the new data with VLA and BIMA archive data in order to study the RC emission between and . We estimated the magnetic field strength by energy equipartition and used pixel-by-pixel based fitting routines from the program BRATS (Broadband Radio Analysis ToolS, Harwood et al., 2013) to fit JP model spectra to the RC maps. Our main conclusions are:
-
1.
The integrated RC flux density of the radio lobes has a spectral index break at . The spectral index steepens from between and to between 22 and 35 GHz. A JP-model fit to the integrated data results in a spectral age of .
-
2.
The dynamical age of the radio lobes is , using the expansion velocity of the lobes as measured from X-ray observations by Croston et al. (2007). The remarkably good agreement between spectral and dynamical age corroborates the scenario proposed by Croston et al. (2007), where the hot X-ray emitting gas surrounding the radio lobes in shells is created by shock heating due to the expansion of the radio lobes. The energy as contained in the lobes is comparable to the energy of the ISM of the host galaxy, clearly able to influence its further evolution. NGC 3801 is a candidate for an elliptical galaxy, where in the aftermath of a gaseous merger star formation is to be suppressed in the next few 10 Myr due to feedback by its AGN.
-
3.
The distribution of the radio spectral index across the radio lobes has only little variation, requiring an effective mechanism to re-distribute CRe within the lobes. A JP-model fit to the maps results in a map of the CRe spectral age, as derived by a superposition of mixed CRe populations. We find values between and , where the youngest CRe are found at the jet termination points and the oldest in the wings of the radio lobes. The small age variation requires a CRe bulk velocity of , where the CRe are transported convectively within the backflow of the magnetized plasma surrounding the relativistic jet.
-
4.
In-situ re-acceleration of CRe is happening at the jet termination points, both in the eastern and western radio lobe. The integrated radio spectral index between and is with flatter than expected for a pure JP model. This suggests ongoing CRe acceleration within the radio lobes. The spatial correlation between the hot X-ray emitting gas and the areas with a younger CRe spectral age means that the CRe are accelerated in shock waves downstream of the contact discontinuity, where the shocks upstream are responsible for heating the ISM to temperatures where they emit thermal X-ray emission.
- 5.
-
6.
The closest agreement between spectral and dynamical age is found for an equipartition magnetic field strength of , with no contribution from protons, assuming a pure electron–positron plasma. NGC 3801 is a young radio galaxy, where entrainment of protons does play a lesser role than in more developed FR I radio galaxies such as 3C 31 (Croston & Hardcastle, 2014).
Acknowledgements
VH and JHC acknowledge support from the Science and Technology Facilities Council (STFC) under grant ST/J001600/1. JJH wishes to thank the STFC for a studentship and the University of Hertfordshire for their generous financial support. This research has made use of the NASA/IPAC Extragalactic Database (NED) which is operated by the Jet Propulsion Laboratory, California Institute of Technology, under contract with the National Aeronautics and Space Administration. The anonymous referee is thanked for several constructive comments that improved the clarity of the manuscript.
References
- Alexander (1987) Alexander P., 1987, MNRAS, 225, 27
- Alexander & Leahy (1987) Alexander P., Leahy J. P., 1987, MNRAS, 225, 1
- Alvarez et al. (2000) Alvarez H., Aparici J., May J., Reich P., 2000, A&A, 355, 863
- Beck & Krause (2005) Beck R., Krause M., 2005, AN, 326, 414
- Bell (1978) Bell A. R., 1978, MNRAS, 182, 147
- Belsole et al. (2004) Belsole E., Worrall D. M., Hardcastle M. J., Birkinshaw M., Lawrence C. R., 2004, MNRAS, 352, 924
- Berkhuijsen et al. (2013) Berkhuijsen E. M., Beck R., Tabatabaei F. S., 2013, MNRAS, 435, 1598
- Blandford & Ostriker (1978) Blandford R. D., Ostriker J. P., 1978, ApJ, 221, L29
- Blundell & Rawlings (2000) Blundell K. M., Rawlings S., 2000, AJ, 119, 1111
- Buffie et al. (2013) Buffie K., Heesen V., Shalchi A., 2013, ApJ, 764, 37
- Carilli et al. (1991) Carilli C. L., Perley R. A., Dreher J. W., Leahy J. P., 1991, ApJ, 383, 554
- Clarke et al. (1992) Clarke D. A., Burns J. O., Norman M. L., 1992, ApJ, 395, 444
- Croston & Hardcastle (2014) Croston J. H., Hardcastle M. J., 2014, MNRAS, accepted (arXiv:1312.5183)
- Croston et al. (2004) Croston J. H., Birkinshaw M., Hardcastle M. J., Worrall D. M., 2004, MNRAS, 353, 879
- Croston et al. (2003) Croston J. H., Hardcastle M. J., Birkinshaw M., Worrall D. M., 2003, MNRAS, 346, 1041
- Croston et al. (2008a) Croston J. H., Hardcastle M. J., Birkinshaw M., Worrall D. M., Laing R. A., 2008a, MNRAS, 386, 1709
- Croston et al. (2005) Croston J. H., Hardcastle M. J., Harris D. E., Belsole E., Birkinshaw M., Worrall D. M., 2005, ApJ, 626, 733
- Croston et al. (2008b) Croston J. H., Hardcastle M. J., Kharb P., Kraft R. P., Hota A., 2008b, ApJ, 688, 190
- Croston et al. (2007) Croston J. H., Kraft R. P., Hardcastle M. J., 2007, ApJ, 660, 191
- Croston et al. (2009) Croston J. H. et al., 2009, MNRAS, 395, 1999
- Croton et al. (2006) Croton D. J. et al., 2006, MNRAS, 365, 11
- Das et al. (2005) Das M., Vogel S. N., Verdoes Kleijn G. A., O’Dea C. P., Baum S. A., 2005, ApJ, 629, 757
- Deeg et al. (1997) Deeg H.-J., Duric N., Brinks E., 1997, A&A, 323, 323
- Eilek & Arendt (1996) Eilek J. A., Arendt P. N., 1996, ApJ, 457, 150
- Emonts et al. (2012) Emonts B. H. C., Burnett C., Morganti R., Struve C., 2012, MNRAS, 421, 1421
- Evans et al. (2010) Evans I. N. et al., 2010, ApJS, 189, 37
- Goodger et al. (2008) Goodger J. L., Hardcastle M. J., Croston J. H., Kassim N. E., Perley R. A., 2008, MNRAS, 386, 337
- Goodger et al. (2010) Goodger J. L. et al., 2010, ApJ, 708, 675
- Gopal-Krishna et al. (2012) Gopal-Krishna, Biermann P. L., Gergely L. Á., Wiita P. J., 2012, Research in Astronomy and Astrophysics, 12, 127
- Green (2009) Green D. A., 2009, Bulletin of the Astronomical Society of India, 37, 45
- Hardcastle (2013) Hardcastle M. J., 2013, MNRAS, 433, 3364
- Hardcastle et al. (2001) Hardcastle M. J., Birkinshaw M., Worrall D. M., 2001, MNRAS, 326, 1499
- Hardcastle & Croston (2005) Hardcastle M. J., Croston J. H., 2005, MNRAS, 363, 649
- Hardcastle & Croston (2011) Hardcastle M. J., Croston J. H., 2011, MNRAS, 415, 133
- Hardcastle et al. (2007) Hardcastle M. J. et al., 2007, ApJ, 670, L81
- Hardcastle & Looney (2008) Hardcastle M. J., Looney L. W., 2008, MNRAS, 388, 176
- Hardcastle et al. (2012) Hardcastle M. J. et al., 2012, MNRAS, 424, 1774
- Hardcastle et al. (1998) Hardcastle M. J., Worrall D. M., Birkinshaw M., 1998, MNRAS, 296, 1098
- Hardcastle et al. (2002) Hardcastle M. J., Worrall D. M., Birkinshaw M., Laing R. A., Bridle A. H., 2002, MNRAS, 334, 182
- Hardcastle et al. (2003) Hardcastle M. J., Worrall D. M., Kraft R. P., Forman W. R., Jones C., Murray S. S., 2003, ApJ, 593, 169
- Harwood et al. (2013) Harwood J. J., Hardcastle M. J., Croston J. H., Goodger J. L., 2013, MNRAS
- Heavens & Meisenheimer (1987) Heavens A. F., Meisenheimer K., 1987, MNRAS, 225, 335
- Heckman et al. (1986) Heckman T. M., Smith E. P., Baum S. A., van Breugel W. J. M., Miley G. K., Illingworth G. D., Bothun G. D., Balick B., 1986, ApJ, 311, 526
- Heesen et al. (2009) Heesen V., Beck R., Krause M., Dettmar R.-J., 2009, A&A, 494, 563
- Heinz et al. (1998) Heinz S., Reynolds C. S., Begelman M. C., 1998, ApJ, 501, 126
- Hota et al. (2009) Hota A., Lim J., Ohyama Y., Saikia D. J., Dihn-v-Trung, Croston J. H., 2009, in Saikia D. J., Green D. A., Gupta Y., Venturi T., eds, ASP Conf. Ser. Vol. 407, The Low-Frequency Radio Universe. Astron. Soc. Pac., San Francisco, p. 104
- Hota et al. (2012) Hota A., Rey S.-C., Kang Y., Kim S., Matsushita S., Chung J., 2012, MNRAS, 422, L38
- Hota & Saikia (2006) Hota A., Saikia D. J., 2006, MNRAS, 371, 945
- Huchra et al. (2012) Huchra J. P. et al., 2012, ApJS, 199, 26
- Hughes (1991) Hughes P. A., 1991, Beams and Jets in Astrophysics. Cambridge University Press, Cambridge, U.K.
- Jaffe & Perola (1973) Jaffe W. J., Perola G. C., 1973, A&A, 26, 423
- Kadler et al. (2004) Kadler M., Kerp J., Ros E., Falcke H., Pogge R. W., Zensus J. A., 2004, A&A, 420, 467
- Kardashev (1962) Kardashev N. S., 1962, SvA, 6, 317
- Kataoka & Stawarz (2005) Kataoka J., Stawarz Ł., 2005, ApJ, 622, 797
- Kataoka et al. (2006) Kataoka J., Stawarz Ł., Aharonian F., Takahara F., Ostrowski M., Edwards P. G., 2006, ApJ, 641, 158
- Kraft et al. (2003) Kraft R. P., Vázquez S. E., Forman W. R., Jones C., Murray S. S., Hardcastle M. J., Worrall D. M., Churazov E., 2003, ApJ, 592, 129
- Kulsrud & Pearce (1969) Kulsrud R., Pearce W. P., 1969, ApJ, 156, 445
- Liu et al. (1992) Liu R., Pooley G., Riley J. M., 1992, MNRAS, 257, 545
- Lu et al. (1993) Lu N. Y., Hoffman G. L., Groff T., Roos T., Lamphier C., 1993, ApJS, 88, 383
- Marscher (1980) Marscher A. P., 1980, ApJ, 235, 386
- Mingo et al. (2011) Mingo B., Hardcastle M. J., Croston J. H., Evans D. A., Hota A., Kharb P., Kraft R. P., 2011, ApJ, 731, 21
- Mingo et al. (2012) Mingo B., Hardcastle M. J., Croston J. H., Evans D. A., Kharb P., Kraft R. P., Lenc E., 2012, ApJ, 758, 95
- Morganti et al. (1988) Morganti R., Fanti R., Gioia I. M., Harris D. E., Parma P., de Ruiter H., 1988, A&A, 189, 11
- Pacholczyk (1970) Pacholczyk A. G., 1970, Radio Astrophysics. Freeman & Co., San Francisco
- Perley & Butler (2013) Perley R. A., Butler B. J., 2013, ApJS, 204, 19
- Perucho & Martí (2007) Perucho M., Martí J. M., 2007, MNRAS, 382, 526
- Rau & Cornwell (2011) Rau U., Cornwell T. J., 2011, A&A, 532, A71
- Rudnick et al. (1994) Rudnick L., Katz-Stone D. M., Anderson M. C., 1994, ApJS, 90, 955
- Rybicki & Lightman (1986) Rybicki G. B., Lightman A. P., 1986, Radiative Processes in Astrophysics. Wiley-VCH, Weinheim, Germany
- Schawinski et al. (2007) Schawinski K., Thomas D., Sarzi M., Maraston C., Kaviraj S., Joo S.-J., Yi S. K., Silk J., 2007, MNRAS, 382, 1415
- Strong et al. (2007) Strong A. W., Moskalenko I. V., Ptuskin V. S., 2007, Annual Review of Nuclear and Particle Science, 57, 285
- Tabatabaei et al. (2013) Tabatabaei F. S., Berkhuijsen E. M., Frick P., Beck R., Schinnerer E., 2013, A&A, 557, A129
- Tribble (1993) Tribble P. C., 1993, MNRAS, 261, 57
- van Breugel & Dey (1993) van Breugel W. J. M., Dey A., 1993, ApJ, 414, 563
- Verdoes Kleijn et al. (1999) Verdoes Kleijn G. A., Baum S. A., de Zeeuw P. T., O’Dea C. P., 1999, AJ, 118, 2592
- Worrall & Birkinshaw (2000) Worrall D. M., Birkinshaw M., 2000, ApJ, 530, 719
This paper has been typeset from a TeX/LaTeXfile prepared by the author.