Star-Formation in the Ultraluminous Infrared Galaxy F00183-7111
Abstract
We report the detection of molecular CO(1-0) gas in F00183-7111, one of the most extreme Ultra-Luminous Infrared Galaxies known, with the Australia Telescope Compact Array. We measure a redshift of 0.3292 for F00183-7111 from the CO(1-0) line and estimate the mass of the molecular gas in 00183 to be 1 1010 M⊙. We find that F00183-7111 is predominately powered by the AGN and only 14 per cent of the total luminosity is contributed by star-formation (SFR 220 M⊙ yr-1).
We also present an optical image of F00183-7111, which shows an extension to the East. We searched for star-formation in this extension using radio continuum observations but do not detect any. This suggests that the star-formation is likely to be predominately nuclear.
These observations provide additional support for a model in which the radio emission from ULIRGs is powered by an intense burst of star-formation and by a radio-loud AGN embedded in its nucleus, both triggered by a merger of gas-rich galaxies.
keywords:
galaxies: active – galaxies: star formation – radio lines: galaxies – radio continuum: galaxies – galaxies: individual: F00183-71111 Introduction
Ultraluminous Infrared galaxies (ULIRGs) are a class of galaxy with a bolometric luminosity (Aaronson & Olszewski 1984; Houck et al. 1985; Allen, Roche, & Norris 1985). They have been attributed to the merger of two gas-rich spirals (Armus, Heckman, & Miley 1987; Sanders et al. 1988; Veilleux et al. 2002; Spoon et al. 2009), which fuels a pre-existing quiescent black hole and also triggers a powerful nuclear starburst. This intense starburst activity generates strong starburst-driven winds (Rupke, Veilleux, & Sanders 2005; Heckman et al. 2000), which will eventually blow away the enshrouding dust and lay bare the quasar core, depleting the dust and gas to form an elliptical galaxy (Dasyra et al. 2006a, b). Leading models suggest that the supermassive black hole grows by accretion while surrounded by a cocoon of dust (e.g. Di Matteo et al. 2005; Hopkins et al. 2005), which is then shed by outflows driven by powerful quasar winds (Balsara & Krolick 1993). This activity ceases when the fuel supply to the central regions is exhausted, and most of the remaining gas is expelled, starving both the active galactic nucleus (AGN) and the star-forming activity.
In the low-redshift Universe, star-formation is dominated by M82-type starburst galaxies, and fewer than 50 ULIRGs are known at . At higher redshifts, ULIRGs are much more common, and dominate the cosmic star-formation rate at (e.g Casey et al. 2012; Magnelli et al. 2013). ULIRGs suffer from many magnitudes of extinction to their nuclei, making it difficult to determine whether their dominant power source is due to an AGN or star-formation activity. Most ULIRGs in the local Universe appear to be powered primarily by a starburst (e.g. Risaliti, Imanishi, & Sani 2010).
IRAS F00183-7111 (also known as IRAS 00182-7112, hereafter 00183) is one of the most luminous ULIRGs known, and lies at a redshift of 0.3276 (Roy & Norris 1997). Its bolometric luminosity is L⊙ (Spoon et al. 2009), most of which is radiated at far-infrared wavelengths. Previous infrared observations (Rigopoulou et al. 1999) and optical observations (Drake et al. 2004) show a disturbed morphology.
00183 contains a strong radio source (108 mJy at 4.8 GHz: Roy & Norris 1997) with a radio luminosity of LW Hz-1, which places it within the regime of high luminosity (FRII-class) radio galaxies. Norris et al. (2012) have obtained VLBI (Very Long Baseline Interferometry) data using the Long Baseline Array (LBA), which shows that 00183 contains a compact radio-loud AGN. The AGN accounts for nearly all of the radio luminosity of 00183, and has compact jets only 1.7 kpc long. The morphology and spectral index are both consistent with Compact Steep Spectrum sources (CSS, O’Dea 1998), which are widely thought to represent an early stage of evolution of radio galaxies (Randall et al. 2011). Norris et al. (2012) argue that these jets are boring through the dense gas and starburst activity that confine them.
This AGN is invisible at optical and near-infrared wavelengths because of the dense dust surrounding it, evidence for which includes the deep 9.7 m silicate absorption feature (Tran et al. 2001; Spoon et al. 2004). However, the AGN is confirmed by the detection of a 6.7 keV FeK line (Fe XXV) with a large equivalent width, indicative of reflected light from a Compton thick AGN (Nandra & Iwasawa 2007).
00183 is believed to have been caught in the brief transition period between merging starburst and radio-loud ‘quasar-mode’ accretion (e.g. Norris et al. 2012). The time-scales of the proposed ULIRG formation sequence are not well understood (e.g. Shabala & Alexander 2009), thus it is necessary to measure the relative contributions by star-formation and AGN to the total power of the ULIRG.
Observations of molecular gas can be used to show how the AGN is interacting with its host star-forming galaxy (e.g. Emonts et al. 2011b; Rupke & Veilleux 2013). Molecular hydrogen (H2) is a key ingredient to forming stars, but unless shocked or heated to very high temperatures, H2 is very difficult to detect due to its strongly forbidden rotational transitions. Fortunately, H2 may be traced by carbon monoxide (CO), which emits strong rotational transition lines that occur primarily through collisions with H2. CO traces the star-formation and is not contaminated by the presence of AGN.
In this Letter we present CO(1-0) observations, new optical observations and 6 and 9.5 GHz radio continuum observations of 00183 in order to study the star-formation within this galaxy. Section 2 describes the observations and data analysis, Section 3 discusses the implications of the CO(1-0) detection and discusses star-formation in 00183 and Section 4 summarises our conclusions.
Throughout this Letter, we assume H0 = 71 km s-1 Mpc-1, M = 0.27 and Λ = 0.73 and we use the web-based calculator of Wright (2006) to estimate the physical parameters.
2 Observations
2.1 CO(1-0)
Radio observations were carried out with the Australia Telescope Compact Array (ATCA, Project ID C2580) to search for CO(1-0) in 00183. The Compact Array Broadband Backend (CABB, Wilson et al. 2011) was used in its coarsest spectral resolution mode with 2 2 GHz of total bandwidth centred at 85.3 and 86.8 GHz, and 1 MHz spectral resolution in two linear polarizations. This corresponds to a velocity resolution of 3.5 km s-1 and an effective velocity coverage of 7000 km s-1. At (Roy & Norris 1997), the optically measured redshift, the redshifted CO(1-0)111 = 115.2712 GHz should be detected at 86.827 GHz.
00183 was observed from 2011 October 02 – 04 in the most compact hybrid H75 array configuration. This resulted in an observing time of 36 hours obtained under good weather, including calibration overheads of 40 per cent.
Initial ATCA calibration, including bandpass calibration, was performed using 1921-293 and two minute scans of the phase calibrator J0103-6439222S 0.59 Jy beam-1 were performed every ten minutes. Flux calibration was performed on Uranus, which was observed at a similar elevation to J0103-6439, in order to ensure we calibrated with the same air mass.
The data were calibrated and imaged using miriad based on the method described in Emonts et al. (2011a). The spatial resolution of the final image is 7.25.8 arcsec (P.A. = 85.9∘). For the data analysis presented here we have binned the data to 8 MHz wide channels, which corresponds to a velocity resolution of 27.6 km s-1.
2.2 Optical Image
A snapshot image of 00183 was obtained with the Focal Plane Imager of the 2dF instrument at the Anglo-Australia Telescope during twilight on 2011 August 23. The seeing was 2.1 arcsec. Four 2 minute dithered observations were combined after registration. Three 2 minute dark frames were used to dark-correct the image as the camera was operating at only 0∘C. The image is taken in a red filter which, when combined with the CCD sensitivity, corresponds broadly to an R+I filter and encompasses the wavelength of rest frame H-alpha emission from 00183.
2.3 6 & 9GHz
Radio continuum observations of 00183 at 6 and 9.5 GHz were carried out with the ATCA (Project ID C2749). The ATCA was used in standard continuum mode with 2 2 GHz of total bandwidth centred at 6 and 9.5 GHz in two linear polarizations.
00183 was observed from 2013 February 24 – 26, in the 6A configuration for a total of 36 hours. This provided 1 arcsec spatial resolution over a field of view of 5 arcmin.
3 Results and Discussion
 |
 |
 |
 |
 |
 |
3.1 CO(1-0) in 00183
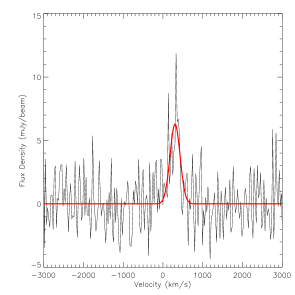
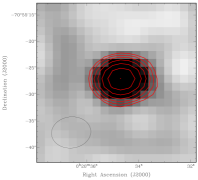
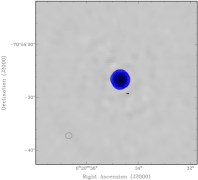
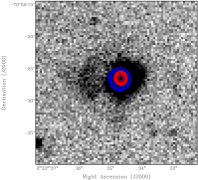
We obtain an unambiguous (7) detection of CO(1-0) in 00183 on top of radio continuum emission (Fig. 1). Both the continuum and line emission are spatially unresolved (Fig. 2, top panels) and the CO(1-0) line detection is coincident with the continuum emission within 1 arcsec. After subtracting S = 2.97 mJy beam-1 of continuum flux density from the spectrum, the CO(1-0) is clearly detected in 00183 at a central frequency of 86.72 GHz, which corresponds to a redshift of 0.3292 (Fig. 1). This implies a velocity difference of +305 km s-1 from the velocity derived from the optical spectrum (Roy & Norris 1997). We note that neither of these is necessarily the systemic velocity, and indeed the systemic velocity in such a chaotic system may be poorly defined. The CO velocity measured here traces the centre of mass of the molecular material. We fit a Gaussian to the spectrum and find that the CO(1-0) detection has a peak flux density of SCO = 6.3 mJy beam-1 and FWHM = 297 km s-1.
The integrated CO(1-0) signal is detected at a 7 level with = 2.32 Jy beam-1km s-1 (Fig. 2, top middle panel). Using Solomon & Vanden Bout (2005), the CO(1-0) luminosity may be calculated using:
| (1) |
where L is expressed in K km s-1 pc2. We calculate L for 00183 to be 1.25 1010 K km s-1 pc2.
We can estimate the mass of the molecular gas in 00183 from the CO(1-0) luminosity by applying the standard conversion factor (K km s-1 pc2)-1 for ULIRGs (Downes & Solomon 1998). We note that the conversion of CO luminosity into molecular gas mass is dependent on the molecular gas conditions, such as its density, temperature and kinetic state (e.g. Glover & Mac Low 2011; Bolatto, Wolfire, & Leroy 2013; Mashian, Sternberg, & Loeb 2013), and we acknowledge that this yields a conservative estimate for the molecular gas mass (e.g. Papadopoulos et al. 2012). Using this conversion factor, we estimate the mass of the molecular gas in 00183 to be 1 1010 M⊙.
We can determine the star-formation rate (SFR) of 00183 using the empirically determined relation between CO luminosity and IR luminosity from the starburst component (e.g. Carilli & Walter 2013):
| (2) |
and
| (3) |
where = 1.8 was used assuming a Salpeter IMF (e.g Kennicutt 1998). From these we calculate a SFR 220 M⊙ yr-1 for 00183.
The bolometric luminosity of 00183 is L8-1000μm = L⊙ (Spoon et al. 2009), most of which is radiated at far-infrared wavelengths. Using Equation 3, this would imply a SFR of 1600 M⊙ yr-1. Moreover, 00183 has a hard X-ray luminosity of L = ergs-1 (Nandra & Iwasawa 2007), which, if assuming 00183 is solely powered by star-formation, would imply a SFR of 12000 M⊙ yr-1.
We know that 00183 harbours a powerful AGN in its core. Norris et al. (2012) have detected and resolved the AGN, which accounts for nearly all of the radio luminosity of 00183. Furthermore, Nandra & Iwasawa (2007) calculate that the AGN accounts for 80 per cent of the total IR luminosity. This is in agreement with previous work by Spoon et al. (2004), who find that star-formation contributes less than 30 per cent of the total IR luminosity. Ranalli, Comastri, & Setti (2003) had previously inferred that 00183 has a SFR of 310 M⊙ yr-1 from soft X-ray data. Consequently our derived SFR of 220 M⊙ yr-1 from the CO(1-0) appears consistent with previous work. This suggests that only 14 per cent of the total power of 00183 is contributed by star-formation. This is particularly interesting as most ULIRGs appear to be powered predominately by star-formation (e.g Genzel et al. 1998; Armus et al. 2007). Veilleux et al. (2009) find that the average AGN contribution to the bolometric luminosity of ULIRGs is 35–40 per cent, and they observe a trend with AGN contribution and merger-stage. It is likely that 00183 is in a late-merger phase where gas and dust has been blown out, decreasing active star-formation, consistent with the scenario proposed by Norris et al. (2012).
Both IR and X-ray star-formation diagnostics may be ‘contaminated’ by AGN. CO is generally a good indicator of star-formation and is not contaminated by AGN. This is particularly true for the ground transition CO(1-0), as it is least affected by potential excitation conditions in the nuclear AGN region. The detection of CO(1-0) has provided the ‘cleanest’ diagnostic yet for the star-formation in 00183.
3.2 Radio Continuum from Star-formation
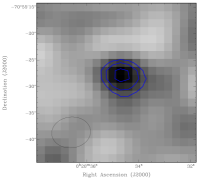
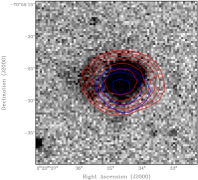
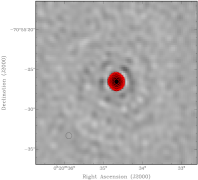
A deep optical image of 00183 was obtained using the AAT (Fig. 2, right-most panels). There appears to be a 5 arcsec extension to the East of the galaxy.
The CO detection is located in the centre of 00183 and appears unresolved, thus it is likely that most of the star-formation is nuclear (within 5 kpc). Nonetheless, we embarked upon a project to determine if there was any strong star-formation in the optical extension. If we assume that 14 per cent of the IR luminosity is due to star-formation, then using the far-infrared radio correlation we can estimate the contribution by star-formation to the radio continuum emission. The 70 m flux density is S70μm = 1.5 Jy, 14 per cent of which is 0.21 Jy. Using q70 = 2.15 (Appleton et al. 2004), we would then expect to detect 1.5 mJy at 1.4 GHz of radio continuum that is due to star-formation. Assuming =-0.97 (Drake et al. 2004)333Spectral index is defined as S ., this corresponds to SJy and SJy.
Fig. 2 (bottom panels) shows the radio continuum images of 00183 at 6 GHz and 9.5 GHz. As these data were obtained in a single telescope configuration, 6A, there are some gaps in the uv-plane, which have caused imaging artefacts to be present in the immediate vicinity of the bright source. As such, while the rms at both frequencies is 6 Jy beam-1 throughout most of the image, the rms increases to 20 Jy beam-1 next to 00183. At both these frequencies 00183 appears unresolved down to an rms of 20 Jy beam-1 with S = 81.7 mJy beam-1 and S = 45.6 mJy beam-1. This corresponds to a , which is consistent with measured by Drake et al. (2004).
We measure an upper limit of SJy to the radio continuum at the location of the optical extension and calculate an upper limit to the SFR in this region as 60 M⊙ yr-1. The unresolved radio detection suggests that the star-formation is likely to be nuclear and the lack of extended radio emission rules out the possibility of vast amounts of star-formation occurring outside of the nucleus.
4 Conclusions
00183, one of the most luminous ULIRGs known, is believed to have been caught in the brief transition period between merging starburst and ‘quasar-mode’ accretion. We have detected CO(1-0) in 00183 implying a SFR of 220 M⊙ yr-1, which is consistent with previous estimates based on infrared and X-ray diagnostics. This suggests that only 14 per cent of the total power of the source is contributed by star-formation.
The powerful AGN that dominates the power of 00183 is believed to be a very young quasar that has only just turned on and is in the process of quenching and turning off the star-formation in this ULIRG. These results provide additional support for a model in which ULIRGs are powered by star-formation and AGN activity, both of which are triggered by a merger of gas-rich galaxies.
Acknowledgements
We thank the staff at the ATCA and the AAO (especially Steve Lee!) for making these observations possible. We also thank our Referee, Joan Wrobel, Chris Carilli and Juergen Ott for their helpful comments. The ATCA is part of the ATNF, which is funded by the Commonwealth of Australia for operation as a National Facility managed by CSIRO. This research has also made use of NASA’s Astrophysics Data System. The Centre for All-sky Astrophysics (CAASTRO) is an Australian Research Council Centre of Excellence, funded by grant CE110001020.
References
- Aaronson & Olszewski (1984) Aaronson, M., & Olszewski, E. W., 1984, Nature, 309, 414
- Allen, Roche, & Norris (1985) Allen, D. A, Roche, P. F. & Norris, R. P., 1985, MNRAS, 213, 67P
- Appleton et al. (2004) Appleton P. N., et al., 2004, ApJS, 154, 147
- Armus, Heckman, & Miley (1987) Armus, L., Heckman, T., & Miley, G., 1987, AJ, 94, 83
- Armus et al. (2007) Armus L., et al., 2007, ApJ, 656, 148
- Balsara & Krolick (1993) Balsara, D. S., & Krolik, J. H. 1993, ApJ, 402, 109
- Bolatto, Wolfire, & Leroy (2013) Bolatto A. D., Wolfire M., Leroy A. K., 2013, ARA&A, 51, 207
- Carilli & Walter (2013) Carilli C. L., Walter F., 2013, ARA&A, 51, 105
- Casey et al. (2012) Casey C. M., et al., 2012, ApJ, 761, 140
- Dasyra et al. (2006a) Dasyra, K. M., et al. 2006, ApJ, 638, 745
- Dasyra et al. (2006b) Dasyra, K. M., et al. 2006, ApJ, 651, 835
- Downes & Solomon (1998) Downes D., Solomon P. M., 1998, ApJ, 507, 615
- Drake et al. (2004) Drake, C. L., McGregor, P. J., & Dopita, M. A. 2004, AJ, 128, 955
- Di Matteo et al. (2005) Di Matteo, T., Springel, V., & Hernquist, L. 2005, Nature, 433, 604
- Emonts et al. (2011a) Emonts B. H. C., et al., 2011, MNRAS, 415, 655
- Emonts et al. (2011b) Emonts B. H. C., et al., 2011, ApJ, 734, L25
- Genzel et al. (1998) Genzel R., et al., 1998, ApJ, 498, 579
- Glover & Mac Low (2011) Glover S. C. O., Mac Low M.-M., 2011, MNRAS, 412, 337
- Heckman et al. (2000) Heckman T. M., Lehnert M. D., Strickland D. K., Armus L., 2000, ApJS, 129, 493
- Hopkins et al. (2005) Hopkins P. F., Hernquist L., Cox T. J., Di Matteo T., Martini P., Robertson B., Springel V., 2005, ApJ, 630, 705
- Houck et al. (1985) Houck, J. R., Schneider, D. P., Danielson, G. E., Neugebauer, G., Soifer, B. T., Beichman, C. A., & Lonsdale, C. J. 1985, ApJL, 290, L5
- Kennicutt (1998) Kennicutt R. C., Jr., 1998, ApJ, 498, 541
- Magnelli et al. (2013) Magnelli B., et al., 2013, A&A, 553, A132
- Mashian, Sternberg, & Loeb (2013) Mashian N., Sternberg A., Loeb A., 2013, MNRAS, 435, 2407
- Nandra & Iwasawa (2007) Nandra, K., & Iwasawa, K. 2007, MNRAS, 382, L1
- Norris et al. (2012) Norris R. P., Lenc E., Roy A. L., Spoon H., 2012, MNRAS, 422, 1453
- Papadopoulos et al. (2012) Papadopoulos P. P., van der Werf P., Xilouris E., Isaak K. G., Gao Y., 2012, ApJ, 751, 10
- O’Dea (1998) O’Dea C. P., 1998, PASP, 110, 493
- Ranalli, Comastri, & Setti (2003) Ranalli P., Comastri A., Setti G., 2003, A&A, 399, 39
- Randall et al. (2011) Randall K. E., Hopkins A. M., Norris R. P., Edwards P. G., 2011, MNRAS, 416, 1135
- Rigopoulou et al. (1999) Rigopoulou, D., Spoon, H. W. W., Genzel, R., Lutz, D., Moorwood, A. F. M., & Tran, Q. D. 1999, AJ, 118, 2625
- Risaliti, Imanishi, & Sani (2010) Risaliti G., Imanishi M., Sani E., 2010, MNRAS, 401, 197
- Roy & Norris (1997) Roy, A. L. & Norris, R. P., 1997, MNRAS, 289, 824
- Rupke, Veilleux, & Sanders (2005) Rupke D. S., Veilleux S., Sanders D. B., 2005, ApJS, 160, 87
- Rupke & Veilleux (2013) Rupke D. S. N., Veilleux S., 2013, ApJ, 775, L15
- Sanders et al. (1988) Sanders, D. B., Soifer, B. T., Elias, J. H., Madore, B. F., Matthews, K., Neugebauer, G., & Scoville, N. Z. 1988, ApJ, 325, 74
- Shabala & Alexander (2009) Shabala S., Alexander P., 2009, ApJ, 699, 525
- Solomon & Vanden Bout (2005) Solomon P. M., Vanden Bout P. A., 2005, ARA&A, 43, 677
- Spoon et al. (2004) Spoon, H. W. W., et al. 2004, ApJS, 154, 184
- Spoon et al. (2009) Spoon, H. W. W., Armus, L., Marshall, J. A., Bernard-Salas, J., Farrah, D., Charmandaris, V., & Kent, B. R. 2009, ApJ, 693, 1223
- Tran et al. (2001) Tran, Q. D., et al. 2001, ApJ, 552, 527
- Veilleux et al. (2002) Veilleux, S., Kim, D.-C., & Sanders, D. B. 2002, ApJS, 143, 315
- Veilleux et al. (2009) Veilleux S., et al., 2009, ApJS, 182, 628
- Wilson et al. (2011) Wilson W. E., et al., 2011, MNRAS, 416, 832
- Wright (2006) Wright E. L., 2006, PASP, 118, 1711