A Panchromatic Survey of Post-starburst Mergers: searching for feedback
Abstract
We consider the morphology, stellar populations, structure and AGN activity of 10 post-starburst (K+A) galaxies with HST observations, full spectral coverage in the optical, spectral energy distributions from 0.2 to 160 m, X-ray and radio data. Our results show that the PSG phenomenon is related to mergers and interactions, and that star formation was likely triggered during close passes prior to final coalescence. We performed a detailed qualitative analysis of the observed light distribution, including low-surface brightness tidal features and color profiles, in high-resolution multi-band imaging with HST. We find evidence that star formation was centrally concentrated and that quenching took place from the inside-out, consistent with the occurrence of a feedback episode. Most of our PSGs contain massive bulges and therefore should host supermassive black holes. We search for AGN activity in spectra (line ratios), optical variability, X-ray emission at 0.5–7.0 KeV and radio emission at 20cm: all four lines of evidence show there is no active AGN accreting at more than 0.1% of the Eddington luminosity. We conclude that mergers may be a necessary, but not a sufficient condition, for AGN activity and that they are not likely to be important in our objects. If PSGs are good test cases for quenching and evolution to the red sequence, AGNs may play a smaller role than expected.
keywords:
Galaxies: interactions — Galaxies: quasars1 Introduction
Post-starburst galaxies (hereafter PSGs, sometimes called E+A or K+A galaxies from their distinctive spectral signatures) are observed shortly ( Gyr) after a significant episode of star formation but show no evidence that they are currently forming new stars (Du et al., 2010; Shin et al., 2011; Nielsen et al., 2012; Melnick & De Propris, 2013). These galaxies are the best local examples of systems observed crossing the ’green valley’ between the two main groupings of galaxies in colour space (the so-called blue cloud and red sequence) and may allow us to understand how star formation is started and terminated in galaxies and thus provide a clue to the origin of the persistent bimodality in galaxy colours (Strateva et al., 2001; Baldry et al., 2004; Wetzel et al, 2012).
Simulations indicate that PSGs may be produced in mergers between gas-rich progenitors (Bekki et al., 2005; Wild et al., 2009; Snyder et al., 2011). Observations support the view that mergers and interactions have played an important role in these galaxies: Zabludoff et al. (1996) found that 5 of the 21 PSGs in the Las Campanas Redshift Survey were morphologically disturbed, while investigation of these objects with the Hubble Space Telescope (HST) by Yang et al. (2008) showed that all were interacting or had undergone mergers. Goto (2005) argued that 1/3 of all PSGs in the Sloan Digital Sky Survey presented tidal tails or bright compact nuclei, indicative of current and recent mergers or interactions, while Yamauchi et al. (2008) calculated that PSGs are half again as likely to have a companion than a comparison sample of more normal (spectroscopically) galaxies. Although other mechanisms, such as ram stripping, are possible, especially in cluster environments (Ma et al., 2008; Yoshida et al., 2008; Wu et al., 2013), Nolan et al. (2007) conclude that a merger/interaction channel must be the dominant pathway involved in the formation of PSGs (as do Wu et al. 2013 in their analysis of PSGs in a supercluster).
Mergers and interactions are expected to drive gas and dust towards the nuclear regions of galaxies, where collisions and shocks induce star formation (Hernquist, 1989; Joseph & Wright, 1995; Barnes & Hernquist, 1996; Hopkins et al., 2009). Many of the PSGs observed Yang et al. (2008) are seen to have positive colour gradients (i.e., bluer inward) or blue cores, unlike the mild negative gradients observed in normal galaxies (La Barbera et al., 2010). Pracy et al. (2005, 2012, 2013) and Goto et al. (2008a) also found gradients in Hδ absorption in integral field spectroscopy of PSGs, indicative of centrally concentrared star formation, supporting a scenario where star formation took place mostly in galaxy cores and these objects are now observed in an early post-merger stage.
We also expect that mergers contribute to the growth of bulges (e.g., Toomre 1977; Zavala et al. 2012 and references therein) and that bulge growth signals or induces quenching of star formation (McGee et al., 2011; Bell et al., 2012). In agreement with this, many PSGs have important bulge components (Quintero et al., 2004; Yang et al., 2008). We therefore expect that PSGs also host supermassive black holes in their cores (Antonucci, 1993; Kormendy & Richstone, 1995). This may provide a mechanism for the rapid cessation of star formation in these galaxies (Kaviraj et al., 2007; Choi et al., 2009; Melnick & De Propris, 2013) via ’feedback’ from the onset of AGN activity (Springel et al., 2005). In the scenario for co-evolution of black holes and galaxies described by Hopkins et al. (2008a, b), each galaxy undergoes a series of mergers, which induce starbursts that are subsequently quenched by AGNs, with the remnant settling on the red sequence. PSGs closely resemble some of the intermediate evolutionary phases in these models, where AGN activity reaches its peak at or closely after the epoch of close approach or final coalescence.
However, Shin et al. (2011) and Nielsen et al. (2012) find little evidence of 20cm emission in PSGs from the Goto (2007) sample at levels inconsistent with the presence of star formation or AGNs. Liu et al. (2007) discovered evidence of a weak AGN in a nearby PSG. Georgakakis et al. (2008) argued for the presence of AGNs in at least some PSGs, while Brown et al. (2009) find that they are only important for rather massive systems (). Wild et al. (2009) do not detect evidence that AGN feedback has been important in their sample of PSGs, while Wong et al. (2012) find only 2 LINERS (not necessarily AGNs) in their sample of 80 local PSGs. In our previous paper (Melnick & De Propris, 2013) we used line ratios from SDSS spectra for 808 PSGs and could not find convincing evidence for even weak AGNs. On the other hand, Tremonti et al. (2007) measured powerful outflows from 10 of their 14 PSGs, but Coil et al. (2011) showed that these do not need to be powered by AGNs.
Here we study a sample of 10 nearby K+As observed in several stages of the merger process. We use spectra and photometry to reconstruct their star formation history. We examine deep Hubble Space Telescope (HST) images of these galaxies to identify tidal features and set limits to their merging activity. We use these deep, high-resolution images to study the distribution of stellar populations, placing our galaxies on an approximate sequence joining merger stage and star formation history. We then search for QSO activity in our objects from the optical, radio and X-rays.
The following section describes the dataset and its properties. We comment on morphologies and colour gradients in section 3. The stellar populations are analysed in section 4 and the X-ray properties in section 5. We discuss these results in the light of the above models for AGN feedback in section 6. We adopt the conventional cosmology from the latest results of the WMAP 9 year analysis (Hinshaw et al., 2013).
2 Dataset and Analysis
We have selected galaxies from our original sample of PSGs in Melnick & De Propris (2013), which is largely based on the PSGs selected by Goto (2007). These are chosen from the SDSS DR7 with the conventional definition of a PSG, with equivalent widths of Å, Å, and Å (emission lines are negative). Apart from SDSS spectroscopy and optical photometry (York et al., 2000; Abazajian et al., 2009), all these galaxies had FUV (1300 Å) and NUV (2300 Å) photometry from the All-Sky, Medium and Deep Imaging Surveys on the GALEX telescope (Morrissey et al., 2007) as well as infrared () data from either the 2 Micron All Sky Survey (Skrutskie et al., 2006) and the latest data release of the UKIDSS survey111The UKIDSS project is defined in Lawrence et al (2007). UKIDSS uses the UKIRT Wide Field Camera (WFCAM; Casali et al. 2007). The photometric system is described in Hewett et al. (2006), and the calibration is described in Hodgkin et al. (2009). The pipeline processing and science archive are described in Irwin et al (2009, in prep) and Hambly et al (2008), which explicitly targets the DR7 footprint. Mid-infrared imaging at 3.4, 4.5, 12.0 and 22.0 m is provided by the WISE survey (Wright et al., 2010). All objects are also within the Faint Images of the Radio Sky at 20cm survey (FIRST – Becker et al. 1995).
One of our aims here is to use high quality (possibly multicolour) imaging to study the morphologies of PSGs, identify merger signatures and analyse the distribution of the younger stellar populations. We searched the HST archive and found 8 galaxies with imaging in at least two colours ( and , with one having also ) from Program 11643 (PI: Zabludoff).
We also searched the archives for X-ray imaging. This is useful to check for the presence of AGN activity in an unbiased fashion, which is widely believed to be related to quenching and feedback in galaxy formation models. All of the 8 galaxies with HST imaging plus two more have X-ray data from the ACIS-I camera on board the Chandra X-ray telescope. We chose this as our final sample of objects, as it spanned the widest range in luminosities and was mosu suitable for our purposes.
We then searched the archives for further pointed observations of these objects and found Spitzer imaging at 3.6, 4.5, 6.7 and 8.0 m from IRAC and data at 24, 70 and 160 m from MIPS in the Spitzer Heritage Archive. The main properties of these 10 objects are shown in Table 1, showing that they span a comparatively wide range of luminosities, stellar masses and internal velocity dispersions, consistent with moderately massive galaxies. Here, internal velocity dispersions are provided by the SDSS, while morphologies are taken from Huertas-Company et al. (2011): stellar masses were calculated in Melnick & De Propris (2013) as part of our analysis.
| RA (2000) | Dec (2000) | SDSS (AB) | Redshift | Morphology | (km s-1) | |
|---|---|---|---|---|---|---|
| 00 44 59.23 | 53 23.0 | 13.72 | 0.0194 | 10.1 | S0 | |
| 03 16 54.89 | 02 31.2 | 14.92 | 0.0232 | 10.0 | S0 | |
| 08 27 01.39 | +21 42 24.4 | 13.89 | 0.0154 | 10.0 | Sab | |
| 09 03 32.77 | +01 12 36.4 | 16.23 | 0.0580 | 10.2 | Scd | |
| 09 44 26.95 | +04 29 56.8 | 15.35 | 0.0467 | 10.5 | E | |
| 12 39 36.03 | +12 26 20.0 | 14.55 | 0.0409 | 10.3 | S0 | |
| 13 05 25.82 | +53 35 30.3 | 14.40 | 0.0380 | 10.5 | E/S0 | |
| 16 13 30.18 | +51 03 35.6 | 15.54 | 0.0338 | 8.7 | Amorphous | … |
| 16 27 02.55 | +43 28 33.9 | 14.45 | 0.0462 | 10.5 | E | |
| 22 55 06.80 | +00 58 40.0 | 14.91 | 0.0532 | 10.5 | E |
We discuss the appearance and colour gradients of these objects in detail below. These are generally early-type galaxies (mostly E/S0 with some early-type spirals), having luminosities and stellar masses typical of approximately galaxies (McMillan 2011 estimates the Milky Way stellar mass at ) and colours between the blue cloud and red sequence. The images show that our galaxies are observed in various stages of interactions: from close pairs (SDSS J0903+0112 and SDSS 1613+5103, where the latter has prominent tidal features), to obviously disturbed merger remnants (SDSS J0944+0429, J1239+1226, J1627+4328, 2255+0058) and comparatively relaxed galaxies such as SDSS J0316–0002, J0827+2142 and 1305+5335 (and possibly J0044–0853). Many of these systems are visibly asymmetric and show prominent, high surface brightness features such as shells and tails, visible even in the shallow SDSS images. Simulations by Conselice (2006) on the evolution of galaxy asymmetries as a function of time, indicate that these galaxies must have interacted or merged within the last Myr.
3 Morphologies and Colours
For all galaxies with HST data, we examine the images in detail, derive the -band surface brightness profile and the colour distribution as a function of radius (for SDSS J1613+5103 we also consider the radial profile as well), and model them with a single Sersic profile using the GALFIT software (Peng et al., 2002, 2010). We also examine the residuals after the smooth model is subtracted. All derived parameters are tabulated in Table 2. Given the complexity of most of these objects, not all residual maps are fully satisfactory, but it is difficult to model such asymmetric and amorphous galaxies and achieve perfect subtraction.


SDSS J0044–0853 We do not have HST imaging for this object, but the available SDSS data shows a comparatively normal early-type galaxy, with little evidence of morphological disturbance.
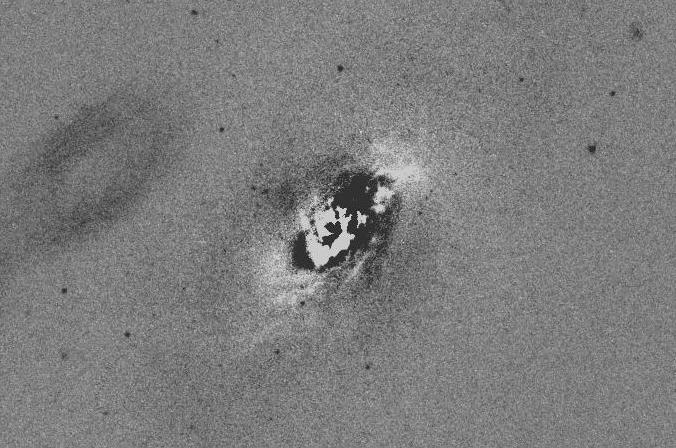
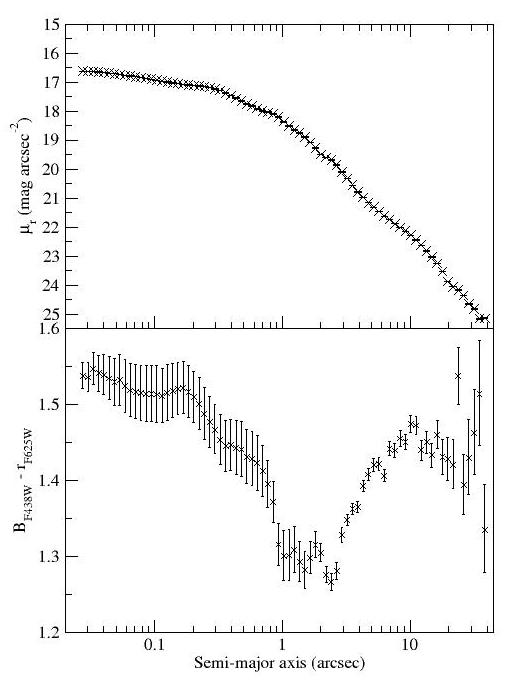
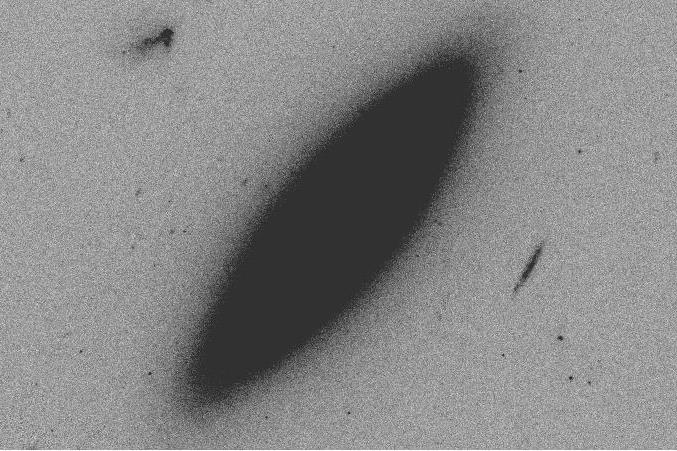
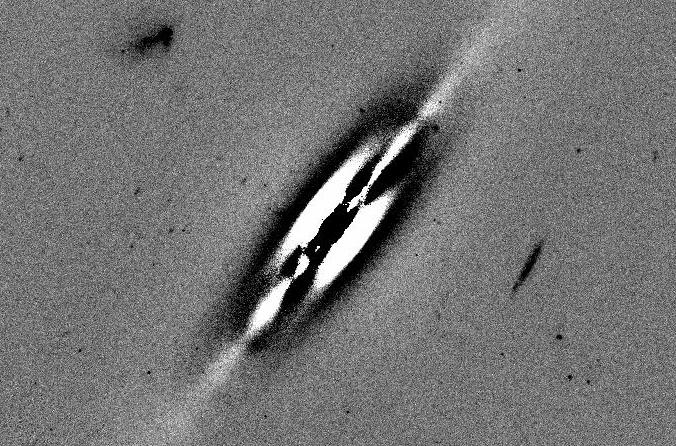
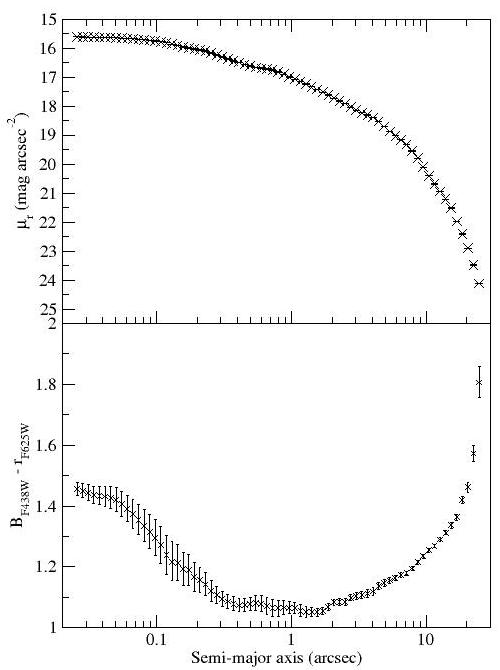
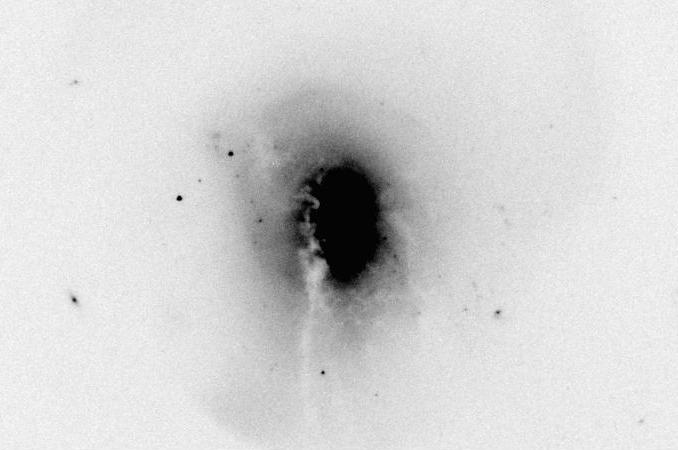
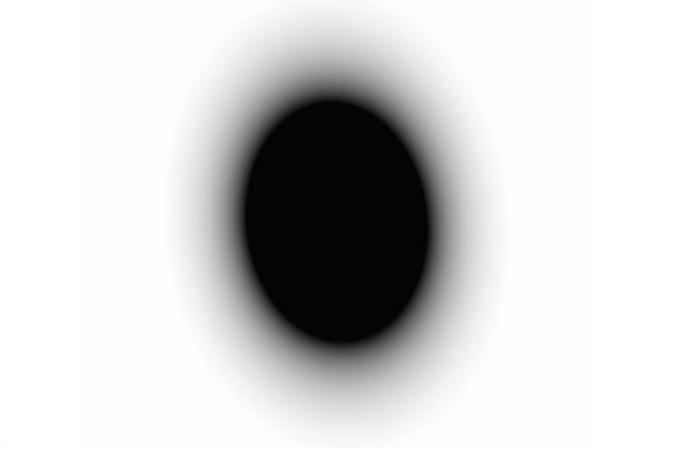
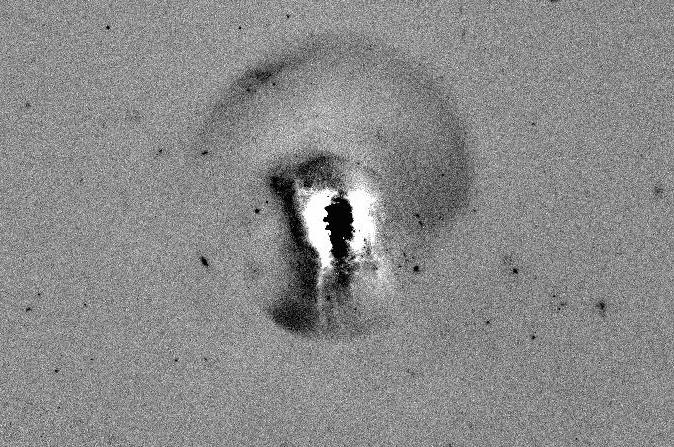
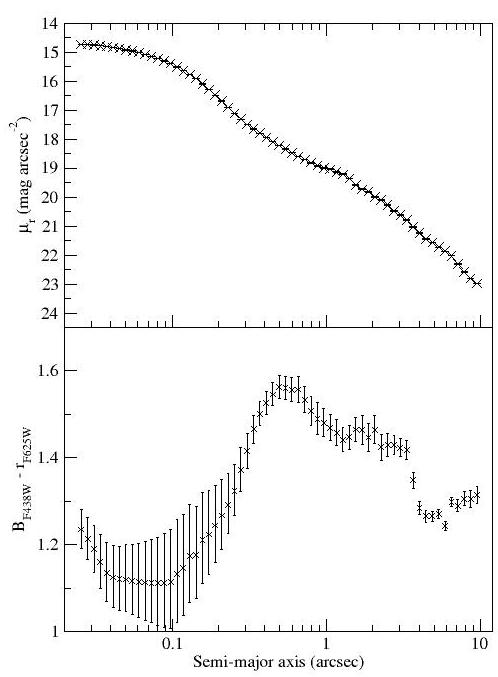
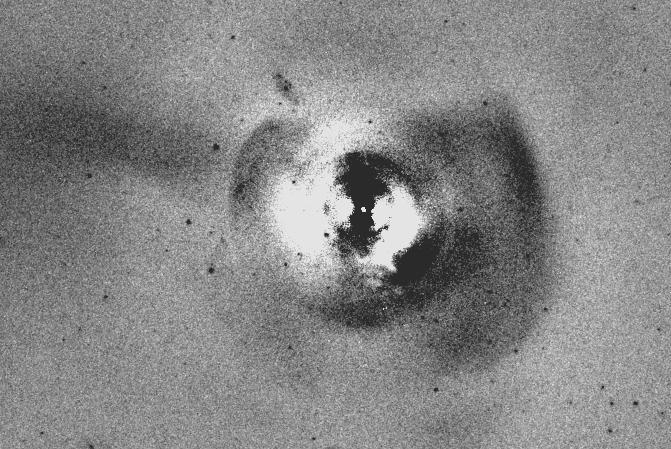
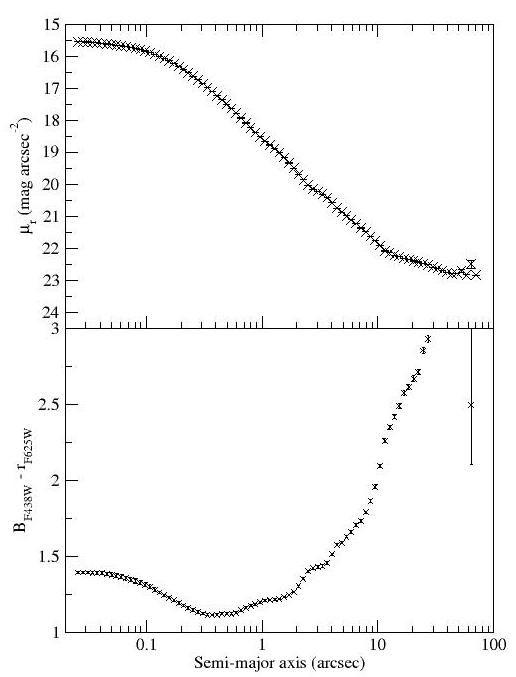
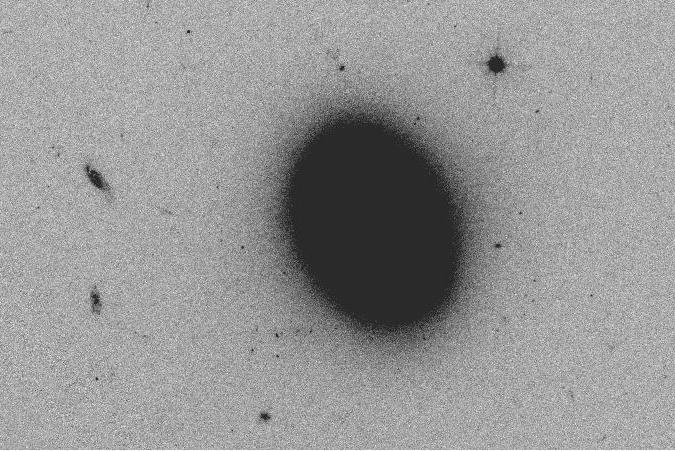
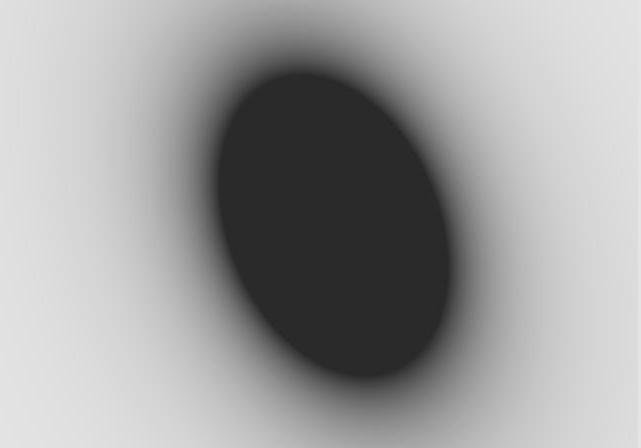
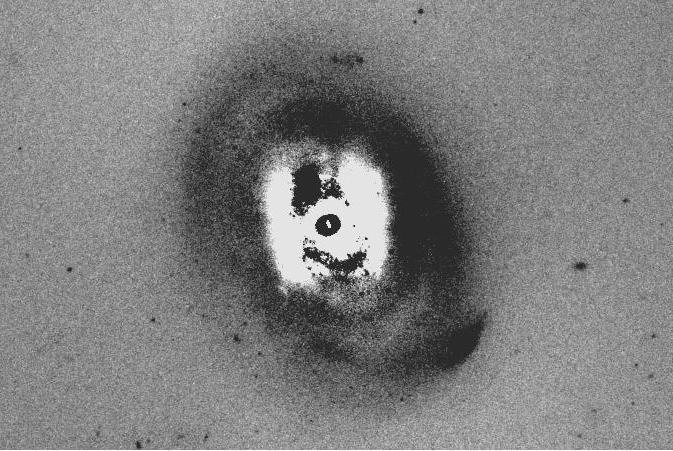
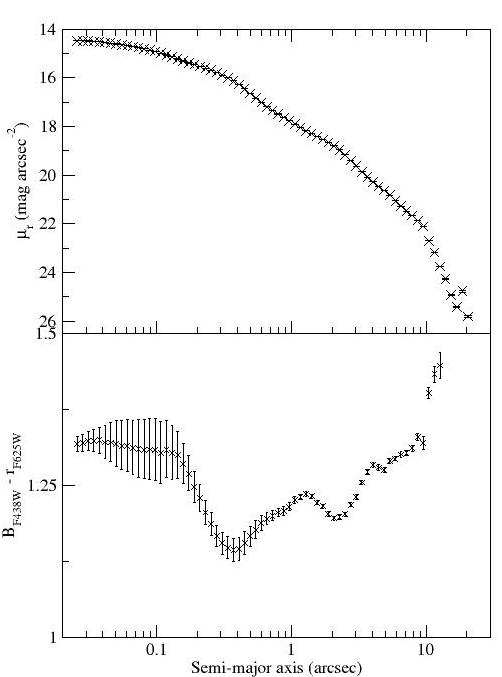
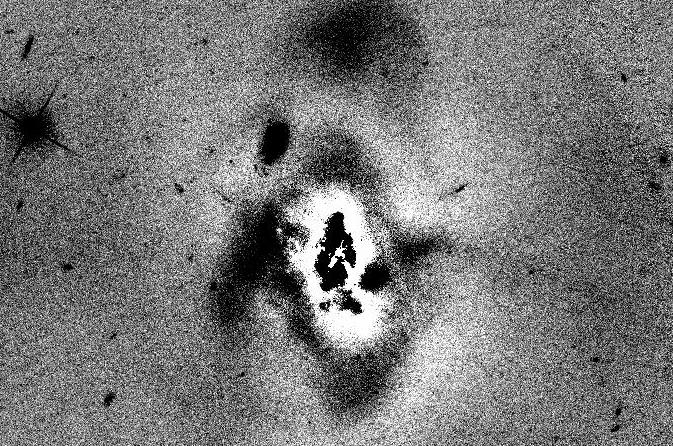
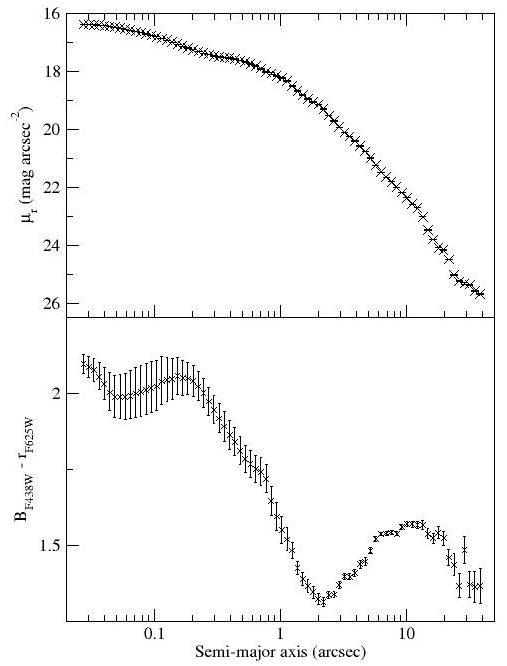
SDSS J0316–0002 In the SDSS and HST imaging this object (Markarian 1074) appears as a normal early-type spiral. However, in the core region we observe a bright central nucleus and an internal dusty spiral (Fig. 1). After removal of the GALFIT model, the residual image (also shown in Fig. 1) shows weak spiral structures and the complex central features we have remarked upon. The core is actually red, but it becomes rapidly bluer out to (Fig. 2 and afterwards the colour reddens out to . Positive colour gradients are typical of PSGs (Yang et al., 2008). The rapid blueing in the inner is probably due to young stellar populations: keeping in mind the dustiness of the core, this may imply that star formation was quenched outward. We plot similar figures for all other galaxies in the study in the on-line Appendix.
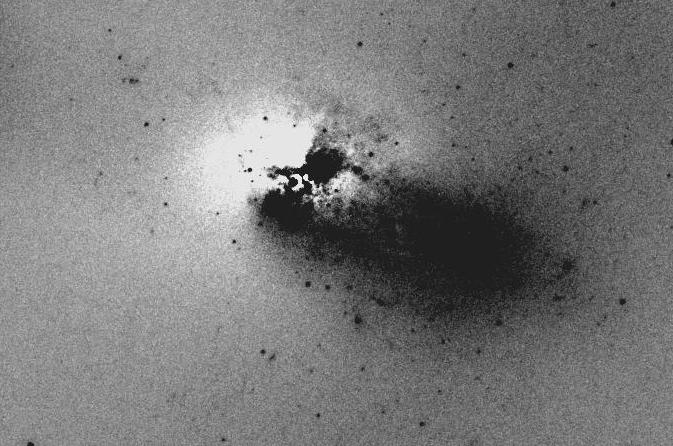
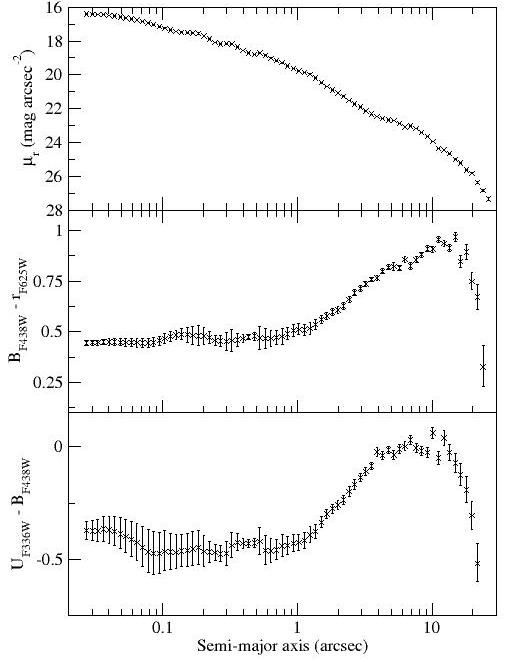
SDSS J0827+2142 This galaxy appears to be an edge-on S0/a. The inner region contains a bright nucleus and evidence of a dust lane. This is also seen in the residuals of the GALFIT model (Fig. 10). As with J0316–0002, the core of the galaxy is red but it becomes rapidly blue out to and is then positive (reddening outwards) beyond (Fig. 11).
SDSS J0903+0112 We also do not have HST images for this object. However, the SDSS data show a very close pair of galaxies, with what may be a tidal envelope or large tail. This appears to be an imminent merger, with luminosity ratio of . The brighter galaxy is the PSG, while the fainter object is quiescent. This suggests that an increase in star formation has been triggered by the interaction from pre-existing gas.
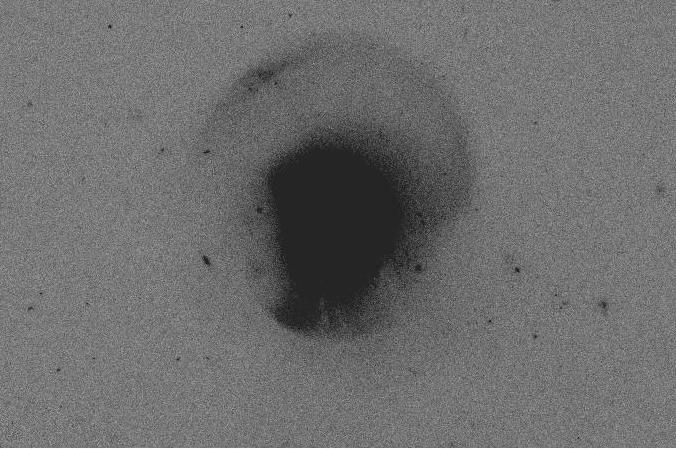
SDSS J0944+0429 An obvious merger remnant, with a large shell, a plume and numerous dust lanes, resembling Cen A in structure. The GALFIT model removes the smooth structure and allows us to better see the high surface brightness residuals due to the merger (Fig. 12), including a bright central cusp. This galaxy has a very blue core, reddening outwards in the inner and then resuming a more normal blueing (negative gradient) trend out to , although the inner may be slightly redder (Fig. 13); interpretation of these trends may be complicated by the dust lanes, but they are consistent with recent star formation in the centre and outward quenching. The outer regions may be dominated by the shell structure or the previous (negative) gradients of the host galaxy.
SDSS J1239+1226 An obvious merger remnant with prominent shells and plumes. The main body of the galaxy has somewhat boxy isophotes. We also see a bright central nucleus. GALFIT subtracts the smooth component well, revealing more detail in the tidal features (Fig. 14. There are several point sources which are likely super star clusters (Yang et al., 2008). The inner of this galaxy are red, with a rapid blueing out to , similar to J0316–0002; the colour gradient out to is positive, becoming rapidly red outwards (Fig. 15).
SDSS J1305+5330 A more normal object (Markarian 239), it does not seem to have a compact nucleus. Models and residuals show evidence of weak spiral arms and possibly a small central bar (Fig. 16). As with J1239+1226, this galaxy has an inner red core, blueing out to and then a positive gradient outwards, with several features probably due to the spiral arms (Fig. 17).
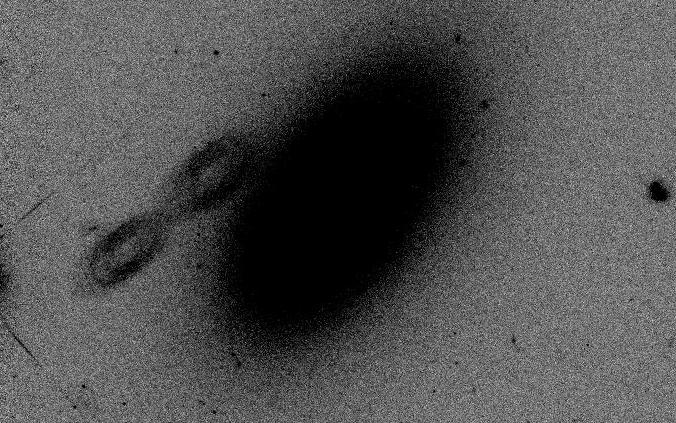
SDSS J1613+5103 A prominent interacting pair, already studied in detail by Yagi et al. (2006) and Goto et al. (2008b). The PSG has an amorphous morphology, with a large tidal plume and a faint bridge connecting it to the brighter (and quiescent) galaxy, which is also tidally disturbed. Fig. 18 shows that the PSG hosts numerous super star-clusters, many of which appear to be along ’jets’ emerging from the PSG core. We discuss these below. GALFIT does not return a useable fit to the galaxy light, although it seems to indicate a very high Sersic index consistent with a bulge-dominated object or peaked light distribution. The core of this object is very blue (Fig. 19), although the inner are somewhat redder in . There is a flat gradient indicating a homogeneously young population in the inner followed by a postive gradient (red outwards) to . This is consistent with a central starburst. Goto et al. (2008a) argues that star formation in this galaxy must have proceeded somewhat longer in its outskirts and be quenched from the core out, which is broadly consistent with the colour gradients derived from our higher resolution data.
SDSS J1627+4328 Fig. 20 shows this galaxy to be a highly disturbed galaxy, with numerous tidal arcs, shells, plumes and fans. There is a bright central nucleus surrounded by shell and dust lanes. The GALFIT profile models this galaxy well and reveals numerous more low surface brightness features. The galaxy has a red core in Fig. 21 that becomes rapidly blue to (as in J0316–0002 and other galaxies). The gradient to is positive as in many other PSGs in this and other samples.
SDSS J2255+0058 There is an obvious large shell surrounding this galaxy in Fig. 22 as well as a tidal cloud and two ’jets’ emerging from the core and containing super star clusters. The GALFIT residual images reveal a rich ensemble of tidal streams and arcs. This is the only one of our objects with a detection in the Chandra Source Catalog (Evans et al., 2010): see below for a study of the X-ray properties of our galaxies. There is a blue core in Fig. 23, although it may become somewhat redder in the inner . At large radii the gradient is again positive which is consistent with previous work and other galaxies in this sample.
| Object | Model (AB) | (arcsec) | |
|---|---|---|---|
| J004453 | … | … | … |
| J031602 | |||
| J0827+2142 | |||
| J0903+0112 | … | … | … |
| J0944+0429 | |||
| J1239+1226 | |||
| J1305+5335 | |||
| J1613+5103 | … | … | … |
| J1627+4328 | |||
| J2255+0058 |
4 Stellar Populations
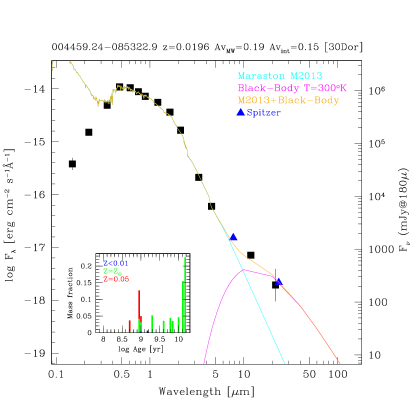
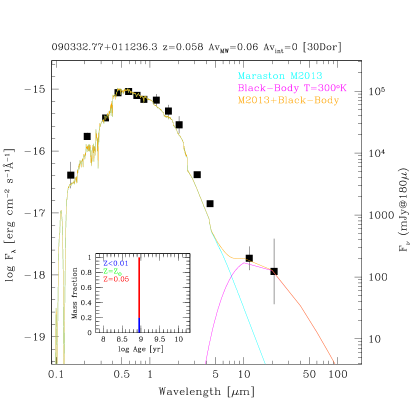
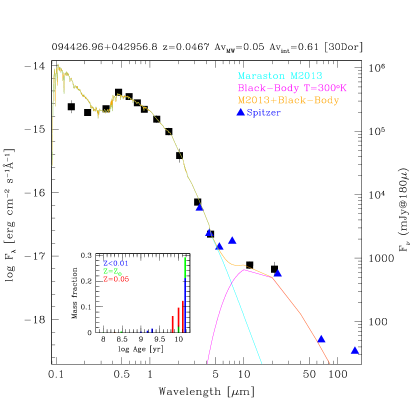
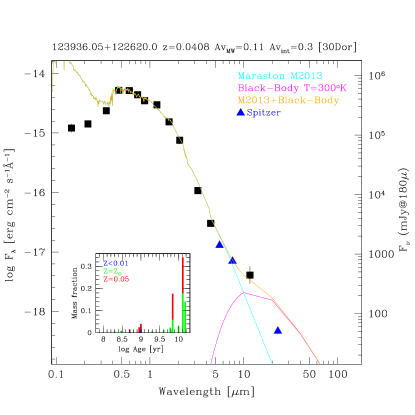
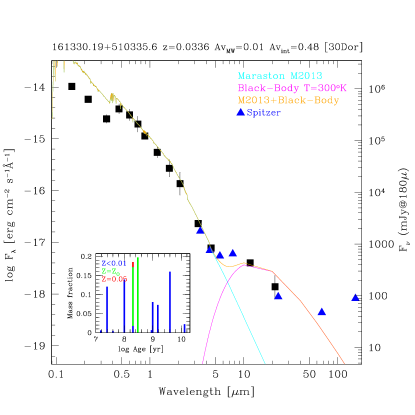
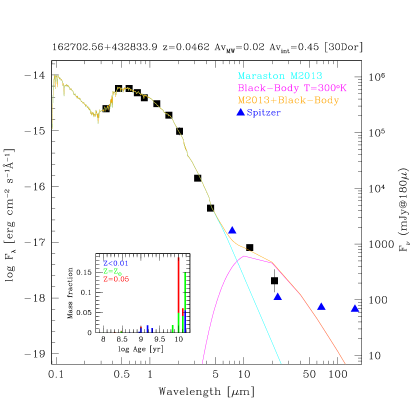
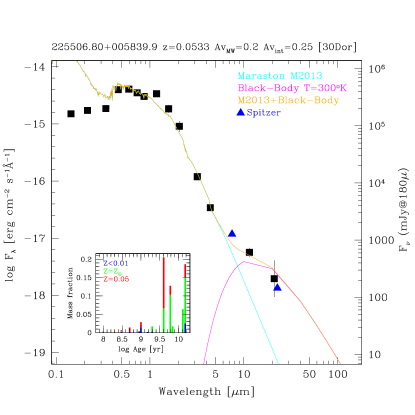
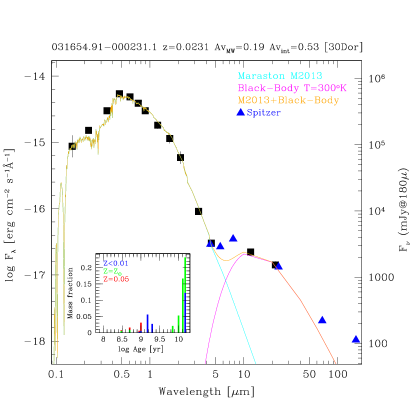
We have modelled the SDSS spectra with Starlight (Cid Fernandes et al., 2005) to reconstruct the star formation history of these objects. This uses the latest version of the Bruzual & Charlot (2003) spectral library with 24 age and 5 metal abundance bins. The star-formation histories resulting from the Starlight models were then used to construct synthetic Spectral Energy Distributions (SED) using the latest version of the Maraston (2005) models – M2013 – as described in Noel et al. (2013) and Melnick & De Propris (2014). We compare the synthetic SEDs, for which the only free parameter is the photometric zero-point, anchored to the SDSS -band, with the available photometry from 0.2 to 160 m. Fig. 3 shows the results of this process for J0316–0002; similar figures for all other galaxies can be found in the Appendix. In each of these figures an inset shows the star-formation histories of each galaxy from Starlight for three broad metallicity bins (centred on 1/2 solar, solar and twice solar abundance)
Figure 3 illustrates that the updated Maraston (2005) models yield a very good fit to the spectral energy distributions, from the to the m bands probing stellar emission, but not always in the FUV and NUV Galex bands. At m we observe an excess above the stellar blackbody tail, consistent with the presence of two dust components: the warm component at K discussed above and a much colder component responsible for the flux at m detected by Spitzer. The warm component is likely heated by the young stellar populations and Asymptotic Giant Branch stars (Chisari & Kelson, 2012) which also power LINER emission as well. Maraston (2005) does not model explicitly dust emission from AGB stars so the discrepancy is not surprising. Despite the poor resolution of mid-infrared data, most objects are reasonably well resolved in WISE or Spitzer images, so that no central point source appears to be responsible for the m emission. Our mid-infrared fluxes are generally lower than those of weak AGNs or starburst galaxies in the sample by Lutz et al. (2004).
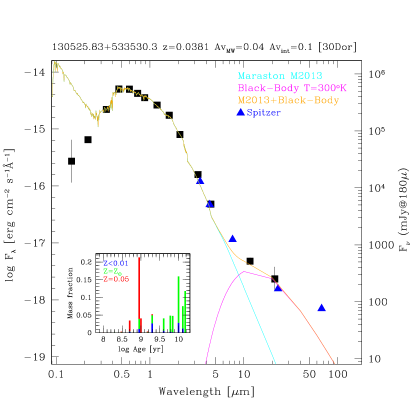
However, we also see that, on the basis of the stellar populations derived from the spectra – within the Sloan fiber aperture – the models conspicuously over-predict the spectral energy distribution in the NUV and FUV, often by large factors. As an example we show below the SED for J1305+5335 in Fig. 4, which shows a dramatic deficit in UV flux compared to the models fitted to the optical and the spectra. This is difficult to explain even for dramatically different extinction curves in the far ultraviolet. We generally do not see this excess for our large sample of PSGs (at a higher mean redshift) discussed in Melnick & De Propris (2013). One possibility is that the apertures used by GALEX contain much less flux than extrapolated from the stellar populations in the fiber aperture of SDSS spectra and this is an aperture effect. This may be consistent with the UV-bright (young) populations being restricted largely to the galaxy cores, as argued by the observations that the inner in these galaxies tend to be bluer and probably contain the majority of the younger stellar populations.
The stellar populations are consistent with what we would naively expect from the morphologies of these objects. In SDSS J0044–0853 the dominant population is old (10 Gyr) and approximately solar; we also observe a year old super-solar component contributing about 20% of the present-day stellar mass (Fig. 24). The latter was likely formed during the most recent star formation episode, likely from pre-existing gas which had been processed by the main galaxy. SDSS J0316–0002 (Fig. 3) has an old solar and sub-solar population and a younger ( Gyr) component, increasing in metal abundance with decreasing age, arguing for a prolonged star formation episode with self-enrichment. In J0827+2142 (Fig. 25) we see an older solar-metallicity component ( Gyr), followed by a more prolonged star formation episode lasting a few Gyrs and a more recent starburst that produced super-solar stars, consistent with an enhanced star formation rate fuelled by pre-existing gas in the galaxy as in J0044–0853. In J1305+5330, Fig. 4 shows an old ( Gyr) sub-solar and solar component. The galaxy seems to have continued to form stars at moderate rates until Gyr ago, where we see the onset of a metal-rich stellar population formed in a starburst and the termination of all star formation a few years ago. All of these galaxies have comparatively relaxed appearances in Figures 1, 10 and 16, as well as in the available SDSS image for J0044–0853.
The disturbed remnant J0944+0429 appears to be a largely old galaxy which formed the majority of its stars about 10 Gyrs ago, but has now undergone a large starburst, a few hundreds Myr ago, comprising of its present mass. The new component is metal-poorer and this suggests that this object may have undergone a merger with a low mass gas-rich galaxy, similar to other dusty ellipticals (e.g., Kaviraj et al. 2013). J1239+1226 has a dominant metal-rich population (Fig. 28) with an age of 10 Gyr, but also contains a few 108 year old metal-rich component, which was likely formed during the merger from pre-enriched gas. In SDSS J1613+5103 we observe a young ( Myr) and metal-poor population, which was likely produced during the current interaction. There are also older metal-poor stars (a few Gyrs old) and intermediate-age solar and super-solar components that may have been formed during a previous close passage. The low metallicity of the younger population suggests that metals formed in the previous star formation episode were not efficiently retained or t that the galaxy has accreted more pristine gas, triggering star formation at a later time (Fig. 29). For J1627+4328, the main population is old and metal-rich, with evidence for self-enrichment, but we also see a small young and metal poor component Gyr old (Fig. 30). This is likely to have originated in a merger with a gas-rich low-mass galaxy as well. Finally, Fig. 31 shows the spectral energy distribution for J2255+0058. This shows a similar pattern with old stars and younger populations a few 108 years old; however, these show a mixture of abundances and one possibility is that fuel was contributed by the massive galaxies as well as a more metal-poor companion.
4.1 The super star clusters of J1613+5103
In SDSS J1613+5103 we also observe numerous super star clusters spread across the face of the galaxy, with several bright objects apparently lying among jets emerging from the main body of the PSG. This ‘cluster stream’ is clearly visible in the image of the central part of the galaxy shown in Figure 18. Since we have , and -band data we can attempt to model the star formation histories of these clusters. These provide a secondary check on the ages derived from fitting stellar population models to the integrated spectra, at least for the younger stellar populations. They are also some of the most distant such clusters yet observed.
We have selected all point sources within of the PSGs as candidate clusters and have then measured aperture magnitudes for these objects using standard routines. The resulting color-color diagram for these clusters (for ) is presented Fig. 5 together with the age sequence sequence for single-burst clusters of solar metallicity from the latest Padova isochrones Girardi et al. (2000); Marigo et al. (2008).
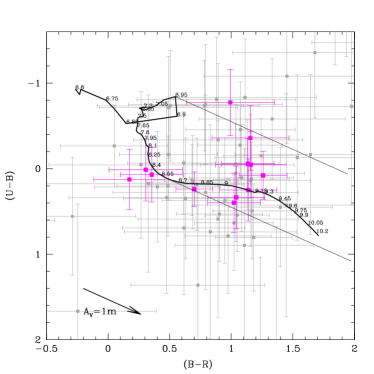
As mentioned above this galaxy is very dusty so the dust extinction varies significantly from cluster to cluster in this diagram. Therefore we are not able to assign reliable ages to each cluster. Clearly, however, if we restrict our attention to the best observed objects (shown in colour), we see that all have ages between a few million years and about one Gyr, with a peak about 108 years ago. This is largely consistent with the star formation history inferred from analysis of the spectrum, suggesting that our analysis is appropriate. Super star clusters are known to exist in many PSGs, including those studied by Yang et al. (2008) and in J1239+1226 and J2255+0058 in our sample: however, in these cases we have no band data and we cannot carry out a similar analysis, as we are not able to estimate a reddening vector.
5 Active Nuclei in PSGs
Feedback from an AGN could provide the means to truncate star formation in a massive galaxy. As many of our galaxies are obvious merger remnants (whose high visibility phase is expected to last for Myr – Conselice 2006), star formation appears to have been centrally concentrated (as observed in other PSGs) and to have been suppressed outwards (e.g., Goto et al. 2008b) over relatively short periods (a few 108 years from analysis of the stellar populations and as also found by Brown et al. 2009), we might suppose that AGNs have played some part in the origin of the PSG signature. If the AGN was triggered during the final coalescence and shortly after the major star formation episodes (as in simulations by Springel et al. 2005 and Hopkins et al. 2008a – note that Bessiere et al. 2014 finds that in the Type II QSO J002531–104022 star formation activity must be nearly simultaneous with the AGN), we might be able to detect even obscured young AGNs in their cores down to a small fraction of the Eddington luminosity (Hopkins & Hernquist, 2009). In these models, AGNs are initially deeply buried by gas and dust and only become optically visible a few hundred Myr after the peak of star formation activity, approximately the age of the young stellar populations in our objects. However, they should be visible in the X-rays or radio even if they are highly obscured in the optical.
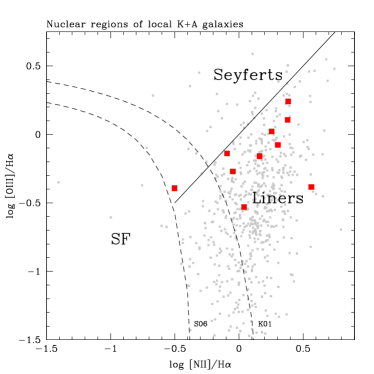
We first plot the conventional line-ratio diagram, which separates AGNs from LINERS and star-forming galaxies (Kewley et al., 2001; Stasinska et al., 2006) in Fig. 6. None of our galaxies falls among the Seyferts or Star-formers. They are all among the LINERS, as do most of the PSGs in Melnick & De Propris (2013). However, the majority of LINERS are not weak AGNs, but are powered by young stellar populations and/or ultraviolet-bright AGB and post-AGB stars (Stasinska et al., 2008): this is indeed the case for PSGs, very few of which fall in the weak AGN section in Melnick & De Propris (2013).
AGNs often show optical variability (Hawkins, 2002). Our galaxies lie within the footprint of the Catalina Rapid Transient Survey (Drake et al., 2009) and we plot their Catalina magnitude vs. modified Julian Date in Fig. 7. None of the galaxies studied in this paper shows signs of optical variability.

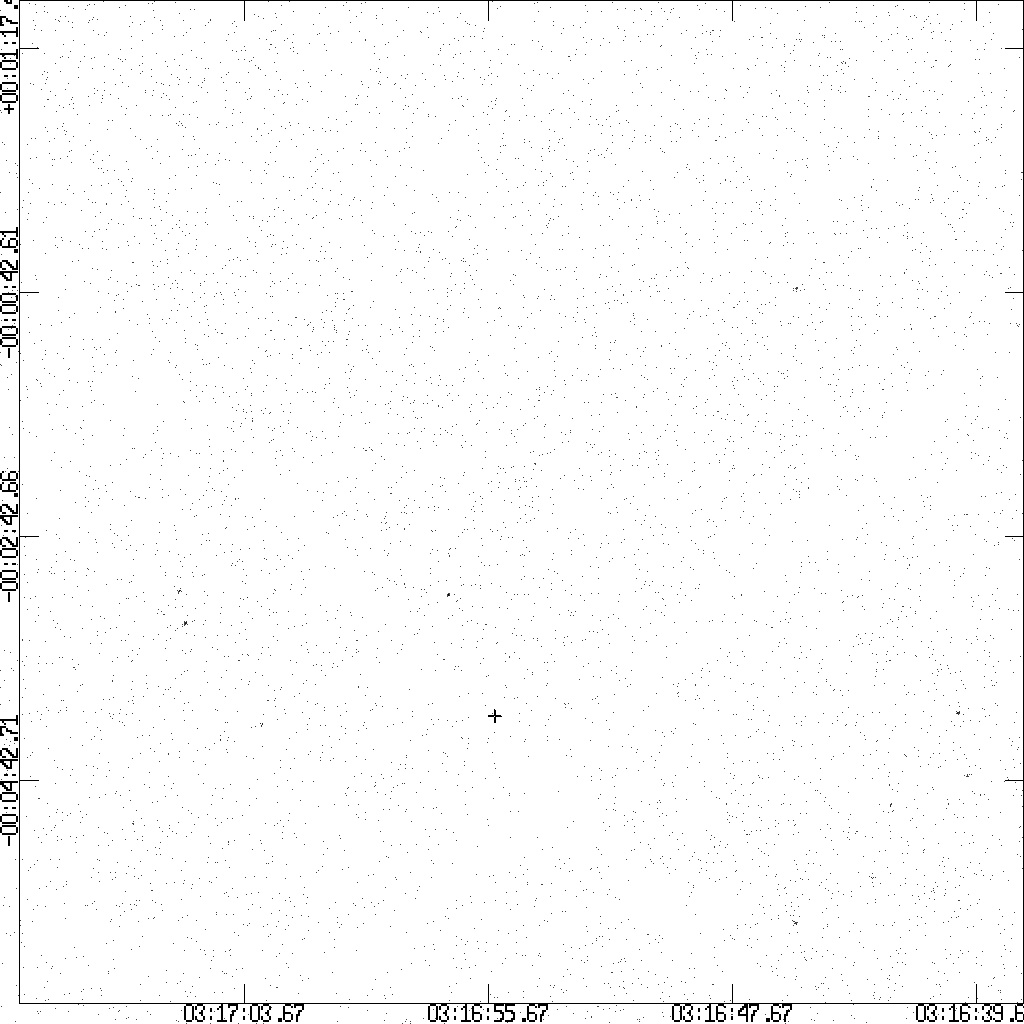
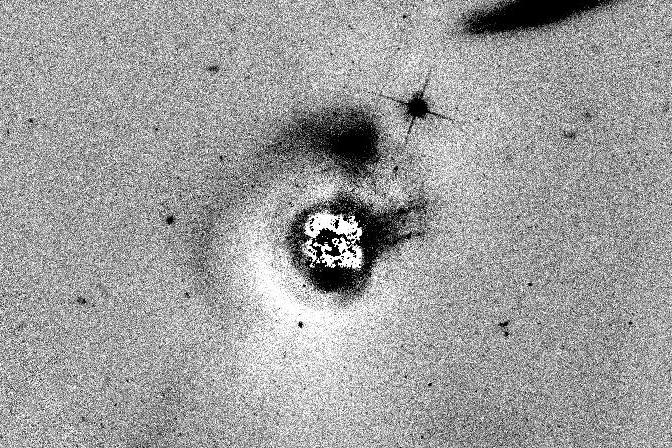
X-ray emission unambiguously identifies the presence of AGNs, especially above 2 KeV (Brandt & Hasinger, 2005). We have used archival Chandra images, taken with the ACIS-I camera with exposure times of 10 to 20 ks, to search for X-ray emission in the 0.5–7.0 KeV band. In Fig. 8 we show the central ACIS-I chip for J0316–0002, with the galaxy position marked with a cross. All X-ray images are dominated by noise and show no point source corresponding to any of our galaxies: for economy of space we do not include the other images, but these can be easily retrieved from Chandra archive server with the dataset identifiers we provide below in Table 3. We have calculated the fluxes and upper limits using CIAO and show these in Table 3. These are consistent with absolute values of ergs s-1, well below typical X-ray fluxes from powerful AGNs.
| Object | Dataset | Flux | upper limit |
|---|---|---|---|
| ADS/Sa.CXO#obs/ | [ergs/s] | 1 [ergs/s] | |
| J0044–0853 | 10266 | ||
| J0316–0002 | 10267 | … | |
| J0827+2142 | 10268 | … | |
| J0903+0112 | 8174 | ||
| J0944+0429 | 10269 | … | |
| J1239+1226 | 10270 | ||
| J1305+5335 | 10271 | ||
| J1613+5103 | 10272 | ||
| J1627+4328 | 10273 | ||
| J2255+0058 | 9594 |
If we then take the central velocity dispersions in Table 1 and calculate the expected black hole masses following the relation shown by Graham & Scott (2013), we can use the X-ray fluxes above to estimate that no black hole can be present in these galaxies with an accretion rate greater than about 0.1% of the Eddington luminosity. The X-ray fluxes and upper limits are more consistent with the integrated flux from X-ray binaries in these comparatively young populations (Gilfanov et al., 2004). Supermassive black holes are expected to be detectable at these luminosities for a period of Gyr after they are activated (Hopkins & Hernquist, 2009), even if they have already quenched star formation and stopped accreting matter efficiently.
Furthermore, we also use the BAT/Swift 70 month map (Baumgartner et al., 2013) to estimate the likelihood that a hard X-ray source is present within the pixel containing these galaxies. Only in one case we have signal to noise greater than 3 (this is next to an unrelated AGN, whose PSF may spread into the pixel of interest) and most have signal to noise well below 1.
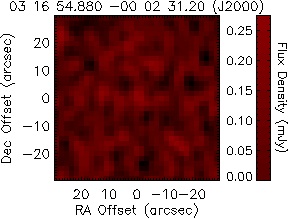
We also use the FIRST survey to estimate the 20cm radio flux at these positions. A cutout of the FIRST image for J0316–0002 is shown in Fig. 9. All other galaxies are similar: no point source is present at any of the stated positions (the images can be easily retrieved from the FIRST survey and are not presented here). Since the sensitivity of the FIRST survey is 0.75 mJy per beam, this corresponds to absolute radio powers W Hz-1 for all our systems. Following Sadler et al. (2002) none of these galaxies is likely to host a radio source powered by an AGN.
We conclude that there is no strong evidence for the presence of AGNs in these galaxies. In agreement with Shin et al. (2011), current AGN activity seems to be unrelated to the PSG phenomenon.
6 Discussion
We have studied 10 PSGs with a wealth of imaging in multiple bandpasses and archival data in the X-rays and radio, as well as spectroscopy. Two of these galaxies are interacting pairs, at least one showing large tidal disturbances (J1613+5103). At least four more are obvious merger remnants, with numerous high surface brightness tidal features (shells, fans, plumes, etc.) sometimes visible even in the shallower SDSS images. Four more of these galaxies are comparatively normal systems, but even in these cases there is some evidence of an old interaction (e.g., the dusty spiral in J0316–0002).
All of these galaxies have old stellar populations but they also contain significant young components, with ages ranging between a few 107 and 109 years. There is of course considerable variation from galaxy to galaxy. All show evidence of an old () initial star formation episode, consistent with all galaxies of similar masses. In many cases we then see long periods of quiescence, although some galaxies show evidence of prolonged star formation in the past (we do not address J0903+0112, where the stellar populations seem to have been formed simultaneously Gyr ago, that seems little consistent with the apparently normal morphologies and colours – we attribute this to contamination in the fiber that may have been placed to the geometric center of these two close systems). The recent starburst shows a variety of ages and metallicities, and this implies that the nature of the available fuel and of the interaction have been different from case to case, as one expects from ’stochastic’ mergers. In some cases the young stars are metal rich and may have been produced by a dramatic increase in star formation that used up the available fuel in an old galaxy. In others, the young stars are more metal poor and this may imply that additional gas has been accreted from a lower-mass companion or that the original gas has been diluted by infall of more pristine material. Several PSGs (albeit, none of the ones we study) have been found to contain significant amounts of HI gas, comparable to those found in spiral galaxies of similar luminosities (Chang et al., 2001; Buyle et al., 2006; Zwaan et al., 2013). Nielsen et al. (2012) also argued that we may be witnessing galaxies in different portions of an activity cycle, with several star formation episodes separated by a few Gyrs. This is supported by the star formation history of SDSS J1613+5103, for example.
Although it is generally difficult to date a merger event based on morphological indicators, as this depends on the nature of the merger, the gaseous content and the detailed mechanics of the encounter, more asymmetric galaxies are expected to be observed closer to the epoch of final coalescence (Conselice, 2006). In our case, there is a broad relation between the age of the stellar populations and their contribution to the galaxy mass, and the degree of morphological disturbance. This is similar to earlier observations by Schweizer & Seitzer (1992) and more recently by Gyory & Bell (2010) and suggests that the mergers and interactions have played a role in triggering or increasing star formation in these galaxies. However. based purely on this sample, we would argue that the peak of star formation precedes the epoch of closest approach and coalescence, and may instead take place during earlier close passages. This is clearly the case in J1613+5103 for example.
Yang et al. (2008) observed that most PSGs have positive colour gradients and blue cores. We find similar results but we also observe that some galaxies have red cores in the inner , or cores that become rapidly bluer outward and then start a reddening trend to large radii. It is not straightforward to interpret these colour gradients, as the galaxies are very dusty. However, such large colour variations as observed here are more likely to be due to age rather than metal abundance gradients (which are usually of the order of a few tenths of magnitude per decade in radius – e.g., La Barbera et al. 2010).
All galaxies in the sample have blue cores compared to their outskirts. Among the more obvious merger remnants, in J1613+5103 we see a blue core in both colours ( and ) with a flat colour gradient out to (the inner 2 kpc), reddening rapidly outwards. J0944+0429 also has a blue core that reddens outwards to and then resumes a mild negative gradient at larger radii (as is common in galaxies). In J1239 there is a strong positive gradient and a blue core, but in the inner the core reddens significantly. We see a very red core in J1627+4328 (likely due to dust) and a positive gradient throughout J2255+0058, although this galaxy starts to redden in the inner . In the more quiescent objects such as J0316–0002, J0827+2142 and J1305+5330, we see a red inner core () which becomes rapidly blue to and then reddens outwards to . From this we can make a tentative connection between the ’ages’ derived from the merger signatures, the stellar populations, and the broad shape of the colour gradients.
Star formation appears to have been concentrated in the centre, within the inner 1–2 kpc. There is some evidence that quenching has proceeded outwards, so that the outer kpc in the core is younger (e.g., in J1603+5103 which has just stopped forming stars we see some tentative evidence of a slightly redder colour in the inner ). The positive colour gradients observed throughout most of the galaxies, however, imply that star formation in these objects was also a global phenomenon, extending across the whole galaxy. This may be compared with the results of integral field units. Pracy et al. (2005) (albeit in a cluster sample, which may be different) and Goto et al. (2008a) reported the existence of Hδ gradients in several PSGs, while Goto et al. (2008b) claimed that there was an age gradient (somewhat older inwards) in J1603+5103. Pracy et al. (2012, 2013) argued for Balmer-line gradients in their sample and therefore for centrally concentrated star formation, while Swinbank et al. (2012) show that the youngest population covers a significant fraction of the galaxy surface and the starburst did not take place in the nucleus only.
Analysis of the optical images, colour gradients and stellar populations derived from optical spectra and multi-wavelength photometry therefore supports the view that PSGs have undergone an episode of highly enhanced star formation following an interaction and/or merger. While this appears to have interested a large fraction of the galaxy, it also appears that star formation was centrally concentrated. Quenching of star formation has proceeded from the inside outwards, which is indicative of a feedback episode (e.g., outflows as in Tremonti et al. 2007): the presence of bright central cusps (Hopkins et al., 2009) is also expected in this scenario.
Together with the presence of significant bulges (high Sersic indices, early-type morphological classification) this raises the possibility that AGNs may have been important in PSGs. In simulations such as Springel et al. (2005) and Hopkins et al. (2008b), the merger coincides with the epoch of highest star formation and AGN activity peaks shortly afterwards, although it is obscured for periods of a few 108 years before an optically luminous QSO can be observed as the gas and dust are cleared. Hopkins (2012) suggests looking at PSGs to observe examples of AGNsin galaxies following merger-induced starbursts.
However, we find little evidence that our PSGs contain any significant AGN activity, including obscured QSOs that would be visible in the X-rays. The central black holes in these galaxies are expected to have masses of about and the X-ray luminosities (or upper limits) we measure in Table 3 indicate that these objects would be accreting at well below 1% of the Eddington luminosity. Our PSGs are observed in various stages of an interaction, from close pairs to comparatively relaxed systems, and show a range of ages for their stellar populations. These indicate that the peak of star formation may actually occur before final coalescence. Bessiere et al. (2012) also finds that QSOs may occur at a variety of times, contrary to simpler modelling: Bessiere et al. (2014) actually finds an optically bright QSO coexisting with vigorous star formation. However, our data suggest that QSOs are not observed (even if highly obscured) for periods of several hundred Myr after a major merger and after the ending of the major star-forming episodes. This is similar to what has been observed by Wong et al. (2012), where no (optical) AGNs were found in their sample of local PSGs and by Wild et al. (2009) where no AGNs were found in their sample of PSGs. On the other hand, Canalizo & Stockton (2013) found that the stellar populations of optically selected QSOs had intermediate age of 0.3 – 2.4 Gyr (somewhat larger than our systems) while Cales et al. (2013) also find examples of intermediate age populations in optically active galaxies (but their selection includes objects with prominent [OII] emission that would not be considered PSGs). In our data we are sensitive not only to optically visible AGNs, but also to heavily obscured systems via our strong limits in the X-rays and radio and we can confidently state that no bright () nucleus is present.
One possibility is that peak black hole accretion has taken place before the epoch at which these galaxies are observed, and closer to the time of peak star formation; however, in the model by Hopkins & Hernquist (2009) such black holes should be visible, in the X-rays, for periods of up to 1 Gyr, to the sensitivity limits we reach. On he other hand the delays between star formation and QSO activity may be larger than the typical ages of young stellar populations in our sample, but in this case it is difficult to understand how a much more inactive nucleus than even Sgr A, can possibly inhibit further star formation in these galaxies.
We can conclude that even major mergers such as some of the objects examined here, do not necessarily initiate AGN activity and that the timescales for the QSO to accrete at high rates may be longer than expected in at least some scenarios. In PSGs we have objects where star formation has currently ceased: yet no QSO activity is apparent to quench any residual star formation or prevent gas (which is known to exist in these objects – Chang et al. 2001; Buyle et al. 2006; Zwaan et al. 2013) from forming new stars. Even though the sample we analyse is small, our data do not fully support a model where AGN feedback results in post-starburst galaxies that evolve on to the red sequence.
Acknowledgments
We highly appreciate a very helpful report from the anonymous referee.
GALEX (Galaxy Evolution Explorer) is a NASA Small Explorer, launched in April 2003. We gratefully acknowledge NASA’s support for construction, operation, and science analysis for the GALEX mission.
Funding for the SDSS and SDSS-II has been provided by the Alfred P. Sloan Foundation, the Participating Institutions, t he National Science Foundation, the U.S. Department of Energy, the National Aeronautics and Space Administration, t he Japanese Monbukagakusho, the Max Planck Society, and the Higher Education Funding Council for England. The SDSS Web Site is http://www.sdss.org/.
The SDSS is managed by the Astrophysical Research Consortium for the Participating Institutions. The Participating Institutions are the American Museum of Natural History, Astrophysical Institute Potsdam, University of Basel, University of Cambridge, Case Western Reserve University, University of Chicago, Drexel University, Fermilab, the Institute for Advanced Study, the Japan Participation Group, Johns Hopkins University, the Joint Institute for Nuclear Astrophysics, the Kavli Institute for Particle Astrophysics and Cosmology, the Korean Scientist Group, the Chinese Academy of Sciences (LAMOST), Los Alamos National Laboratory, the Max-Planck-Institute for Astronomy (MPIA), the Max-Planck-Institute for Astrophysics (MPA), New Mexico State University, Ohio State University, University of Pittsburgh, University of Portsmouth, Princeton University, the United States Naval Observatory, and the University of Washington.
This publication makes use of data products from the Two Micron All Sky Survey, which is a joint project of the University of Massachusetts and the Infrared Processing and Analysis Center/California Institute of Technology, funded by the National Aeronautics and Space Administration and the National Science Foundation.
This work is based in part on observations made with the Spitzer Space Telescope, obtained from the NASA/ IPAC Infrared Science Archive, both of which are operated by the Jet Propulsion Laboratory, California Institute of Technology under a contract with the National Aeronautics and Space Administration.
This publication makes use of data products from the Wide-field Infrared Survey Explorer, which is a joint project of the University of California, Los Angeles, and the Jet Propulsion Laboratory/California Institute of Technology, funded by the National Aeronautics and Space Administration
The scientific results reported in this article are based to a significant degree on data obtained from the Chandra Data Archive. This research has made use of software provided by the Chandra X-ray Center (CXC) in the application packages CIAO, ChIPS, and Sherpa.
We acknowledge the use of NASA’s SkyView facility (http://skyview.gsfc.nasa.gov) located at NASA Goddard Space Flight Center.
This research has made use of the NASA/IPAC Extragalactic Database (NED) which is operated by the Jet Propulsion Laboratory, California Institute of Technology, under contract with the National Aeronautics and Space Administration.
This research has made use of the NASA/ IPAC Infrared Science Archive, which is operated by the Jet Propulsion Laboratory, California Institute of Technology, under contract with the National Aeronautics and Space Administration. IRSA and the Spitzer Heritage Archive utilize technology developed for the Virtual Astronomical Observatory (VAO), funded by the National Science Foundation and the National Aeronautics and Space Administration under Cooperative Agreement AST-0834235.
We acknowledge the usage of the HyperLeda database (http://leda.univ-lyon1.fr).
Based on observations made with the NASA/ESA Hubble Space Telescope, obtained from the data archive at the Space Telescope Science Institute. STScI is operated by the Association of Universities for Research in Astronomy, Inc. under NASA contract NAS 5-26555.
The authors acknowledge discussions with Malcolm Bremer, Jari Kotilainen, Elina Lindfors and Steve Phillipps.
References
- Abazajian et al. (2009) Abazajian K. N., Adelman-McCarthy J. K., Agueros M. A. et al. 2009, ApJS, 182, 543
- Antonucci (1993) Antonucci R. 1993, ARA&A, 31, 473
- Baldry et al. (2004) Baldry I. K., Glazebrook K., Brinkmann J. et al. 2004, ApJ, 600, 681
- Barnes & Hernquist (1996) Barnes J. E., Hernquist L. 1996, ApJ, 471, 115
- Baumgartner et al. (2013) Baumgartner W. H., Tueller J., Markwardt C. B. et al. 2013, ApJS, 207, 19
- Becker et al. (1995) Becker R. H., White R. L. & Helfand D. J. 1995, ApJ, 450, 559
- Bekki et al. (2005) Bekki K., Shioya Y., Couch W. J., Vazdekis A. 2005, MNRAS, 359, 949
- Bell et al. (2012) Bell E. F., van der Wel A., Papovich C. et al. 2012, ApJ, 753, 167
- Bessiere et al. (2012) Bessiere P., Tadhunter C. N., Ramos Almeida C., Villar Martin M. 2012, MNRAS, 426, 276
- Bessiere et al. (2014) Bessiere P., Tadhunter C. N., Ramos Almeida C., Villar Martin M. 2014, MNRAS, in press
- Brandt & Hasinger (2005) Brandt W. N. & Hasinger G. 2005, ARA&A, 43, 827
- Brown et al. (2009) Brown M. J. I., Moustakas J., Caldwell N. et al. 2009, ApJ, 703, 150
- Bruzual & Charlot (2003) Bruzual, G. & Charlot S., 2003, MNRAS, 344, 1000
- Buyle et al. (2006) Buyle P., Michielsen D., De Rijcke S. et al. 2006, ApJ, 649, 163
- Cales et al. (2013) Cales S. L., Brotherton M. L., Shang Z. et al. 2013, ApJ, 762, 90
- Canalizo & Stockton (2013) Canalizo G., Stockton A. 2013, ApJ, 772, 132
- Casali et al. (2007) Casali M., Adamson A., Alves de Oliveira C. et al. 2007, A&A, 467, 777
- Chang et al. (2001) Chang T.-C., van Gorkom J. H., Zabludoff A. I., Zaritsky D., Mihos J. C. 2011, AJ, 121, 1965
- Chisari & Kelson (2012) Chisari N. E., Kelson D. D. 2012, ApJ, 753, 94
- Choi et al. (2009) Choi Y., Goto T., Yoon S.-J. 2009, MNRAS, 395, 637
- Cid Fernandes et al. (2005) Cid Fernandes R., Mateus A., Sodre L., Stasinska G., Gomes J. M. 2005, MNRAS, 358, 363
- Coil et al. (2011) Coil A. L., Weiner B. J., Holz D. E. et al. 2011, ApJ, 743, 46
- Conselice (2006) Conselice C. J. 2006, ApJ, 638, 686
- Drake et al. (2009) Drake A. J., Djorgovski S. G., Mahabal A. et al. 2009, ApJ, 696, 870
- Du et al. (2010) Du W., Luo A. L., Prugniel P., Liang Y. C., Zhao Y. F. 2010, MNRAS, 409, 567
- Evans et al. (2010) Evans I. N., Primini F. A., Gloferty K. J. et al. 2010, ApJS, 189, 37
- Georgakakis et al. (2008) Georgakakis A., Nandra K., Yan R. et al. 2008, MNRAS, 385, 2049
- Gilfanov et al. (2004) Gilfanov M., Grimm H.-J., Sunyaev R. 2004, MNRAS, 357, L57
- Girardi et al. (2000) Girardi L.,Bressan A., Bertelli L., Chiosi C. 2000, A&AS, 141, 371
- Goto (2005) Goto T. 2005, MNRAS, 357, 937
- Goto (2007) Goto T. 2007, MNRAS, 381, 187
- Goto et al. (2008a) Goto T., Kawai A., Shimono A. et al. 2008a, MNRAS, 386, 1355
- Goto et al. (2008b) Goto T., Yagi M., Yamauchi C. 2008b, MNRAS, 391, 700
- Graham & Scott (2013) Graham A. R., Scott N. 2013, ApJ, 764, 151
- Gyory & Bell (2010) Gyory S., Bell E. F. 2010, ApJ, 729, 694
- Hambly et al. (2008) Hambly N. C., Collins R. S., Cross N. J. G. et al. 2008, MNRAS, 384, 673
- Hawkins (2002) Hawkins M. R. S. 2002, MNRAS, 329, 76
- Hernquist (1989) Hernquist L. 1989, Nature, 340, 687
- Hewett et al. (2006) Hewett P. C., Warren S. J., Leggett S. K., Hodgkin S. T. 2006, MNRAS, 367, 454
- Hinshaw et al. (2013) Hinshaw G., Larson D., Komatsu E. et al. 2013, ApJS, 208, 19
- Hodgkin et al. (2009) Hodgkin S. T., Irwin M. J., Hewett, P. C., Warren S. J. 2009, MNRAS, 394, 675
- Hopkins et al. (2005) Hopkins P. F., Hernquist L., Cox T. J. et al. 2005, ApJ, 630, 705
- Hopkins et al. (2008a) Hopkins P. F., Hernquist L., Cox T. J., Keres D. 2008a, ApJS, 175, 356
- Hopkins et al. (2008b) Hopkins P. F., Cox T. J., Keres D., Hernquist L. 2008b, ApJS, 175, 390
- Hopkins et al. (2009) Hopkins P. F., Cox T. J., Dutta S. et al. 2009, ApJS, 181, 135
- Hopkins & Hernquist (2009) Hopkins P. F., Hernquist L. 2009, ApJ, 698, 1550
- Hopkins (2012) Hopkins P. F. 2012, MNRAS, 420, L8
- Huertas-Company et al. (2011) Huertas-Company M., Aguerri J. L., Bernardi M., Mei S., Sanchez Almeida J. 2011, A&A 525, 157
- Joseph & Wright (1995) Joseph R. D., Wright G. S. 1995, MNRAS, 214, 87
- Kaviraj et al. (2007) Kaviraj S., Kirkby L. A., Silk J. & Sarzi M. 2007, MNRAS, 382, 960
- Kaviraj et al. (2013) Kaviraj S., Rowlands K., Alpasian M. et al. 2013, MNRAS, 435, 1463
- Kewley et al. (2001) Kewley L. J., Dopita M. A., Sutherland R. S., Heisler C. A., Trevena J. 2001, ApJ, 556, 121
- Kormendy & Richstone (1995) Kormendy J., Richstone D. 1995, ARA&A, 33, 581
- La Barbera et al. (2010) La Barbera F., De Carvalho R. R., De La Rosa I. G. et al. 2010, AJ, 140, 1582
- Lawrence et al. (2007) Lawrence A., Warren S. J., Almaini O. et al. 2007, MNRAS, 379, 1599
- Liu et al. (2007) Liu C. T., Hooper E. J., O’Neil K. et al. 2007, ApJ, 658, 249
- Lutz et al. (2004) Lutz D., Maiolino R., Spoon H. W. W., Moorwood A. F. M. 2004, A&A, 418, 465
- Ma et al. (2008) Ma C.-J., Ebeling H., Donovan D., Barrett E. 2008, ApJ 684, 160
- Maraston (2005) Maraston C. 2005, MNRAS, 362, 799
- Marigo et al. (2008) Marigo P., Girardi L., Bressan A. et al. 2008, A&A, 482, 883
- McGee et al. (2011) McGee S. L., Balogh M. L., Wilman D. J. et al. 2011, MNRAS, 413, 996
- McMillan (2011) McMillan P. J. 2011, MNRAS, 414, 2446
- Melnick & De Propris (2013) Melnick J. & De Propris R. 2013, MNRAS, 431, 2034
- Melnick & De Propris (2014) Melnick J., De Propris R. 2014, submitted to MNRAS
- Misselt et al. (1999) Misselt K. A., Clayton G. C., Gordon K. D. 1999, ApJ, 515, 128
- Morrissey et al. (2007) Morrissey P., Conrow T., Barlow T. A. et al. 2007, ApJs, 173, 682
- Nielsen et al. (2012) Nielsen D. A., Ridgway S. E., De Propris R., Goto T. 2012, ApJ, 761, L16
- Noel et al. (2013) Noel, N. E. D., Greggio L., Renzini, A., Carollo, M., Maraston, C. 2013, ApJ, 772, 58
- Nolan et al. (2007) Nolan L. A., Raychaudhury S., Kaban A. 2007, MNRAS, 375, 381
- Peng et al. (2002) Peng C. Y. Ho L. C., Impey C. D., Rix H.-W. 2002, AJ, 124, 266
- Peng et al. (2010) Peng C. Y., Ho L. C., Impey C. D., Rix H.-W. 2010, AJ, 139, 2079
- Pracy et al. (2005) Pracy M. B., Couch W. J., Blake C. et al. 2005, MNRAS, 359, 1421
- Pracy et al. (2012) Pracy M. B., Owers M. S., Couch W. J. et al. 2012, MNRAS, 420, 2232
- Pracy et al. (2013) Pracy M. B., Croom S., Sadler E. M. et al. 2013, MNRAS, 432, 3131
- Quintero et al. (2004) Quintero A. D., Hogg D. W., Blanton M. R. et al. 2004, ApJ, 602, 190
- Sadler et al. (2002) Sadler E. M., Jackson C. A., Cannon R. D. et al. 2002, MNRAS, 329, 87
- Schweizer & Seitzer (1992) Schweizer F., Seitzer P. 1992, AJ, 104, 1039
- Shin et al. (2011) Shin M.-S., Strauss M. A., Tojeiro R. 2011, MNRAS, 410, 1583
- Skrutskie et al. (2006) Skrutskie M. F., Cutri R. M., Stiening R. et al. 2006, AJ, 131, 1163
- Snyder et al. (2011) Snyder G. F., Cox T. J., Hayward C. C., Hernquist L., Jonsson P. 2011, ApJ, 741, 77
- Springel et al. (2005) Springel V., Di Matteo T., Hernquist L. 2005, MNRAS, 361, 776
- Stasinska et al. (2006) Stasinska G., Cid Fernandes R., Mateus A., Sodre L., Vale Asari N. 2006, MNRAS, 371, 972
- Stasinska et al. (2008) Stasinska G., Vale Asari N., Cid Fernandes R. et al. 2008, MNRAS, 391, L29
- Strateva et al. (2001) Strateva I., Ivezić Z., Knapp G. R. et al. 2001, AJ, 122, 1861
- Swinbank et al. (2012) Swinbank A. M., Balogh M. L., Bower R. G. et al. 2012, MNRAS, 420, 672
- Toomre (1977) Toomre A. 1977 in Evolution of Galaxies and Stellar Populations, ed. B. M. Tinsley and R. B. Larson (Yale: Yale University Press), p. 401
- Tremonti et al. (2007) Tremonti C. A., Moustakas J., Diamond-Stanic A. M. 2007, ApJ, 663, L77
- Tueller et al. (2008) Tueller J., Mushotzsky R. F., Barthelmy S. et al. 2008, ApJ, 681, 113
- Yagi et al. (2006) Yagi M., Goto T., Hattori T. 2006, ApJ, 642, 152
- Yamauchi et al. (2008) Yamauchi C., Yagi M., Goto T. 2008, MNRAS, 390, 383
- Yang et al. (2008) Yang Y., Zabludoff A. I., Zaritsky D., Mihos J. C. 2008, ApJ, 688, 945
- York et al. (2000) York D. G., Adelman J., Anderson J. E. et al. 2000, AJ, 120, 1579
- Yoshida et al. (2008) Yoshida Y. , Yagi M., Komiyama Y. et al. 2008, ApJ, 688, 918
- Wetzel et al (2012) Wetzel A. R., Tinker J. L., Conroy C. 2012, MNRAS, 424, 232
- Wild et al. (2009) Wild V., Walcher C. J., Johansson P. H. et al. 2009, MNRAS, 395, 144
- Wong et al. (2012) Wong O. I., Schawinski K., Kaviraj S. et al. 2012, MNRAS, 420, 1684
- Wright et al. (2010) Wright E. L., Eisenhardt P. R. M., Mainzer A. K. et al. 2010, AJ, 140, 1868
- Wu et al. (2013) Wu P.-F., Gal R. R., Lemaux B. C. et al. 2013, astro-ph, 1311.0586
- Zabludoff et al. (1996) Zabludoff A. I., Zaritsky D., Lin H. et al. 1996, ApJ, 466, 104
- Zavala et al. (2012) Zavala J., Avila-Reese V., Firmani C., Boylan-Kolchin M. 2012, MNRAS, 427, 1503
- Zwaan et al. (2013) Zwaan M. A., Kuntschner H., Pracy M. B., Couch W. J. 2013, MNRAS, 432, 492
Appendix A Imaging and surface brightness profiles for all galaxies
Here we present the remaining images, models and residuals for all galaxies, as well as their surface brightness profiles and colour gradients.


Appendix B Stellar Populations
Here we plot the spectral energy distributions, STARLIGHT models and the derived star formtion histories for our galaxies.