Fermi Surface of KFe2As2 from Quantum Oscillations in Magnetostriction
Abstract
We present a study of the Fermi surface of KFe2As2 single crystals. Quantum oscillations were observed in magnetostriction measured down to 50 mK and in magnetic fields up to 14 T. For , the calculated effective masses are in agreement with recent de Haas–van Alphen and ARPES experiments, showing enhanced values with respect to the ones obtained from previous band calculations. For , we observed a small orbit at a cyclotron frequency of 64 T, characterized by an effective mass of 0.8 , supporting the presence of a three-dimensional pocket at the Z-point.
I Introduction
The multiband character of the Fermi surface (FS) of KFe2As2 deeply affects the properties of the normal and superconducting states. In a recent study zocco13a , we showed that multiband effects are manifest in the thermal-expansion coefficient , and in the upper-critical field . In addition, is strongly affected by Pauli-limiting when fields are applied parallel to the FeAs layers zocco13a ; burger13a . This compound belongs to the Ba1-xKxFe2As2 series, in which the superconducting state reaches a maximum of 38 K for = 0.4 rotter08a . Further hole-doping with K suppresses to a minimum of 3.4 K for = 1. It has long been argued that the symmetry of the superconducting order parameter varies across the series. In the optimally doped compound, the superconducting state is fully gapped and exhibits -wave symmetry ding08a . For KFe2As2, on the other hand, evidence for multi-gap nodal -wave superconductivity has been found in nuclear quadrupole resonance fukazawa09a and angle-resolved photoemission spectroscopy (ARPES) okazaki12a experiments, while recent work report a possible -wave pairing mechanism tafti13a . The latter suggests that a Lifshitz transition or a phase transition with broken symmetry could take place at intermediate K concentrations.
In order to understand the superconducting properties of these compounds, the structure of the FS has been widely studied. In the optimally doped Ba1-xKxFe2As2, the FS is derived from multiple Fe-3 orbitals, composed of three concentric quasi-two-dimensional hole cylinders located at the Brillouin-zone (BZ) center (-point), and electron cylinders located at the zone corner. As the chemical potential changes with increasing K concentration, the corner cylinders transform into hole Fermi sheets sato09a . The FS of KFe2As2 is formed by quasi-two-dimensional hole cylinders aligned with the -axis: three (, and ) centered at the -point, and hole cylinders near the X-point terashima10a ; hashimoto10a ; okazaki12a ; yoshida12a ; terashima13a . Additionally, small three-dimensional hole pockets were predicted theoretically to exist at the Z-point terashima10a ; hashimoto10a . To what extent these multiple bands affect the structure of the superconducting gap in KFe2As2 is a subject of extensive study hardy13b .
In this work, we studied the Fermi surface of KFe2As2 via quantum oscillations (QOs) in magnetostriction measurements down to 50 mK. In the present manuscript we focus in the normal conducting state, from the upper critical field up to a maximum applied field of 14 T ( = 1.5 T, = 4.8 T at 0). A detailed study of the superconducting properties of KFe2As2 below can be found in Ref. zocco13a and in the references therein.
II Experimental methods
Single crystals of KFe2As2 were grown from self flux as described in zocco13a . Millimeter-size platelike samples with typical residual-resistivity ratios RRR = (300 K)/(4 K) 1000 were obtained. The experiments were carried out in a home-built CuBe capacitive dilatometer for measurements of thermal expansion and magnetostriction, parallel and perpendicular to the applied magnetic field. For a typical sample length of 1 mm, the resolution amounts to 10-10. The magnetostriction coefficients are defined as = , where is the length of the sample along the axis = or = . Temperatures as low as 50 mK were obtained in a commercial Oxford Kelvinox 3He-4He dilution refrigerator equipped with a 14 T superconducting magnet. The measurements presented here were performed on two different samples (Sample 1 and Sample 2), obtained from two different growths.
III Results
For , quantum oscillations (QOs) in the magnetostriction ( ) were observed above = 1.5 T up to 14 T. Fig. 1(a) displays the high-field region for temperatures 0.05 K 0.5 K (Sample 1). A clear beat pattern is observed, damped progressively with increasing temperature. In fact, a Fourier-transform (FT) analysis of the QOs (periodic in 1/) reveals two pairs of sharp peaks with similar cyclotron frequency values () [Fig. 1(b)], which correspond to the low and high components of the and cylinders previously determined from de Haas–van Alphen (dHvA) measurements terashima10a ; terashima13a . Additional peaks are observed at 2.55, 2.61 and 2.66 kT, which we could not identify with the cyclotron orbits of the and cylinders, not with harmonics of the peaks.
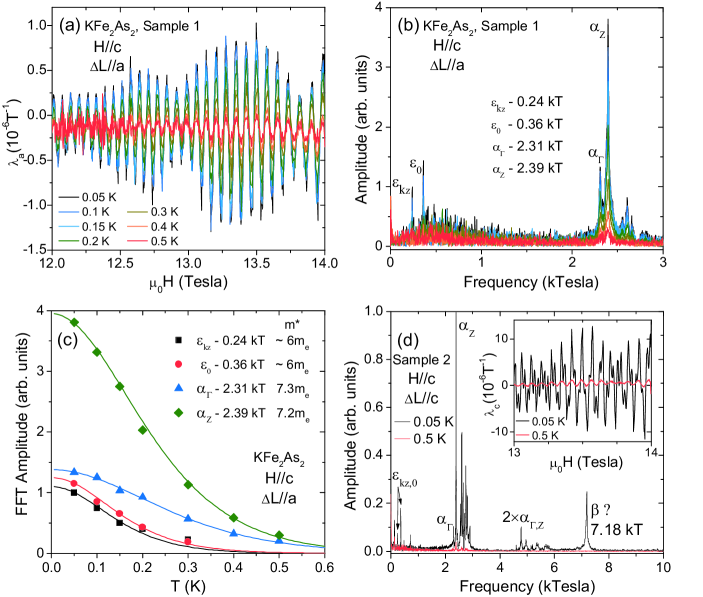
Values of effective mass can be inferred from the temperature dependence of the QOs, using the Lifshitz -Kosevich formula which gives the temperature damping factor of the amplitude of the QOs shoenberg1984 :
| (1) |
where is the bare electron mass. The coefficient can be estimated from fits to the temperature dependence of the amplitudes of either the FT peaks or the oscillations in . In the first case, the value of magnetic field in Eq. 1 is obtained from the average of the 1/ window used in the FT, while for the second method, the value of corresponds to the field range at which the amplitude of the QOs in magnetostriction were determined.
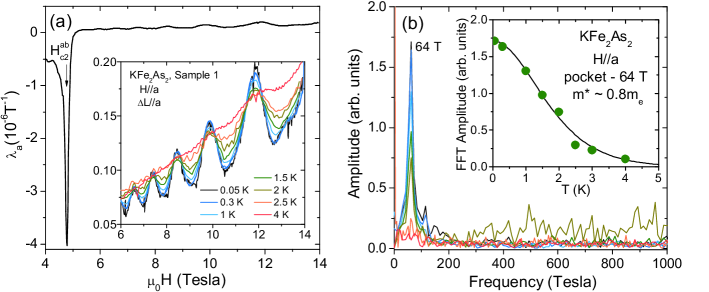
Fig. 1(c) shows the fits obtained for , for the , , and Fermi sheets. For the oscillations ( 2.3 kT), it is possible to resolve the characteristic peaks in a FT window of 12–14 T, which translates in a value of = = 12.9 T. The effective mass values for and are 7.3 and 7.2, respectively. For the oscillations, on the other hand, that value of results in small effective masses 2.5, much smaller than the previously reported values. Therefore, larger field windows are used (4–14 T and 6–14 T). This allows us to resolve FT peaks up to a maximum temperature of 0.3 K, which results in effective mass values of (61). Further increase of makes the amplitudes of the FT peaks smaller and the estimation of the effective masses more inaccurate.
Quantum oscillations were also measured in Sample 2 at 0.05 K and at 0.5 K [Fig. 1(d)]. At 0.05 K, the , 2 and peaks are well defined in the FT. Similarly to Sample 1, a group of additional peaks appear between 2.5 and 2.9 kT, which we are not able to unambiguously identify with harmonics, peaks predicted by band calculations or peaks from previous dHvA measurements. A peak of larger amplitude appears at 7.18 kT, not observed in Sample 1, which can be associated with either the third harmonic of or with the cylinder.
For , QOs were observed above = 4.8 T. Fig. 2(a) displays these QOs between 6 and 14 T, for temperatures ranging from 0.05 K to 4 K. A low-frequency component is clearly observed at low temperatures with a characteristic frequency of 64 T, which is nearly suppressed at 4 K. The temperature dependence of the Fourier transform [Fig. 2(b)] results in a value of effective mass for this band of 0.8 .
Another damping effect affecting the amplitude of the quantum oscillations arises from impurities in the samples. The Dingle impurity factor can be written as
| (2) |
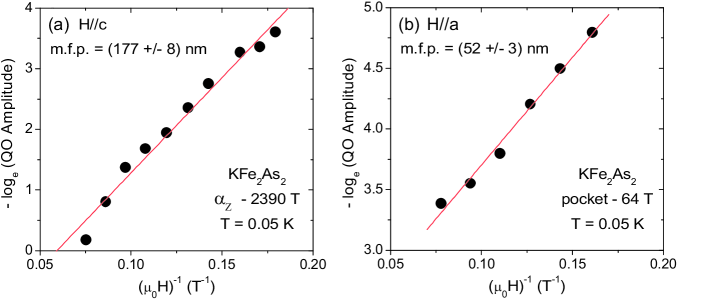
where is the Fermi velocity, the electron charge, the applied magnetic field, and the mean free path of the quasi-particles of effective mass . The Fermi velocity can be calculated assuming circular orbits. For , we plot in Fig. 3(a) the field dependence of the amplitude of the QOs at 50 mK corresponding to the = 2.39 kT component ( = 7.2 and = 35450 m/s), from which we obtain = (1778) nm. For , we plot in Fig. 3(b) the amplitudes of the only visible component ( = 64 T, = 0.8 and = 63800 m/s), giving = (523) nm. In all cases, the amplitude values were corrected by the temperature damping factor described above. With the coherence lengths of 15 nm and 3 nm terashima09a , the ratio 15 confirms that the samples are in the superconducting clean limit.
IV Discussion
The values of the effective mass extracted from our magnetostriction data , and from previously reported dHvA terashima10a ; terashima13a and ARPES yoshida12a experiments, are collected in Table 1. The extracted high effective masses are consistent with the enhanced Sommerfeld coefficient present in this compound. For , the values of the effective mass from are in good agreement with previous experiments. Since for , is dominated by the average of the and oscillations [Fig. 1(a)], it is also possible to calculate for the band an average directly from the amplitudes of : at 13.5 T, 8, similar to the values calculated from the amplitudes of peaks determined in the Fourier-transform analysis.
| -field | label | (T) | (m/s) | ||||
| direction | dHvA | ARPES | |||||
| -axis | 6.0 | 5.1 | 7.3 | 2310 | 42015 | ||
| Z | 6.5 | 6.6 | 7.2 | 2390 | 35450 | ||
| 8.5 | 11.0 | – | 2890* | 40360* | |||
| Z | 18.0 | 9.6 | – | 4400* | 23520* | ||
| 19 | 16.3 | 16 | 7180 | 33800 | |||
| Z | 17.9 | ||||||
| 6.0 | 5.6 | 61 | 240 | 36080 | |||
| 0 | 7.2 | – | 360 | 50870 | |||
| -axis | Z | – | – | 0.8 | 64 | 63815 |
![[Uncaptioned image]](/html/1401.4403/assets/x4.png)
In Sample 2, an additional peak appears at 7.18 kT in the FT [Fig. 1(d)], with an amplitude larger than that of the second harmonic of . A peak associated with the cylinder is expected to appear at this frequency, following the estimation of the FS cross-sectional area given by ARPES yoshida12a . Given that the amplitude of harmonics decreases exponentially with harmonic number, we can assign our 7.18 kT peak to orbits in the cylinder terashima10a ; terashima13a . At 0.5 K, this peak is completely suppressed. Unfortunately, we did not collect data for Sample 2 at intermediate temperatures, making difficult an accurate estimation of the effective mass. The amplitudes of the FT peaks at 7.18 kT set a lower limit for 16 for the cylinder, in agreement with = 16–19 recently obtained from dHvA and ARPES experiments terashima10a ; yoshida12a ; terashima13a .
For (Fig. 2), the QOs are characterized by a single low-frequency component ( = 64 T). They are nearly suppressed at 4 K, resulting in an effective mass of 0.8. Signatures of such small FS areas were not observed in previous dHvA or ARPES experiments sato09a ; terashima10a ; okazaki12a ; yoshida12a ; terashima13a . Since the amplitude of QOs in magnetostriction is proportional to shoenberg1984 , where is the uniaxial stress along the -axis ( = ), small extremal FS areas can appear more prominently in magnetostriction measurements than in other techniques. Given that these oscillations correspond to out-of-plane orbits, they cannot originate from two-dimensional FSs. Their size and effective mass rather point to small three-dimensional pockets which have been predicted to exist above the zone center at the Z-point terashima10a ; hashimoto10a . The relatively small size of these pockets and of the derived effective mass suggest that these pockets do not affect significantly the electronic properties of KFe2As2.
V Conclusions
We have studied quantum oscillations in the magnetostriction of KFe2As2 single crystals. Overall, the Fermi surface inferred from our QOs is in agreement with the previously reported electronic structure of KFe2As2, and confirms its quasi-two-dimensional nature and the presence of strong electronic correlations. Additionally, a small orbit observed for ( = 64 T, = 0.8 ) supports the presence of a three-dimensional pocket at the Z-point.
VI Acknowledgments
The authors thank J. Wosnitza and C. Meingast for stimulating discussions, and R. Schäfer and S. Zaum for help with the experiments. This work has been partially supported by the DFG through SPP1458.
References
- (1) D. A. Zocco, K. Grube, F. Eilers, T. Wolf, and H. v. Löhneysen: Phys. Rev. Lett. 111 (2013) 057007.
- (2) P. Burger, F. Hardy, D. Aoki, A. E. Böhmer, R. Eder, R. Heid, T. Wolf, P. Schweiss, R. Fromknecht, M. J. Jackson, C. Paulsen, and C. Meingast: Phys. Rev. B 88 (2013) 014517.
- (3) M. Rotter, M. Pangerl, M. Tegel and D. Johrendt: Angew. Chem. Int. Ed. 47 (2008) 7949.
- (4) H. Ding, P. Richard, K. Nakayama, K. Sugawara, T. Arakane, Y. Sekiba, A. Takayama, S. Souma, T. Sato, T. Takahashi, Z. Wang, X. Dai, Z. Fang, G. F. Chen, J. L. Luo and N. L. Wang: Europhys. Lett. 83 (2008) 47001.
- (5) H. Fukazawa, Y. Yamada, K. Kondo, T. Saito, Y. Kohori, K. Kuga, Y. Matsumoto, S. Nakatsuji, H. Kito, P. M. Shirage, K. Kihou, N. Takeshita, C.-H. Lee, A. Iyo and H. Eisaki: J. Phys. Soc. Jpn. 78 (2009) 083712.
- (6) K. Okazaki, Y. Ota, Y. Kotani, W. Malaeb, Y. Ishida, T. Shimojima, T. Kiss, S. Watanabe, C.-T. Chen, K. Kihou, C. H. Lee, A. Iyo, H. Eisaki, T. Saito, H. Fukazawa, Y. Kohori, K. Hashimoto, T. Shibauchi, Y. Matsuda, H. Ikeda, H. Miyahara, R. Arita, A. Chainani and S. Shin: Science 337 (2012) 1314.
- (7) F. F. Tafti, A. Juneau-Fecteau, M-E. Delage, S. Rene de Cotret, J-Ph. Reid, A. F. Wang, X.-G. Luo, X. H. Chen, N. Doiron-Leyraud and L. Taillefer: Nat. Phys. 9 (2013) 349.
- (8) T. Sato, K. Nakayama, Y. Sekiba, P. Richard, Y.-M. Xu, S. Souma, T. Takahashi, G. F. Chen, J. L. Luo, N. L. Wang and H. Ding: Phys. Rev. Lett. 103 (2009) 047002.
- (9) T. Terashima, M. Kimata, N. Kurita, H. Satsukawa, A. Harada, K. Hazama, M. Imai, A. Sato, K. Kihou, C.-H. Lee, H. Kito, H. Eisaki, A. Iyo, T. Saito, H. Fukazawa, Y. Kohori, H. Harima and S. Uji: J. Phys. Soc. Jpn. 79 (2010) 053702.
- (10) K. Hashimoto, A. Serafin, S. Tonegawa, R. Katsumata, R. Okazaki, T. Saito, H. Fukazawa, Y. Kohori, K. Kihou, C. H. Lee, A. Iyo, H. Eisaki, H. Ikeda, Y. Matsuda, A. Carrington and T. Shibauchi: Phys. Rev. B 82 (2010) 014526.
- (11) T. Yoshida, S. Ideta, I. Nishi, A. Fujimori, M. Yi, R. G. Moore, S. K. Mo, D.-H. Lu, Z.-X. Shen, Z. Hussain, K. Kihou, P. M. Shirage, H. Kito, C. H. Lee, A. Iyo, H. Eisaki and H. Harima: arXiv:1205.6911 (2012).
- (12) T. Terashima, N. Kurita, M. Kimata, M. Tomita, S. Tsuchiya, M. Imai, A. Sato, K. Kihou, C.-H. Lee, H. Kito, H. Eisaki, A. Iyo, T. Saito, H. Fukazawa, Y. Kohori, H. Harima and S. Uji: Phys. Rev. B 87 (2013) 224512.
- (13) F. Hardy, R. Eder, M. Jackson, D. Aoki, C. Paulsen, T. Wolf, P. Burger, A. Böhmer, P. Schweiss, P. Adelmann, R. A. Fisher, and C. Meingast: arXiv:1309.5654 (2013).
- (14) D. Shoenberg: Magnetic Oscillations in Metals (Cambridge University Press, Cambridge, 1984).
- (15) T. Terashima, M. Kimata, H. Satsukawa, A. Harada, K. Hazama, S. Uji, H. Harima, G.-F. Chen, J.-L. Luo and N.-L. Wang: J. Phys. Soc. Jpn. 78 (2009) 063702.