The UV view of multi spin galaxies: insight from SPH simulations
Abstract
The UV images of GALEX revealed that 303% of Early Type Galaxies (ETG) show UV emission indicating a rejuvenation episode. In ETGs with multiple spin components this percentage increases at 50%. We present here the characteristics of this sample and our smooth particle hydrodynamic (SPH) simulations with chemo-photometric implementation that provide dynamical and morphological information together with the spectral energy distribution (SED) at each evolutionary stage. We show our match of the global properties of two ETGs (e.g. NGC 3626 and NGC 5173). For these galaxies we can trace their evolutionary path.
1 Introduction
In the hierarchical scenario of structures formation and evolution, galaxy interactions and mergers are very common. One of the most impressive tracer of the merging event is the phenomenon of counter-rotation (see Galletta (1996) for a review). Counter-rotation is observed when two components of a galaxy rotate with opposite spin. This may happen in a portion or in the whole range of galaxy radius. The first examples of counter-rotation were found in ETGs but in the later years this phenomenon has been found in every morphological type of galaxy: Ellipticals, S0s, Spirals and even in irregular galaxies. Due to the large number and variety of cases found, the counter-rotating galaxies on the last years abandoned the category of “peculiar galaxies” to become examples of a phase of the evolution of many (or most) galaxies.
A current challenge is to disentangle the different evolutionary paths producing counter-rotating galaxy components. In particular the evolution of interstellar medium (ISM) in counter-rotating galaxies is quite complex since, in contrast with “native” gas whose evolution is essentially determined by the star formation rate, the evolution of the accreted gas depends on many independent parameters, like: i) the impact angle, ii) the relative orientation of the accreted gas and galaxy- spins and iii) the abundance of native gas. In order to provide a complete, self-consistent, picture of both galaxy evolution and dust properties, it is highly desirable to have a SED that entails the whole spectral range self-consistently with the galaxy evolution.
2 The chemo-photometric SPH simulations
To this purpose, we performed a large set of simulations of galaxy formation and evolution of isolated collapsing triaxial systems initially composed of dark matter and gas, as described in (Mazzei & Curir 2003), together with a large set of encounter simulations starting from the same initial conditions of haloes, using different impact parameters, total masses and spin orientations. Our simulations allow us to derive the global properties of interacting systems, in particular velocities and relative abundances of all the system components, i.e. the merger evolution.
The general prescriptions of chemo-photometric SPH simulations and the grid of the impact parameters explored, are reported in several previous papers (Mazzei et al. 2013; Bettoni et al. 2012). All the simulations include self–gravity of gas, stars and DM, radiative cooling, hydrodynamical pressure, shock heating, viscosity, SF, feedback both from evolved stars and type II SNe, and chemical enrichment. Simulations provide the synthetic SED, based on evolutionary population synthesis (EPS) models, at each evolutionary stage, i.e. at each snapshot. The time-step between each snapshot is 0.037 Gyr. The SED accounts for chemical evolution, stellar emission, internal extinction and re-emission by dust in a self-consistent way. This extends over four orders of magnitude in wavelength at least, i.e., from 0.06 to 1000 m. Simulations self-consistently provide morphological, dynamic and chemo- photometric evolution. All the model parameters had been tuned in previous papers where the integrated properties of simulated galaxies stopped at 15 Gyr, i.e. their colors, absolute magnitudes, mass to luminosity ratios, and metallicities had been successfully compared with those of local galaxies (Curir & Mazzei 1999; Mazzei & Curir 2003).
3 The Sample
Here we focus on two points: the (u-r) vs. color magnitude diagram and the fit of the SED. In the (u - r) vs. color magnitude diagram (CMD) (Baldry et al. 2004) early-type quiescent galaxies populate the red sequence and late-types, with active star formation, the blue one. The Galaxy Evolution Explorer (GALEX) satellite showed that a surprisingly high fraction (15%) of optically red SDSS ETGs exhibit strong UV excess (Yi et al. 2005). Later Donas et al. (2007) and Schawinski et al. (2007) showed that up to 303% of the ETGs imaged in the UV with GALEX have signatures of such rejuvenation episodes, even after excluding classical UV-upturn candidates. Considering the whole sample of galaxies with counter-rotation (Galletta 1996; Corsini & Bertola 1998) the percentage of ETGs with signatures of rejuvenation episodes in the nucleus and in the disk, jump at 50%. From this sample we selected a sub- sample in a local volume of 10 Mpc, that spans all the morphological sequence, from Spirals to ETGs, with available data from UV to near-IR. Here we present the results for two ETGs: NGC 3626 (S0/Sa) and NGC 5173 (E0).
4 Results
NGC 3626
This galaxy is the first early spiral (RSA classified it as S0) in which gas/star
counterrotation has been found (Ciri et al. 1995). Garcia-Burillo et al. (1998) found also a disk of
molecular gas counterrotating with respect to the stars. From our modeling
(Mazzei et al. 2013)
the galaxy age results 11.5 Gyr. The average stellar age within the effective
radius, re, is 4.3 Gyr and increases to 5.5 Gyr within R3re.
These age estimates become younger if stellar ages are weighted by the B-band
luminosity: 3.4 Gyr and 4.5 Gyr respectively. In the inner regions,
R1.5 kpc, stars are younger than 2 Gyr, in good agreement with the findings
of Sil’chenko et al. (2010). The star formation rate due to stars younger than
0.01 Gyr, is 2 /yr, in agreement with the radio estimates given by
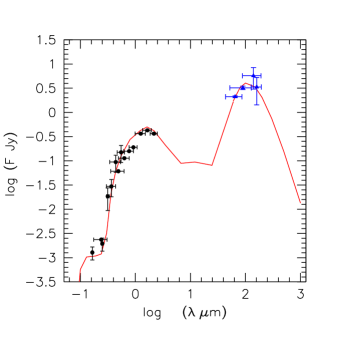
Bell (2003). Figure 1(left) compares our predictions with observations,
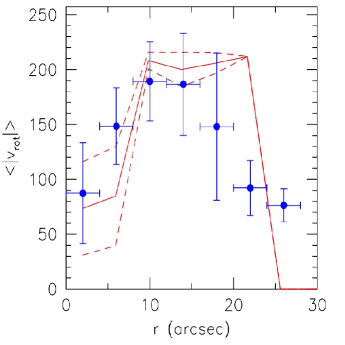
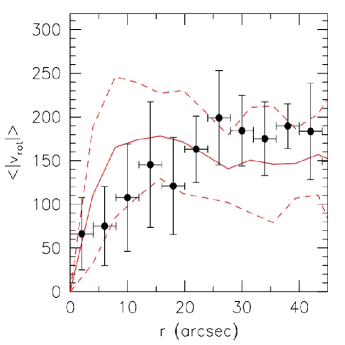
including new near-UV flux released from GALEX archive; see Mazzei et al. (2013) for more details. In Figure 2 we compare the observed star and gas rotation curves with the results of our simulations.
NGC 5173
In this E0 galaxy Kannappan & Fabricant (2001) found the gas/star counterrotation and in the
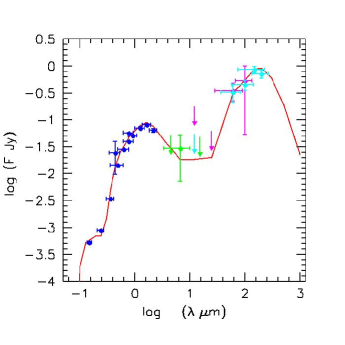
GALEX UV image it is visible a patchy FUV inner ring. The simulation which best-
fits its total SED (see Fig.1, right), from FUV to 200 m, total B absolute magnitude, MB=-
17.480.31 (from Hyperleda), and morphology at an age of 13.8 Gyr,
corresponds to a galaxy encounter with mass ratio 1:1, total mass 4 M⊙ and relative positions and velocities, r1=-
r2=888 kpc,
v1=-v2=61 km/s.
5 Conclusions
Our simulations trace the evolution of these galaxies along the blue sequence, which hosts them for about 7-8 Gyr, before they became mature and red ETGs after 4-5 Gyr they spent, in a significant part, in the so called green valley.
Acknowledgments
We acknowledge the partial financial support by contract ASI-INAF I/009/10/0, and the partial financial support by contract INAF/PRIN 2011 “Galaxy Evolution with the VLT Survey Telescope (VST)”.
References
- Baldry et al. (2004) Baldry, I. K., Glazebrook, K., Brinkmann, J., & et al. 2004, ApJ, 600, 681
- Bell (2003) Bell, E. F. 2003, ApJ, 586, 794
- Bettoni et al. (2012) Bettoni, D., Buson, L., Mazzei, P., & Galletta, G. 2012, MNRAS, 423, 2957
- Ciri et al. (1995) Ciri, R., Bettoni, D., & Galletta, G. 1995, Nat, 375, 661
- Corsini & Bertola (1998) Corsini, E. M., & Bertola, F. 1998, Journal of Korean Physical Society, 33, 574
- Curir & Mazzei (1999) Curir, A., & Mazzei, P. 1999, New Astronomy, 4, 1
- Donas et al. (2007) Donas, J., Deharveng, J.-M., Rich, R. M., & et al. 2007, ApJS, 173, 597
- Galletta (1996) Galletta, G. 1996, in IAU Colloq. 157: Barred Galaxies, edited by R. Buta, D. A. Crocker, & B. G. Elmegreen, vol. 91 of Astronomical Society of the Pacific Conference Series, 429
- Garcia-Burillo et al. (1998) Garcia-Burillo, S., Sempere, M. J., & Bettoni, D. 1998, ApJ, 502, 235
- Haynes et al. (2000) Haynes, M. P., Jore, K. P., Barrett, E. A., Broeils, A. H., & Murray, B. M. 2000, AJ, 120, 703
- Kannappan & Fabricant (2001) Kannappan, S. J., & Fabricant, D. G. 2001, AJ, 121, 140. astro-ph/0009234
- Mazzei & Curir (2003) Mazzei, P., & Curir, A. 2003, ApJ, 591, 784
- Mazzei et al. (1994) Mazzei, P., de Zotti, G., & Xu, C. 1994, ApJ, 422, 81. astro-ph/9310052
- Mazzei et al. (2013) Mazzei, P., Marino, A., Rampazzo, R., Galletta, G., & Bettoni, D. 2013, ArXiv e-prints. 1306.0777
- Mazzei et al. (1992) Mazzei, P., Xu, C., & de Zotti, G. 1992, A&A, 256, 45
- Schawinski et al. (2007) Schawinski, K., Kaviraj, S., Khochfar, S., & et al. 2007, ApJS, 173, 512
- Sil’chenko et al. (2010) Sil’chenko, O. K., Moiseev, A. V., & Shulga, A. P. 2010, AJ, 140, 1462. 1010.2716
- Temi et al. (2004) Temi, P., Brighenti, F., Mathews, W. G., & Bregman, J. D. 2004, ApJS, 151, 237
- Xilouris et al. (2004) Xilouris, E. M., Madden, S. C., Galliano, F., Vigroux, L., & Sauvage, M. 2004, A&A, 416, 41
- Yi et al. (2005) Yi, S. K., Yoon, S.-J., Kaviraj, S., & et al. 2005, ApJ, 619, L111