Na Slovance 2, CZ-18221 Praha, Czech Republic
and Center for theoretical study, Jilská 1, Praha, Czech Republic
Dynamical phase transitions in Hegselmann-Krause model of opinion dynamics and consesus
Abstract
The dynamics of the model of agents with limited confidence introduced by Hegselmann and Krause exhibits multiple well-separated regimes characterised by the number of distinct clusters in the stationary state. We present indications that there are genuine dynamical phase transitions between these regimes. The main indicator is the divergence of the average evolution time required to reach the stationary state. The slowdown close to the transition is connected with the emergence of the groups of mediator agents which are very small but have decisive role in the process of social convergence. More detailed study shows that the histogram of the evolution times is composed of several peaks. These peaks are unambiguously interpreted as corresponding to mediator groups consisting of one, two, three etc. agents. Detailed study reveals that each transition possesses also an internal fine structure.
pacs:
89.65.-sSocial and economic systems and 05.40.-a Fluctuation phenomena, random processes, noise, and Brownian motion and 02.50.-r Probability theory, stochastic processes, and statistics1 Introduction
Formation of consensus is one of the most studied topics in the field of sociophysics. It was the subject of the early paper by Callen and Shapero cal_sha_74 (which was originally intended as a contribution to the Moscow seminar banned by the Communist authorities chi_ste_75 ). The early attempts to apply the ideas of synergetics to social phenomena were driven by similar ideas weidlich_91 . Consensus was in the centre of the papers of Galam gal_gef_sha_82 ; galam_86 ; gal_mos_91 , who revived the term “sociophysics” and made it known to general audience galam_04c . For recent reviews, see e. g. cas_for_lor_07 ; slanina_09a .
The consensus models can be divided into two well-defined groups. The models of the first type assume that the agents can choose among a small number of discrete opinions. The simplest case is the binary choice, studied in the voter liggett_99 , Galam galam_86 ; galam_90 ; galam_99 ; galam_00 , Sznajd szn_szn_00 ; sta_deo_02 ; beh_sch_03 ; sla_lav_03 ; kru_szn_05 ; sla_szn_prz_08 ; lam_red_08 , and majority-rule models kra_red_03 ; mob_red_03 .
The second type of models acknowledges that the opinion of the agents may stretch on a continuous line (or a space of any dimensionality and structure). The opinions evolve in time by attraction, i. e. the agents shift their position in the opinion space towards areas where other agents are already concentrated. Assuming that this dynamics is linear, DeGroot degroot_74 introduced the model of opinion convergence in which the opinions in the next time step are linear combinations of the original opinions. The conditions required for reaching consensus were clarified in stabilization theorems degroot_74 ; berger_81 . Essentially, the statement is that if the agents form a network of interactions which is a single connected cluster, the system always reaches full consensus. The only case in which different opinions survive in the stationary state is the trivial one, when the agents split into several clusters with no communication whatsoever. This is certainly an exaggerated view of the society as we know it.
The fundamental ingredient missing in the model of DeGroot was the limited (or bounded) confidence. It is based on a rather trivial observation that people who differ too much in their opinions are unable to force the partner shift her opinion and unwilling to make themselves a tiniest step towards the opponent. The opinions are frozen, if they are incompatible. Within discrete-opinion models this idea was excellently implemented in the Axelrod model axelrod_97 ; cas_mar_ves_00a ; kle_egu_tor_mig_02 ; vaz_kra_red_02 ; kle_egu_tor_mig_03a ; kle_egu_tor_mig_03b ; vaz_red_04 ; jacobmeier_05 ; kle_egu_tor_mig_05 ; gon_cos_tuc_05 ; kuperman_06 ; gon_egu_cos_etal_06 ; vaz_red_06 , while for continuous opinions, bounded confidence was introduced within the model of Deffuant et al. def_nea_amb_wei_00 ; wei_def_amb_nad_01 . Contrary to the parallel and linear dynamics of DeGroot, the dynamics in Deffuant et al. model is stochastic. In each step, a pair of agents is chosen at random and their opinions are shifted towards each other, on condition that they do not differ more than the confidence threshold . This model was investigated very thoroughly def_amb_wei_fau_02 ; benn_kra_red_02 ; stauffer_02 ; sta_sou_sch_03 ; weisbuch_04 ; sta_mey_04 ; def_amb_wei_04 ; amb_def_04 ; assmann_04 ; fortunato_04 ; fortunato_05 ; wei_def_amb_05 both by simulations of finite systems and by numerical solution of the partial integro-differential equation corresponding to infinite-size limit. It was found that the ultimate stationary regime is a combination of -peaks in the distribution of opinions. A single peak means full consensus, while multiple peaks imply breaking the society into several non-communicating groups. There is a sequence of sharp transitions between regimes of one, two, three, etc. peaks, at critical values of the confidence threshold. Numerical estimates suggest that the transition from full consensus to multiple peaks occurs at . However, the side peaks only gain macroscopic weight at another critical value benn_kra_red_02 ; fortunato_04 ; lorenz_07 .
While the model of Deffuant et al. uses sequential stochastic dynamics, the model of Hegselmann and Krause (HK) heg_kra_02 is more close to the original DeGroot model. The randomness enters only in the initial condition and further evolution is deterministic. In each step, the new values of the opinion variable are linear combinations of those opinions, which are not farther than the confidence threshold. From the uniformly random initial condition, one or several groups of identical opinions evolve. Contrary to the Deffuant et al. model, the absorbing state (i. e. such that none of the opinions can change any more) is reached after finite number of steps, provided the number of agents is finite. The HK model was investigated both by simulations and by solution of corresponding partial integro-differential equation lorenz_07 ; plu_lat_rap_05 ; fortunato_04b ; fortunato_04a ; fortunato_05a ; fortunato_05b ; for_sta_05 ; for_lat_plu_rap_05 ; heg_kra_06 ; lorenz_07a ; lorenz_08 ; lorenz_08a . Numerically, it was found that the transition to full consensus appears around the critical value fortunato_05a . A smart way of discretization the integro-differential equation, called interactive Markov chain lorenz_07a ; lorenz_08 ; lorenz_08a ; lorenz_06 ; lorenz_07b , provides two conflicting results for the consensus transition. For odd number of discretization intervals, the answer is lorenz_07 ; lorenz_07a , while for even number of intervals one gets for_lat_plu_rap_05 ; lorenz_07a . Later, we shall mention arguments indicating that the correct discretization is with odd number of intervals. The advantage of the approach using interactive Markov chains is that in enables proving stabilization theorems on the HK dynamics lorenz_05 ; lorenz_07c ; lor_lor_08 .
Various modifications of Deffuant et al. and HK models were investigated. For example, a model which interpolates between Deffuant et al. and HK was introduced urb_lor_07 . Heterogeneous confidence thresholds lorenz_08 ; lag_abr_zan_04 , influence of extremists def_amb_wei_fau_02 ; por_bol_sti_07 and presence of a “true truth” heg_kra_06 ; malarz_06 were studied. Introduction of multi-dimensional opinion space wei_def_amb_nad_01 ; for_lat_plu_rap_05 ; lorenz_06 ; lag_abr_zan_03 is also a natural generalization. Interestingly, introduction of noise into the dynamics alters the behaviour profoundly pin_tor_her_09 . This might be interpreted so that HK and Deffuant et al. models follow a strictly zero-temperature dynamics, which is unstable with respect to noise.
The aim of this paper is to investigate in detail the transitions from full consensus to state with two groups, to state with three, four etc. groups. Especially, we show in detail the phenomenon of critical slowdown, already hinted in for_lat_plu_rap_05 ; lorenz_06 ; urb_lor_07 and show how it is related to the presence of mediators, introduced on an intuitive level in lorenz_07b .
2 Phases in the Hegselmann-Krause model
2.1 Definitions
Let us first recall the definition of the HK model. The system consists of agents. The opinion of agent at time is a number . Thus, the state of the system is described by the -component vector . The evolution of the state vector in discrete time is deterministic and seemingly linear
| (1) |
but the mixing matrix is not constant, but depends on the actual state . The dependence is dictated by the principle of bounded confidence. If is the confidence threshold, then
| (2) |
where the normalization factor is the number of agents not farther than from the agent , . As the initial condition, we choose set of independent random values , uniformly distributed in the interval .
The dynamics (1), (2) has infinite number of absorbing states. They can be classified according to the number of non-communicating clusters. The state with clusters is characterised by numbers such that and . The smallest for which is an absorbing state will be called consensus time and denoted .
As the initial condition is random, the time to reach an absorbing state as well as the number of clusters in that state are also random variables. We shall be mainly interested in the mean values and , averaged over initial conditions.
2.2 Which absorbing state?
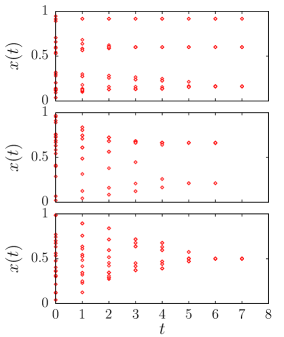
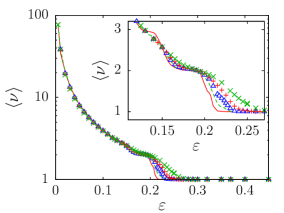
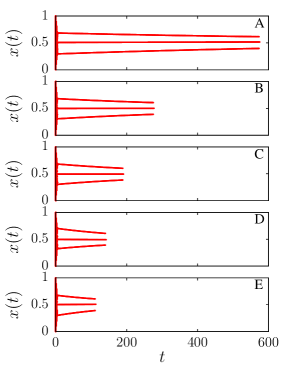
The number of clusters in the absorbing state depends mainly on the confidence threshold , but also on the initial condition. We show in Fig. 1 three typical examples. For large enough the evolution ends in a state with single cluster, while for smaller the resulting differs according to the configuration of opinions at the beginning. If we average the final number of clusters, we observe a decreasing function of , as shown in Fig. 2. A more detailed look (see the inset in Fig. 2) shows that for increasing number of agents, well-defined plateaus develop at integer values of , separated by steps which become sharper for increasing and we may conjecture that discontinuities emerge for at critical values , , etc. From Fig. 2) we can estimate the first two of them as , .
2.3 Critical slowing down
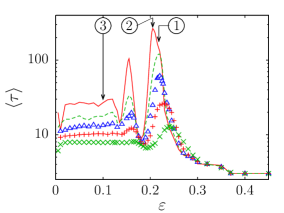
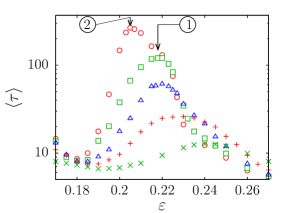
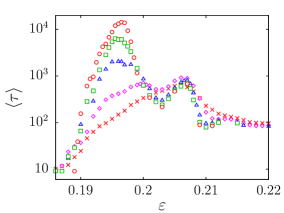
The critical values mark dynamical phase transitions from regime with clusters in absorbing state to clusters. It is very questionable if the notions of first-order versus continuous phase transitions can be transferred from equilibrium to non-equilibrium transitions. However, we can study certain features, which are distinctive in equilibrium, also in non-equilibrium case. One of them is the slowdown of the dynamics close to the critical point. This is a signature of continuous transition. In HK model, we can measure the average time to reach an absorbing state as a function of , and indeed, we observe peaks located at the transition regions, as seen in Fig. 3. The height of the peaks increases with the number of agents, which suggests diverging time at the transition points. The overall picture emerging from these results seems to be the following. In HK model in the limit , we have a sequence of phases characterised by one, two, three. etc. clusters in the absorbing state which is the result of the dynamics. The phase transitions occur at confidence thresholds , etc, where the average number of clusters jumps discontinuously between two integer values, and where the average consensus time diverges. Having this in mind, we can consider the phase transitions second-order. In the following sections we shall see that the phase transitions in HK model are even more subtle than that.
3 How the absorbing state is reached
From now on, we shall concentrate on the first of the sequence of transitions, where the full consensus ends. We show in Figs 4 and 5 details of the -dependence of average number of clusters and average time to reach an absorbing state, respectively.
We can see in Fig. 4 that increasing results in decrease of in the transition region. (We shall defer the sociological perspective of this phenomenon to the Conclusions.) The transition becomes steeper, but the inflexion point is shifted leftwards. Similarly, in Fig. 5 we observe that the peak not only grows when number of agents increases, but shifts quite markedly to lower values of . The vales of inferred from the finite- results must be considered as upper bounds to the true critical value valid in the thermodynamic limit.
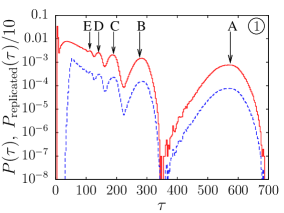
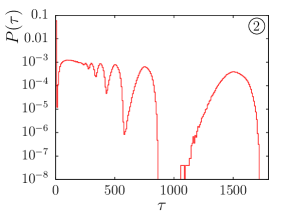
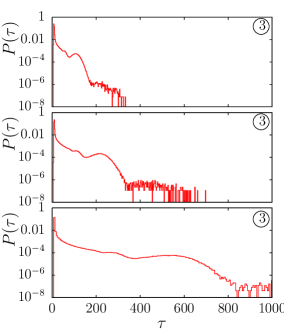
We can gain further insight into the divergence of consensus time at the transition, if we plot the histogram of times to reach an absorbing state for values of close to the maximum of the peak in . We show the results for at and for at , in Figs. 6 and 7, respectively. The characteristic feature of the histograms is a sequence of peaks. The height of the peaks is nearly the same, especially for larger . For comparison, we plot in Fig. 8 the histogram of consensus times for , far from any major peak in . There are barely visible traces of peaks, but as the system size increases, the histogram becomes flat, contrary to the transition region, where the peaks in the histogram become more pronounced. Therefore, the peaks in the histogram are tightly related to the divergence of consensus time at the transition.
As a next step, we must ask what is the origin of the peaks. The emergence of the peaks implies that there are certain typical lengths of the evolution from the initial condition to the absorbing state. We naturally expect that the typical lengths correspond to typical structural features of the evolution. To see that, we show in Fig. 9 spatio-temporal diagrams of the evolution of the system for five principal peaks in the histogram. The consensus times are indicated by letters A to E in Fig. 6 and the corresponding panels in Fig. 9 are denoted by the same letters. We can see immediately a common feature of all these five samples. After a very short transient period, three clusters are formed, one of them close to the exact middle and two of them on the wings. The latter are slowly attracted to the central cluster, until their distance falls below . Then, all three collapse into a single cluster and an absorbing state with full consensus is reached.
Neglecting the very short transient, the consensus time is given by the time needed to attract the wing clusters to the distance . We assume that the middle cluster contains “mediator” agents and is located at , while the other groups are equal in size and are located initially at . The middle cluster does not move and the wing clusters evolve according to the difference equation
| (3) |
For the dynamics is very slow and we can replace the difference in (3) by derivative. Hence, the consensus time is estimated as
| (4) |
Since the initial condition must be , otherwise the clusters would never coalesce, and , we get a strict upper bound to the consensus time, provided the mechanism of three clusters is in force
| (5) |
Indeed, we can see that the histograms in Figs. 6 and 7 obey the bound (5).
The width of the peaks in the histogram is due to the fluctuations in the initial positions of the wing clusters. The peaks differ only in the number of mediators. Indeed, the evolution patterns A to E in Fig. 9 are observed for number of mediators . Comparing that with Fig. 6, where the peaks are denoted by corresponding letters A to E, we clearly see that the peak at longest consensus has , the second has etc. This fact suggests, that the peaks for can be obtained by replication the peak at . Denoting the latter peak only, we approximate the full distribution of consensus times by
| (6) |
This approximation assumes that all sizes of the mediator group up to have the same probability and neglect the influence of the initial short transient. Therefore, it is reasonably accurate for a few highest peaks, but fails at short , as it is confirmed in Fig. 6.
Let us also note that the mechanism of mediators located in the middle explains why, in the numerical solution of the partial differential equation for HK model, the discretization into even number of equally-sized intervals is wrong. Indeed, in this case the mediator cluster is located just at the border of two intervals, however fine the discretization is, and this induces numerical artifacts into the results.
4 Fine structure of the transitions
We already noted that the dependence of on is not like the dependence of average magnetization on temperature, as seen in simulations of finite-size Ising model. The transition region is not only squeezed into more narrow region, but is also shifted to lower . The same is observed also in . When the system size grows, the peaks do not simply grow and get thinner, but are also shifted to lower , consistently with the behaviour of . Let us look at this shifting of peaks in more detail.
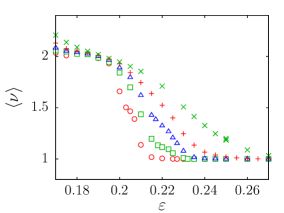
To this end, we performed simulations of fairly large systems (up to ) in the range of which covers the transition from the full consensus phase () to the phase with two clusters (). The picture which emerges, is demonstrated in Figs. 10 and 11. It is somewhat surprising that the peaks in only apparently move. Closer look at Fig. 10 reveals that a peak at certain value of remains at the same position when grows, but a new peak starts growing at somewhat smaller . When this second peak reaches some height, it saturates and another peak is born and grows at even smaller . In this way, older peaks do not depend on any more, but rather are overgrown by new ones. To our knowledge, this effect has no analogy in equilibrium phase transitions and is entirely related to dynamical nature of the transition in HK model.
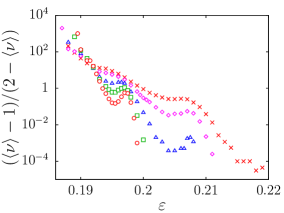
Similar fine structure of the transition region is observed on the dependence of average number of clusters on . In the transition region, it drops from to . To make the details more visible, we plot the quantity , instead of , in logarithmic scale. In Fig. 11 we can see that drops from to in step-wise manner. For we observe plateaus, or regions of , where the average number of clusters is nearly constant somewhere between and . When the system size grows, these steps, or plateaus, diminish in the value of but keep their width. Moreover, the edges of the steps decrease more slowly, so that the dependence of on becomes non-monotonous and the “plateaus” have depression in the middle. Interestingly, the peaks in are located just next to the right edges of these “plateaus”. We assume that the sequence of the peaks in and plateaus in tends to a point , which is the location of the true phase transition in the limit . Form the data in Figs. 10 and 11 we can estimate .
Comparing Figs. 10 and 11 we can see that the non-monotonous dependence of on goes hand in hand with the multiple-peak dependence of on . We do not have a detailed account for this phenomenon, but the following scenario seems plausible.
The behaviour in the transition region is dominated by the slow evolution of three-cluster system, as described above. The existence of full consensus depends on emergence of the mediator group. In other words, the average number of clusters is related to the probability that the mediator group is empty, as , as long as more than two clusters in the absorbing state occur with negligible probability. We suppose that for given and very large the fraction of agents in the mediator group approaches a limit . As the full consensus is only possible if , we may consider as order parameter of the non-equilibrium phase transition in HK model. The location of the transition is determined by .
We also assume that a “master” probability distribution exists , independent of and , so that the probability distribution for is
| (7) |
The parameter stands for the average size of the mediator group, so . We do not have direct access to the distribution in simulations. In absence of any other information we hay hypothesise that the distribution might be Poissonian, . According to (4) and assuming that is proportional to , we have the estimate
| (8) |
The upper bound for the size of the mediator group can be safely extended to infinity. For fixed (and therefore fixed ) and the average consensus time approaches a limit which is proportional to . On the other hand, for fixed and variable , the dependence of according to (8) develops a maximum as a function of . The location of the maximum shifts when grows as . This way, the location of the peak in approaches as .
If the fraction of agents in the mediator cluster was a monotonous function of , with at the critical point , we would see a peak in growing and shifting gradually to lower values of , up to its asymptotic position at the critical point. Then, also would be a monotonously decreasing function of . However, we can see violation of this monotonicity in Fig. 11. Therefore, is not a monotonous function of , which explains both the non-monotonicity of and the fact that multiple peaks appear in , instead of observing smooth shift and growth of a single peak. The non-monotonicity imposes a deformation on the otherwise smooth growth and shift of the peak in . This deformation results in apparent emergence of new peaks next to the older ones. In fact, as long as the approximation is justified, the non-monotonicity in is directly visible in non-monotonicity, i. e. multiple-peak structure, of , close to the critical point.
However, the key ingredient of the whole phenomenon of fine structure of the transition, which is the non-monotonicity of remains unexplained. Clearly, it relies on the processes happening within the relatively short transient period. The three-cluster structure, i. e. two wings plus mediators, is formed in this period and and the distribution of the number of mediators is established, which we assumed, for simplicity, to have the form , but actually can be more complex.
5 Conclusions
We investigated in detail phase structure of the Hegselmann-Krause model of consensus formation. The only parameters of the model are confidence threshold and number of agents. The dynamics is deterministic, but the initial condition is random. We found that, depending on the value of the confidence threshold, well-defined phases exist, characterised by the number of non-communicating clusters in the absorbing state. This number is one in full consensus phase, while it is two, three, etc. in phases lacking full consensus among all agents, but exhibiting consensus within the clusters. The phases are separated by dynamical phase transitions, characterised by divergence of the time needed to reach the absorbing state, reminiscent of critical slowing down known from second order equilibrium phase transitions.
The mechanism which leads to the divergence of characteristic time at the phase transition is related to the emergence of a group of mediators, i. e. a small cluster in the middle of the opinions, which is able to attract the two clusters on the left and right wings from the mediators. The mediator cluster can be arbitrarily small, but non-empty. One single mediator is able to attract arbitrarily large wing clusters, if they are located initially within the confidence threshold. The attraction is the slower the larger the wing clusters are, but typically close to the transition the wing clusters contain nearly all the agents, while the fraction contained in the mediator cluster is tiny. Hence the divergence of the time needed to reach the absorbing state, when the system size grows. This mechanism is reflected also in the histogram of times to reach consensus, which exhibits a characteristic series of peaks. Each of the peaks corresponds to a specific number of agents in the mediator group, which is one for the farthest peak, two for the next one, etc.
The most surprising feature of the dynamical phase transition in HK model is its fine structure. In the transition region, the average time to reach absorbing state, as a function of the confidence threshold, exhibits not just a growing peak when system size grows. The peak is also shifted towards lower values, in a complex manner. Apparently, the peak grows with system size until saturation, and then a new peak starts growing at a lower value of the confidence threshold. Thus, a series of peaks, overgrowing each other, emerges. We assume that the positions of the peaks tend to a limit which is the location of the phase transition in the infinite-size limit.
If we interpret the results obtained in terms of the (hypothetical) average fraction of agents in the mediator cluster, we come to conclusion that this quantity must be a non-monotonous function of the confidence threshold in the transition region. If it were monotonous, the peak in the average time to reach absorbing state would continuously shift towards lower values when system size grows. But non-monotonicity of the average size of the mediator cluster imposes a deformation on this shift, which looks like new peaks were born next to older ones. However, we must admit that the non-monotonicity of the average fraction of agents in the mediator cluster remains unexplained.
Finally, let us make one sociological observation. In the transition region from full consensus phase, the average number of clusters in the absorbing state reflects the probability to reach consensus. When the system size grows, with confidence threshold fixed, the probability of consensus increases. More agents are more likely to reach consensus at the end. It is easy to understand this phenomenon in terms of the mediators. In a larger system of agents the probability to get non-empty mediator group is larger. Because this tiny mediator group is vital for consensus, it is easier to reach consensus in larger society. It is a challenge to experimental sociologists to test this prediction in reality.
Acknowledgements.
This work was carried out within the project AV0Z10100520 of the Academy of Sciences of the Czech republic and was supported by the MŠMT of the Czech Republic, grant no. OC09078 and by the Research Program CTS MSM 0021620845.References
- (1) E. Callen and D. Shapero, Phys. Today 23 (July 1974).
- (2) N. A. Chigier and E. A. Stern (Editors), Collective phenomena and the applicatios of physics to other fields of science (Brain Research Publications, Fayetteville, 1975).
- (3) W. Weidlich, Physics Reports 204, 1 (1991).
- (4) S. Galam, Y. Gefen, and Y. Shapir, J. Math. Sociol. 9, 1 (1982).
- (5) S. Galam, J. Math. Psychol. 30, 426 (1986).
- (6) S. Galam and S. Moscovici, Eur. J. Soc. Psychol. 21, 49 (1991).
- (7) S. Galam, Physica A 336, 49 (2004).
- (8) C. Castellano, S. Fortunato, and V. Loreto, Rev. Mod. Phys. 81, 591 (2009).
- (9) F. Slanina, in: Encyclopedia of Complexity and Systems Science, 8379 (Springer, New York, 2009).
- (10) T. M. Liggett, Stochastic Interacting Systems: Contact, Voter, and Exclusion Processes (Springer, Berlin, 1999).
- (11) S. Galam, J. Stat. Phys. 61, 943 (1990).
- (12) S. Galam, Physica A 274, 132 (1999).
- (13) S. Galam, Physica A 285, 66 (2000).
- (14) K. Sznajd-Weron and J. Sznajd, Int. J. Mod. Phys. C 11, 1157 (2000).
- (15) D. Stauffer and P. M. C. de Oliveira, cond-mat/0208296.
- (16) L. Behera and F. Schweitzer, Int. J. Mod. Phys. C 14, 1331 (2003).
- (17) F. Slanina and H. Lavička, Eur. Phys. J. B 35, 279 (2003).
- (18) S. Krupa and K. Sznajd-Weron, Int. J. Mod. Phys. C 16, 177 (2005).
- (19) F. Slanina, K. Sznajd-Weron and P. Przybyła, Europhys. Lett. 82, 18006 (2008).
- (20) R. Lambiotte and S. Redner, Europhys. Lett. 82, 18007 (2008).
- (21) P. L. Krapivsky and S. Redner, Phys. Rev. Lett. 90, 238701 (2003).
- (22) M. Mobilia, S. Redner, Phys. Rev. E 68, 046106 (2003).
- (23) M. H. DeGroot, Journal of the American Statistical Association 69, 118 (1974).
- (24) R. L. Berger, Journal of the American Statistical Association 76, 415 (1981).
- (25) R. Axelrod, J. Conflict Resolution 41, 203 (1997).
- (26) C. Castellano, M. Marsili, and A. Vespignani, Phys. Rev. Lett. 85, 3536 (2000).
- (27) K. Klemm, V. M. Eguíluz, R. Toral, and M. San Miguel, cond-mat/0210173.
- (28) F. Vazquez, P. L. Krapivsky, and S. Redner, J. Phys. A: Math. Gen. 36, L61 (2003).
- (29) K. Klemm, V. M. Eguíluz, R. Toral, and M. San Miguel, Physica A 327, 1 (2003).
- (30) K. Klemm, V. M. Eguíluz, R. Toral, and M. San Miguel, Phys. Rev. E 67, 045101 (2003).
- (31) F. Vazquez and S. Redner, J. Phys. A: Math. Gen. 37, 8479 (2004).
- (32) D. Jacobmeier, Int. J. Mod. Phys. C 16, 633 (2005).
- (33) K. Klemm V. M. Eguíluz, R. Toral, and M. San Miguel, Journal of Economic Dynamics and Control 29, 321 (2005).
- (34) J. C. González-Avella, M. G. Cosenza, and K. Tucci, Phys. Rev. E 72, 065102 (2005).
- (35) M. N. Kuperman, Phys. Rev. E 73, 046139 (2006).
- (36) J. C. González-Avella, V. M. Eguíluz, M. G. Cosenza, K. Klemm, J. L. Herrera, and M. San Miguel, Phys. Rev. E 73, 046119 (2006).
- (37) F. Vazquez and S. Redner, Europhys. Lett. 78, 18002 (2007).
- (38) G. Deffuant, D. Neau, F. Amblard, and G. Weisbuch, Adv. Compl. Syst. 3, 87 (2000).
- (39) G. Weisbuch, G. Deffuant, F. Amblard, and J. P. Nadal, cond-mat/0111494.
- (40) G. Deffuant, F. Amblard, G. Weisbuch, and T. Faure, J. Artif. Soc. Soc. Simulation 5, 4 http://jasss.soc.surrey.ac.uk/5/4/1.html (2002).
- (41) E. Ben-Naim, P. L. Krapivsky, and S. Redner, Physica D 183, 190 (2003).
- (42) D. Stauffer, Int. J. Mod. Phys. C 13, 315 (2002).
- (43) D. Stauffer, A. O. Sousa, and C. Schulze, cond-mat/0310243.
- (44) G. Weisbuch, Eur. Phys. J. B 38, 339 (2004).
- (45) D. Stauffer and H. Meyer-Ortmanns, J. Mod. Phys. C 15, 241 (2004).
- (46) G. Deffuant, F. Amblard, and G. Weisbuch, cond-mat/0410199.
- (47) F. Amblard, and G. Deffuant, Physica A 343, 725 (2004).
- (48) P. Assmann, Int. J. Mod. Phys. C 15, 1439 (2004).
- (49) S. Fortunato, Int. J. Mod. Phys. C 15, 1301 (2004).
- (50) S. Fortunato, Int. J. Mod. Phys. C 16, 17 (2005).
- (51) G. Weisbuch, G. Deffuant, and F. Amblard, Physica A 353, 555 (2005).
- (52) J. Lorenz, Int. J. Mod. Phys. C 18, 1819 (2007).
- (53) R. Hegselmann and U. Krause, J. Artif. Soc. Soc. Simulation 5, http://jasss.soc.surrey.ac.uk/5/3/2.html (2002).
- (54) A. Pluchino, V. Latora, and A. Rapisarda, Eur. Phys. J. B 50, 169 (2006).
- (55) S. Fortunato, Int. J. Mod. Phys. C 15, 1021 (2004).
- (56) S. Fortunato, Physica A 348, 683 (2005).
- (57) S. Fortunato, Int. J. Mod. Phys. C 16, 259 (2005).
- (58) S. Fortunato, cond-mat/0501105.
- (59) S. Fortunato and D. Stauffer, in: Extreme Events in Nature and Society, Eds. S. Albeverio, V. Jentsch, and H. Kantz, p. 233 (Springer, Berlin, 2006).
- (60) S. Fortunato, V. Latora, A. Pluchino, and A. Rapisarda, Int. Jour. Mod. Phys. C 16, 1535 (2005).
- (61) R. Hegselmann and U. Krause, J. Artif. Soc. Soc. Simulation 9, http://jasss.soc.surrey.ac.uk/9/3/10.html (2006).
- (62) J. Lorenz, arXiv:0708.3293 (2007).
- (63) J. Lorenz, Complexity 15, No. 4, p. 43 (2010).
- (64) J. Lorenz, arXiv:0806.1587 (2008).
- (65) J. Lorenz, European Journal of Economic and Social Systems 19, 213 (2006).
- (66) J. Lorenz, thesis, Universität Bremen (2007).
- (67) J. Lorenz, Physica A 355, 217 (2005).
- (68) J. Lorenz, in: Positive Systems, Lecture Notes in Control and Information Sciences, Vol. 341, 209 (Springer, Berlin, 2006).
- (69) J. Lorenz and D. A. Lorenz, IEEE Transactions on Automatic Control 55, 1651 (2010).
- (70) D. Urbig and J. Lorenz, in: Proceedings of the Second Conference of the European Social Simulation Association (ISBN 84-688-7964-9) (2004).
- (71) M. F. Laguna, G. Abramson, and D. H. Zanette, Complexity 9, No. 4 p. 31 (2004).
- (72) M. Porfiri, E. M. Bollt, and D. J. Stilwell, Eur. Phys. J. B 57, 481 (2007).
- (73) K. Malarz, Int. J. Mod. Phys. C 17, 1521 (2006).
- (74) M. F. Laguna, G. Abramson, and D. H. Zanette, Physica A 329, 459 (2003).
- (75) M. Pineda, R. Toral and E. Hernández-García, J. Stat. Mech. P08001 (2009).