QCD at non-zero temperature and magnetic field
Abstract:
A status of lattice QCD thermodynamics, as of 2013, is summarized. Only bulk thermodynamics is considered. There is a separate section on magnetic fields.
1 Crossover, transition temperature and equation of state
Three results in lattice QCD thermodynamics matured to a well-established status in recent years: the nature of the transition, the transition temperature and the equation of state. This means, that all systematic uncertainties have either been eliminated or are kept under control. The computations use physical values for the quark masses, a continuum extrapolation is carried out from upto five different lattice spacings and different physical volumes are used to control the finite size error. The only point of concern, that all these results are obtained with staggered fermions. Though there is currently no sign, that in these observables the use of staggered fermions would cause any problems, it is highly desirable to have cross-checks using other fermion formulations.
1.1 Crossover
The transition from the low temperature hadron dominated phase to the high temperature quark-gluon plasma is a crossover [1]: there is no singularity in the transition region. The chiral susceptibility peak is shown on Figure 1 in the transition region for three different volumes. The height and the width of the peak remains constant, as one increases the volume, no diverging behaviour is seen, which is the characteristic of a crossover transition.

1.2 Transition temperature
In a crossover there is no single critical temperature, which would separate the two phases of matter. Transition temperatures, ’s can still be defined as characteristic points (peak position or inflection point) of observables. Different observables can in general give different transition temperature values, this is a feature of the crossover transition. A particularly interesting is the one defined as the peak position of the chiral susceptibility. Its value was highly disputed, a consensus about its value has only been reached recently:
Back in 2006 the Bielefeld-Brookhaven-Columbia-Riken collaboration, which later merged with part of the MILC collaboration and formed the hotQCD, was reporting considerably larger values for this transition temperature [6]. The reason is now widely accepted: the lattice artefacts on the lattices, that were used in [6], were very large. This is demonstrated on Figure 2. The 2006 continuum extrapolation is the red line, which was carried out using the two coarsest lattices and resulted in MeV. Adding a finer lattice changed the continuum extrapolation, this is the blue line, which decreased the value of the transition temperature significantly.

1.3 Equation of state
In 2013 the 2+1 flavor equation of state has also become member of the “the continuum extrapolated results with physical quark masses” club [9]. The trace anomaly and the pressure are shown on the upper and lower panel of Figure 3. Both are consistent with the Hadron Resonance Gas model for small temperatures. The following parameterization describes the trace anomaly as the function of the temperature
where and the coefficients are:
| 2+1 | 0.1396 | -0.1800 | 0.0350 | 1.05 | 6.39 | -4.72 | -0.92 | 0.57 |


A full result in the 2+1 flavor case, although it neglects the charm quark contribution was necessitated by a discrepancy: there was a 20% difference in the peak height of the trace anomaly between the hotQCD data and the WB data from 2010 [10]. The WB group has confirmed their previous equation of state calculation by improving it in many ways, as was described by Krieg in his talk [9]. These include a continuum extrapolation from five different lattice spacings, an improved determination of the zero point of the pressure, an improved systematic error determination and a cross-check with a somewhat different staggered action. The updated WB results are in complete agreement with those from 2010. There was no update from the hotQCD group, so the discrepancy still remains to be resolved.
A 2+1 flavor result cannot be considered as the final one, due to the omission of the charm quark, which becomes important for high enough temperatures. An estimate of the 2+1+1 flavor trace anomaly, which is based on partial quenching the charm quark, is given by the same formula as before with the following parameters [10]:
| 2+1+1 | 0.1396 | -0.1800 | 0.0350 | 5.59 | 7.34 | -5.60 | 1.42 | 0.50 |
Several groups are now carrying out simulations with a dynamical charm quark. One of them is the MILC collaboration, who use highly improved staggered quarks down to a pion mass of 300 MeV, the results were presented by Bazavov [11]. The tmfT collaboration utilizes twisted mass quarks, down to a pion mass of 400 MeV, as was described by Burger [12]. Note, that although these simulations are done at more than one lattice spacings, the results are not yet continuum extrapolated.
An achievement of recent years, which is important from theoretical point of view, is that lattice simulations can be run at such high temperatures, where a connection to perturbation theory is possible. In pure Yang-Mills theory this is now done [13].
2 Fluctuations
Baryon number (), electric charge () and strangeness () fluctuations have become major topics in QCD thermodynamics. They are defined by differentiating the partition function with respect to the baryon, charge and strange chemical potentials:
In the lattice community these quantities are better known as quark number susceptibilities, they have been being calculated on the lattice since more than a decade now. The calculation poses significant numerical challenges: not only the number of terms increases with the number of derivatives, but so does the cancellation between these terms. The rule of thumb, that the volume increases the statistics and helps reducing the noise does not apply to fluctuations. For higher than second order fluctuations increasing the volume actually makes the signal worse for a fixed number of configurations. Currently there are continuum extrapolated results for all second order fluctuations [14, 15] and for some fourth order ones [16, 17], including the baryon number kurtosis. There also exist calculations for some of the sixth [18] and eight order cumulants [19], too.
There are three main uses of fluctuations: exploring finite with Taylor expansion, determining the dominant degrees of freedom of the system and determining freezout parameters of heavy-ion collisions. Let us now discuss them in detail.
2.1 Finite with Taylor expansion
Expanding an observable in a chemical potential results in expansion coefficients, that can be computed with marginal effort, if the fluctuations are already known. Thus knowing eg. baryon number fluctuations allows obtaining results at , which circumvents the infamous sign problem. Due to the aforementioned numerical difficulties, this is only a solution for small ’s. This technique made possible to determine important observables related to finite . The curvature of the transition line starting at was determined in leading order in :
Also the leading order correction to the equation of state at is known [22].
2.2 Dominant degrees of freedom
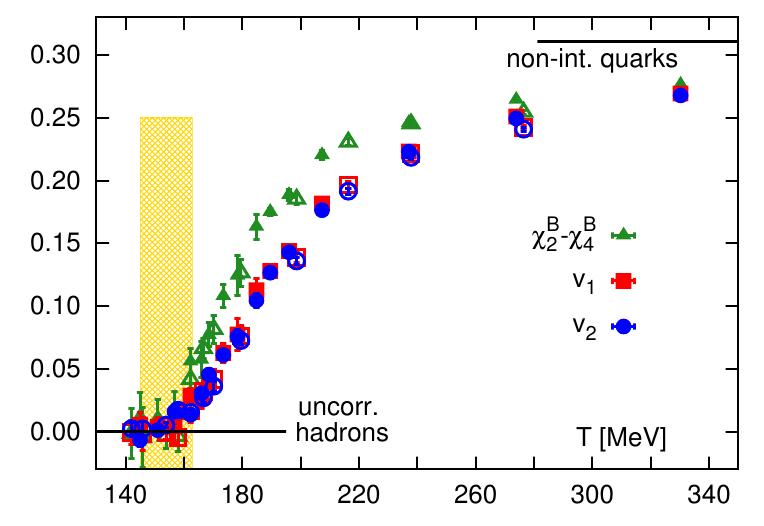
The sole value of a fluctuation is often used as an indicator to tell about the dominant degrees of freedom in the system. For example let us consider the following two combinations of fluctuations [23]:
From the assumption, that the system is composed of uncorrelated particles, that carry integer baryon number and strangeness, it follows, that and vanish. One such model, that satisfies this condition is the standard Hadron Resonance Gas. This observable can be determined in lattice QCD, see Figure 4. For small temperatures it is zero supporting the assumption. For larger temperatures it starts deviating from zero, so we conclude, that the system cannot be a composition of uncorrelated particles carrying integer charges for MeV. For high temperatures similar observables can be constructed. They can be used to test whether the dominant degrees of freedom carrying strangeness have the same quantum numbers as free strange quarks. These investigations were reported by Schmidt [24].
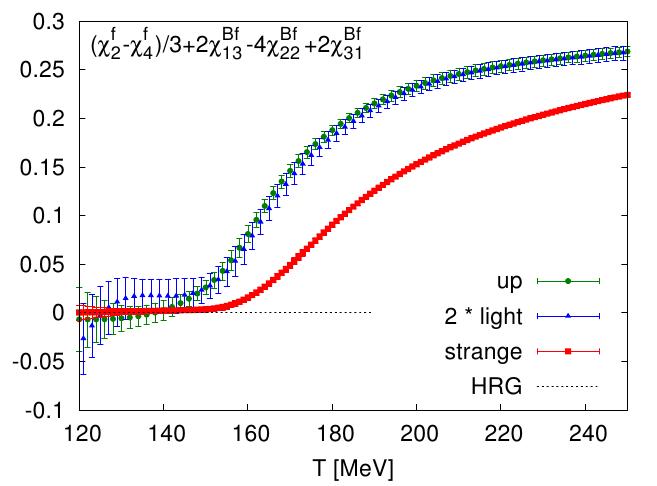
An interesting observation was reported by Borsanyi [25]. The characteristic temperature values of fluctuations, that are related to strange quarks, are typically MeV higher, than those related to light quarks. This is demonstrated on Figure 5, where beside the already defined the authors also plot
which is obtained by replacing the -derivations in with -derivations. This latter is the chemical potential, that is coupled to the number of up quarks. The separation of the light and strange quark curves and respective characteristic temperatures is evident from the plot. It can be seen in many other fluctuation combinations, too. The authors call this finding as the flavor hierarchy of the QCD transition [17].
2.3 Ab-initio determination of freezout parameters
The two central question of heavy-ion collision experiments are whether the system created in these collision is thermal equilibrated, and if yes, what are the corresponding parameters, ie. the temperature and chemical potential values.
To obtain these parameters statistical hadronization models are widely used (see eg. [26]), in which the numbers of the outcoming hadrons are fitted with simple Bose or Fermi distributions. The so obtained temperature and chemical potential values are called freezout parameters, below this temperature one expects no change in the number and type of particles. A problem with this approach is, that the typical freezout temperature turns out to be MeV, which is inside the transition region of QCD, where the use of a non-interacting hadronic description is questionable.
Last year it has been realized, that conserved charge fluctuations can solve this problem and using lattice QCD one can determine freezout parameters in an ab-initio way [27]. Let us first consider the experimental side, where we start with two lead ions, each of which carries , and . After the collision the outgoing particles will also have the same total charges, since these are conserved quantum numbers (considering only the strong interaction). So what exactly fluctuates? In order to get fluctuations, one has to consider a subsystem, ie. particles coming only from a small part of the system. This is defined by imposing kinematical constraints on the outgoing particles. There is no constraint any more on the charges of a subsystem, charges can flow in and out, the measured values will be different from one event to the other. These are the event-by-event fluctuations [28].
By relating event-by-event fluctuations to the fluctuations measured on the lattice one can answer the two central questions of heavy-ion collisions:
-
1.
The four unknown parameters, T, , and , can be determined by using four conditions: we require, that for four observables the experimental and lattice values be equal. The so obtained parameters are called ab-initio freezout parameters. Ab-initio, since nothing but the QCD Lagrangian is assumed. Freezout, since they reflect the state of the system, after which there was no change in the number of charges.
-
2.
Measuring observables other than the previous four can be used to decide the question about the equilibrium. If for other fluctuations the experimental and lattice values are still equal, then the equilibrium hypothesis gets more support. If there is a discrepancy, then the fluctuations cannot have a thermal origin.
Additionally one can also plot the freezout parameters for different experiments onto the temperature-chemical potential plane and see how it is related to the QCD transition line. This can be used to design fluctuation based signatures for experiments [29], in order to ease the location of the QCD endpoint on the transition line (if it exists).
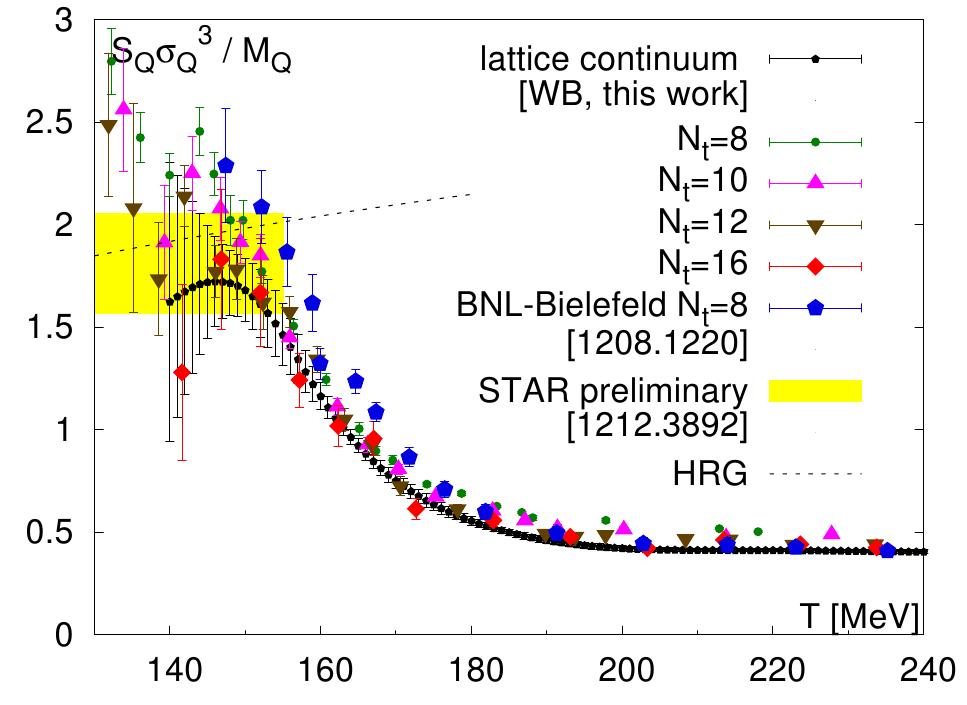
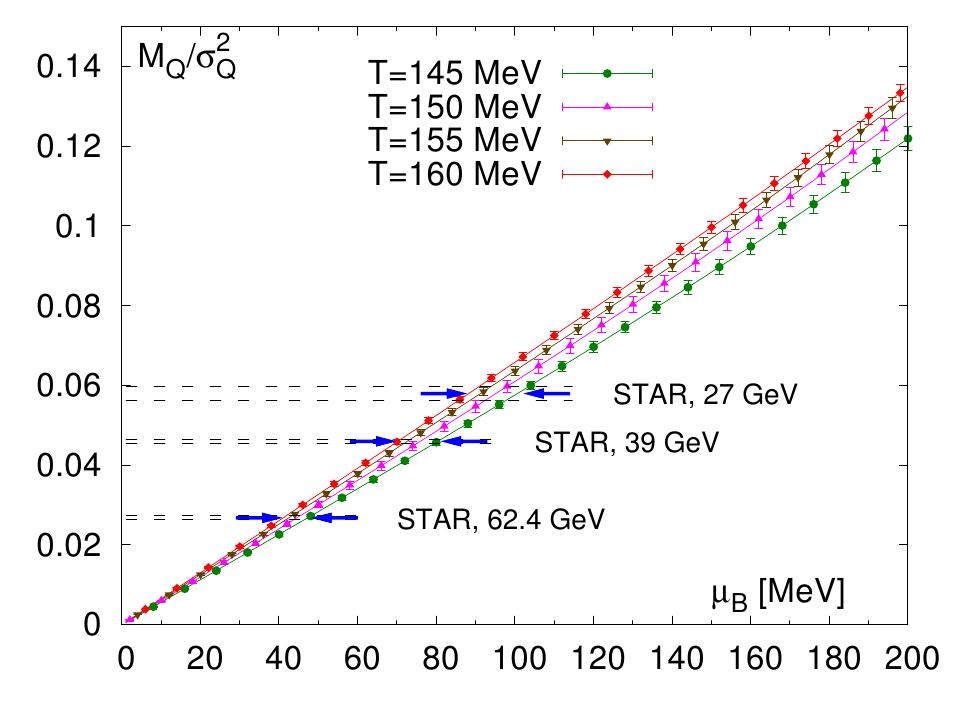
The BNL-Bielefeld collaboration has proposed a concrete way to extract the freezout parameters by matching experimental and lattice data [27]. Using
one can express and as the function of the other two parameters: and . To determine these two one chooses two fluctuations, the so-called thermometer and the baryometer, for which it is required, that their experimental and lattice values be equal. A choice, that is convenient both from experimental and lattice point of view, is based on charge fluctuations:
| as thermometer and | |||
| as baryometer, |
where . Note, that in principle the fluctuations also depend on the size of the system; this dependence is linear, if the system is large enough. In order to cancel this unknown factor, it is advantageous to work with fluctuation ratios. The WB collaboration has recently presented high-precision continuum extrapolated data for these two observables [25], on Figure 6 we use them to to illustrate the temperature and chemical potential determination. On the upper panel the thermometer is shown as the function of temperature. The yellow band is the experimentally measured value, the black points are the lattice results. From the equality of the two we get an upper bound on the freezout temperature MeV. The lower panel shows the baryometer as the function of the chemical potential. The horizontal lines are the experimental values for different beam energies, equating with the lattice result yields eg. MeV for the smallest beam energy on the plot.
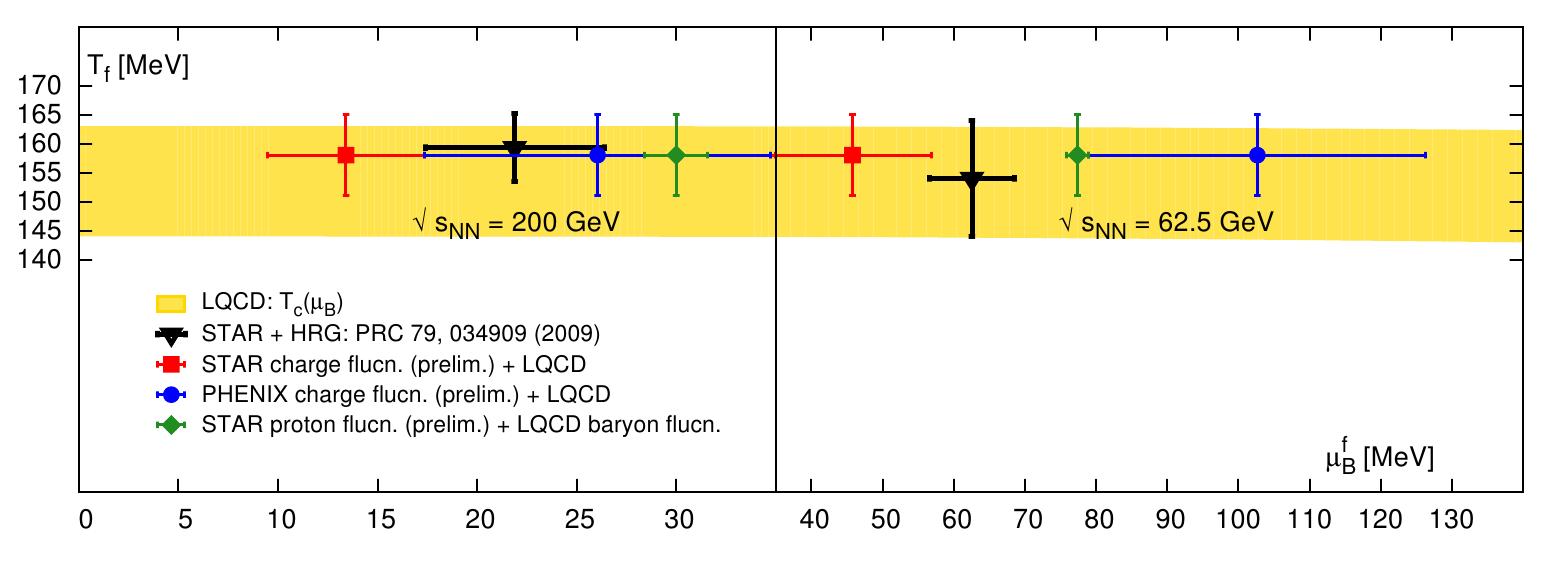
Wagner presented a plot of the BNL-Bielefeld collaboration featuring the extracted freezout parameters and the QCD transition line on the plane. This is shown on Figure 7. There are two different beam energies corresponding to the left and right panels of the plot. For each beam energy there are four different freezout parameter determinations: the black is the old approach based on statistical hadronization models. The colored ones are the newly proposed ab-initio freezout parameter determinations: the red and blue ones are based on charge fluctuations, the greens are based on matching lattice baryon number fluctuations to the experimental proton number fluctuations (note, that a matching using baryon number would require the detection of neutral baryons, which is an uneasy task). There is some disagreement between the different determinations, which is partly due to the preliminary status of the experimental data, partly to the mismatch of baryon and proton numbers. All freezout parameters are nicely consistent with the QCD transition line (yellow band), suggesting that the freezout takes place at the transition.
The main message of this section, that fluctuations provide a model-independent way to extract freezout parameters in experiments and the first attempts have already been taken.
3 Columbia-plot
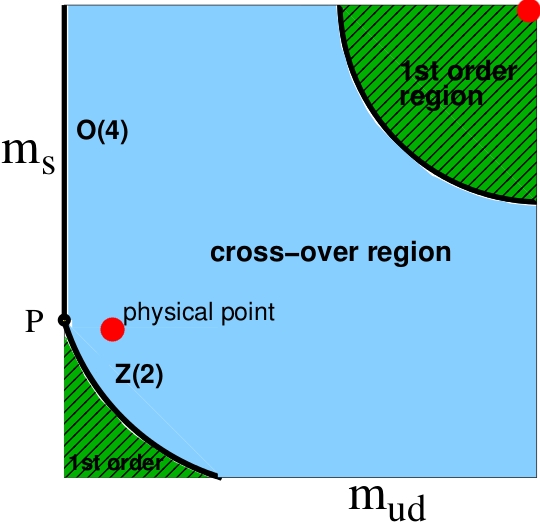
A traditional topic in lattice thermodynamics is the order of the transition in the chiral limit with various number of flavors. The status is usually summarized in form of the Columbia-plot [30], Figure 8, which shows the order as the function of the light and strange quark masses. There are only two points, which are known with high confidence: the physical point is a crossover and the pure SU(3) theory has a first order transition. The rest of the plot is a prediction of an effective field theory, first advocated by Pisarski and Wilczek [31, 32].
3.1 Where is the first order transition in ?
In case of three degenerate flavors the effective theory has a first-order transition. If this also holds in QCD, then there should be a non-zero pion mass at which the first order transition turns into crossover. The search of this critical pion mass has already a long history, many simulations have been carried out with staggered fermions. Decreasing the lattice spacing and/or improving the lattice action decreases the critical pion mass. The current best searches were not even able to find a first order region, only an upper bound on was possible:
| action | [MeV] | reference | |
|---|---|---|---|
| 4 | unimproved | 260 | [33, 34] |
| 6 | unimproved | 150 | [34] |
| 4 | p4 | 70 | [35] |
| 6 | stout | [36] | |
| 6 | HISQ | [37] |
A serious shortcoming of all these staggered studies is, that although the pseudo Goldstone pion mass could be decreased at a fixed , the root mean squared pion mass practically does not change below some quark mass. In the above studies it was always MeV.
A study with Wilson fermions was presented by Nakamura, the critical pion mass was found to be at MeV. If it holds, it would mean, that the negative result of the staggered simulations really lies in the too large RMS pion mass: a slap in the face of these simulations.
3.2 The role of the axial symmetry in the case
In case of two degenerate flavors even the effective theory prediction becomes ambiguous, it depends on the strength of the axial anomaly at the temperature of the chiral restoration. If the anomaly is strong enough, then the transition is second order in the universality class. If the anomaly is weaker, then one might get a first-order transition. In case of a complete restoration even another second order transition, now in the universality class, is possible [38].
One way to study the restoration of the axial symmetry is to measure the difference of the pseudoscalar () and scalar () correlators:
Another approach is to look at the near-zero eigenmodes of the Dirac-operator, their absence should also be a signature of the axial symmetry restoration. There are several groups investigating along these lines partly with contradicting results:
| restored? | fermion | lattices | group,presenter |
|---|---|---|---|
| no | domain-wall | hotQCD [7], Schroeder | |
| no | overlap on staggered | Bielefeld, Sharma [39] | |
| yes | overlap | JLQCD [40], Taniguchi [41] | |
| yes | domain-wall | TW-QCD, Chiu [42] |
For a definite conclusion one would like to have extrapolations to infinite volume, chiral limit and continuum limit, none of the calculations can provide all three.
3.3 Direct determinations suggest second order for
The current best evidence for a second order transition comes from the BNL-Bielefeld collaboration. Ding presented [43] an update of the results with highly improved staggered quarks at one lattice spacing down to a pseudo Goldstone pion mass of MeV (it is actually a simulation with a physical strange quark). No signal of a first order transition has been found. The chiral condensate for different quark masses and temperatures nicely collapse to a single scaling curve assuming, that the transition is second order in the chiral limit (see Figure 9). As it has already been mentioned, a shortcoming of this approach is, that with staggered quarks it is questionable to carry out a chiral limit before the continuum extrapolation.

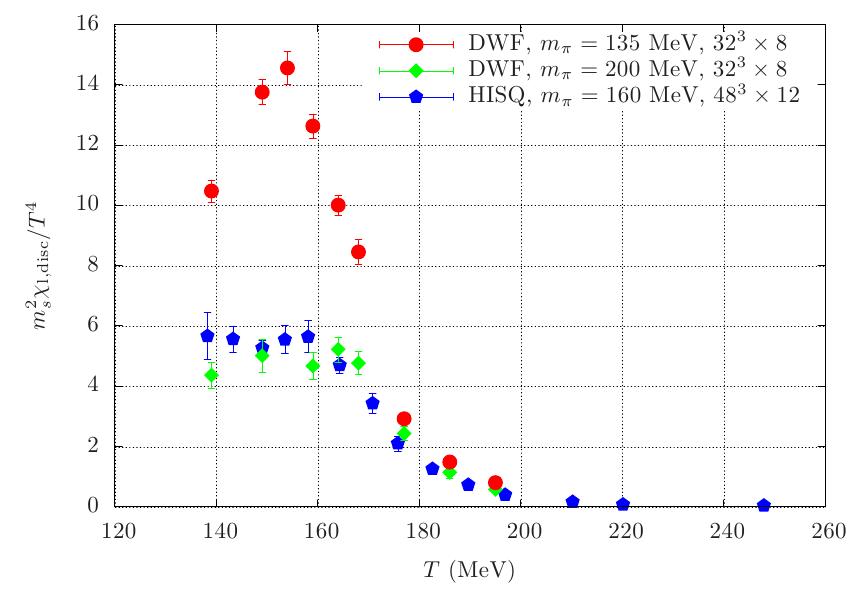
There is an emerging segment of studies with non-staggered fermions. The most impressive example to date is the work of the hotQCD collaboration [7]. Domain-wall fermions are used on upto lattices. The pion mass is gradually decreased, there are runs even with physical pion mass; the strange mass is set to the physical value. It has been decided to boost this even further: Schroeder presented runs on a lattice at MeV! No sign of a first order transition has been found, yet. As Figure 10 shows the peak of the chiral susceptibility at the physical point is MeV. This is the first fully independent confirmation of the previously disputed staggered result (see Section 1.2).
The WB collaboration also investigates the transition with chiral fermions (overlap fermion, [44]). The main focus is on the continuum limit, there are now four lattice spacings at a pion mass of MeV. These results also support the universality: there is a nice agreement with previous staggered data. There are also simulations with non-chiral fermions: the tmfT collaboration uses twisted mass fermions [12], the Frankfurt-Mainz group Wilson fermions [45]. None of them are conclusive on the order of the transition in the chiral limit, yet.
3.4 Imaginary approach says first order in on a coarse lattice
All previous approaches use the same strategy: simulate with gradually smaller pion masses in the crossover region and hope, that at some pion mass the transition turns into first order. However there is not even a slightest clue about the value of the critical pion mass. The problem with this, that one cannot write an honest proposal to get CPU time for such a project, because for that one would have to know how small pion masses are to be simulated.
An interesting alternative approach, which might circumvent this problem, arises by considering the phase diagram at imaginary chemical potential . The idea was discussed first by D’Elia and Sanfilippo [46], it was systematically developed by de Forcrand and Philipsen [47]. Instead of going down with the pion mass at in the crossover region, one turns on the chemical potential at a fixed pion mass. It can happen, that the transition gets stronger and eventually turns into first order at a critical pion mass . If this point is found, then one just has to follow, what happens with as the chemical potential goes back to zero. This strategy was successfully used to determine the order of the transition on unimproved staggered lattices: it is first order [48].

This result contradicts previous direct determinations with improved actions (see previous subsection), which find no existence of a first order region. What might seem a contradiction first, fits actually nicely into the effective theory picture. Staggered fermions on coarse lattices have serious cutoff effects in the axial symmetry breaking and a weak or non-existent axial term in the effective theory actually favors a first-order transition. So the order of the transition can easily be first order on coarse lattices without improvement, and turn out to be second order on finer lattices and/or with improvement.
Ejiri presented an approach [49], which is similar in spirit. Increasing the number of flavors also makes the transition stronger and the same procedure can be applied as for imaginary .
4 Magnetic field
The rising star among the topics of recent years is lattice QCD at finite magnetic field . It has gained momentum after realizing, that spectator particles in non-central heavy-ion collisions produce extreme large magnetic fields (). This field induces a charge current, if there is an imbalance between left and right handed particles, this is the chiral magnetic effect, [50]. This can be used to test the non-Abelian nature of the strong interaction. On the lattice on a fixed instanton background the chiral magnetic effect can be nicely demonstrated [51]. On “real” configurations the effect is more complex, it has been studied by Buividovich et al [52], Yamamoto [53] and in two color QCD by Ilgenfritz et al [54].
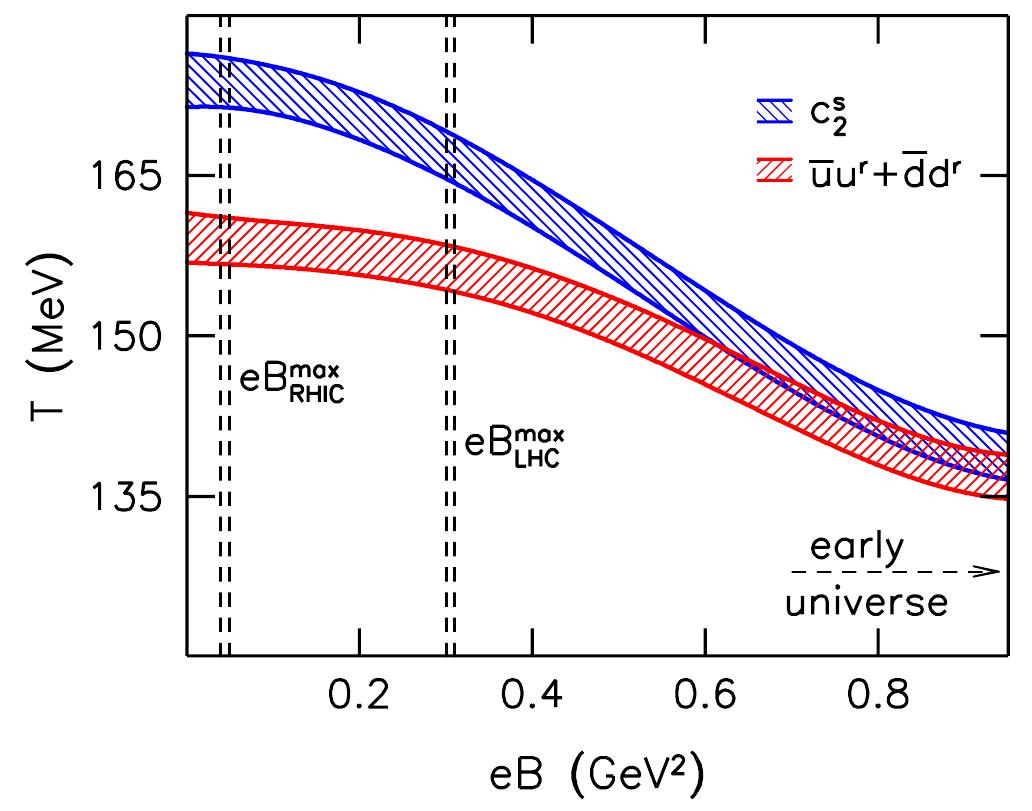
Thermodynamical properties at finite have been extensively studied. The common wisdom about the transition temperature was, that increases with . This was even supported by first lattice studies by D’Elia et al [55]. The continuum extrapolation, carried out by Bali et al [56], has changed the picture completely, the result is shown on Figure 12: gets smaller with increasing . The order of the transition has also been investigated: there is no volume dependence in the chiral susceptibility, also the width of the peak stays constant with . The transition remains therefore a crossover upto the largest magnetic field that was studied so far on the lattice GeV.
The common wisdom about the transition temperature can actually traced back to the behaviour of the chiral condensate at finite . Previously it was expected, that a magnetic catalysis takes place for all temperatures, which means, that the increases with . As current lattice studies show (see Figure 13), this is indeed the case for small temperatures, however around the transition an opposite effect, the inverse magnetic catalysis can be observed: decreases with [57]. This then results in the decrease of the transition temperature. A closer look at magnetic catalysis and inverse magnetic catalysis was presented by Kovacs [58]. The magnetic field dependence of the chiral condensate comes from two sources [59]:
There is a “valence” contribution , which indeed always increases with due to the increase in the eigenvalue density of the Dirac-operator on a fixed gauge background. This was known even before lattice studies. However there is also a “sea” contribution: it takes into account the change in due to the change of the typical gauge backgrounds. It can both increase or decrease with the magnetic field. This second contribution was not taken into account in previous qualitative analyses, it has been first caught in lattice QCD simulations. It can actually compensate the catalytic effect of the valence contribution yielding an inverse magnetic catalysis in total [58].

An interesting question is, what would a piece of quark-gluon plasma do, if we approached it with a magnet? Would it be attracted or repelled by the magnet? Is it a para- or a diamagnetic material? The answer can be given by calculating the sign of the magnetic susceptibility:
The renormalization of this quantity was given in Appendix A of Reference [60] and it follows that at zero temperature . The derivative is somewhat cumbersome on the lattice, since can only be changed in discrete steps on a periodic lattice [61]. There are three groups calculating at finite temperature, in three different ways. Bonati presented a technique using a finite difference method [62]. DeTar was showing results using a non-conventional definition of the lattice field combined with Taylor-expansion [63]. Endrodi utilized two approaches to obtain the dependence of [64]: one based on calculating anisotropies, the other on a novel type of integral method. All yield the same result: the quark-gluon plasma is a paramagnetic medium. This paramagnetic property might increase the elongation of the plasma produced in non-central heavy ion collisions [65].
Acknowledgement
The author would like to thank Gergo Endrodi for help with preparing the magnetic field summary, the Debrecen and Pisa groups for hospitality and many colleagues for sending results: Alexei Bazavov, Claudio Bonati, Bastian Brandt, Ting-Wai Chiu, Massimo d’Elia, Carleton DeTar, Heng-Tong Ding, Tamas Kovacs, Ludmila Levkova, Michael Mueller-Preussker, Yoshifumi Nakamura, Francesco Negro, Chris Schroeder, Sayantan Sharma, Mathias Wagner.
References
- [1] Y. Aoki, G. Endrodi, Z. Fodor, S. D. Katz and K. K. Szabo, Nature 443 (2006) 675 [hep-lat/0611014].
- [2] Y. Aoki, Z. Fodor, S. D. Katz and K. K. Szabo, Phys. Lett. B 643 (2006) 46 [hep-lat/0609068].
- [3] Y. Aoki, S. Borsanyi, S. Durr, Z. Fodor, S. D. Katz, S. Krieg and K. K. Szabo, JHEP 0906 (2009) 088 [arXiv:0903.4155 [hep-lat]].
- [4] S. Borsanyi et al. [Wuppertal-Budapest Collaboration], JHEP 1009 (2010) 073 [arXiv:1005.3508 [hep-lat]].
- [5] A. Bazavov, T. Bhattacharya, M. Cheng, C. DeTar, H. T. Ding, S. Gottlieb, R. Gupta and P. Hegde et al., Phys. Rev. D 85 (2012) 054503 [arXiv:1111.1710 [hep-lat]].
- [6] M. Cheng, N. H. Christ, S. Datta, J. van der Heide, C. Jung, F. Karsch, O. Kaczmarek and E. Laermann et al., Phys. Rev. D 74 (2006) 054507 [hep-lat/0608013].
- [7] M. I. Buchoff, M. Cheng, N. H. Christ, H. -T. Ding, C. Jung, F. Karsch, R. D. Mawhinney and S. Mukherjee et al., arXiv:1309.4149 [hep-lat].
- [8] S. Borsanyi, S. Durr, Z. Fodor, C. Hoelbling, S. D. Katz, S. Krieg, D. Nogradi and K. K. Szabo et al., JHEP 1208 (2012) 126 [arXiv:1205.0440 [hep-lat]].
- [9] S. Borsanyi, Z. Fodor, C. Hoelbling, S. D. Katz, S. Krieg and K. K. Szabo, [arXiv:1309.5258 [hep-lat]].
- [10] S. Borsanyi, G. Endrodi, Z. Fodor, A. Jakovac, S. D. Katz, S. Krieg, C. Ratti and K. K. Szabo, JHEP 1011 (2010) 077 [arXiv:1007.2580 [hep-lat]].
- [11] A. Bazavov et al. [MILC Collaboration], PoS LATTICE 2013 (2013) 154 [arXiv:1312.5011 [hep-lat]].
- [12] F. Burger, G. Hotzel, M. Muller-Preussker, E. -M. Ilgenfritz and M. P. Lombardo, [arXiv:1311.1631 [hep-lat]].
- [13] S. .Borsanyi, G. Endrodi, Z. Fodor, S. D. Katz and K. K. Szabo, JHEP 1207 (2012) 056 [arXiv:1204.6184 [hep-lat]].
- [14] S. Borsanyi, Z. Fodor, S. D. Katz, S. Krieg, C. Ratti and K. Szabo, JHEP 1201 (2012) 138 [arXiv:1112.4416 [hep-lat]].
- [15] A. Bazavov et al. [HotQCD Collaboration], Phys. Rev. D 86 (2012) 034509 [arXiv:1203.0784 [hep-lat]].
- [16] S. Borsanyi, Z. Fodor, S. D. Katz, S. Krieg, C. Ratti and K. K. Szabo, Phys. Rev. Lett. 111 (2013) 062005 [arXiv:1305.5161 [hep-lat]].
- [17] R. Bellwied, S. Borsanyi, Z. Fodor, S. DKatz and C. Ratti, Phys. Rev. Lett. 111 (2013) 202302 [arXiv:1305.6297 [hep-lat]].
- [18] M. Cheng, P. Hendge, C. Jung, F. Karsch, O. Kaczmarek, E. Laermann, R. D. Mawhinney and C. Miao et al., Phys. Rev. D 79 (2009) 074505 [arXiv:0811.1006 [hep-lat]].
- [19] R. V. Gavai and S. Gupta, Phys. Rev. D 78 (2008) 114503 [arXiv:0806.2233 [hep-lat]].
- [20] O. Kaczmarek, F. Karsch, E. Laermann, C. Miao, S. Mukherjee, P. Petreczky, C. Schmidt and W. Soeldner et al., Phys. Rev. D 83 (2011) 014504 [arXiv:1011.3130 [hep-lat]].
- [21] G. Endrodi, Z. Fodor, S. D. Katz and K. K. Szabo, JHEP 1104 (2011) 001 [arXiv:1102.1356 [hep-lat]].
- [22] S. .Borsanyi, G. Endrodi, Z. Fodor, S. D. Katz, S. Krieg, C. Ratti and K. K. Szabo, JHEP 1208 (2012) 053 [arXiv:1204.6710 [hep-lat]].
- [23] A. Bazavov, H. -T. Ding, P. Hegde, O. Kaczmarek, F. Karsch, E. Laermann, Y. Maezawa and S. Mukherjee et al., Phys. Rev. Lett. 111, 082301 (2013) [arXiv:1304.7220 [hep-lat]].
- [24] C. Schmidt, arXiv:1312.4977 [hep-lat].
- [25] S. Borsanyi, Z. Fodor, S. D. Katz, S. Krieg, C. Ratti and K. K. Szabo, arXiv:1311.7397 [hep-lat].
- [26] A. Andronic, P. Braun-Munzinger and J. Stachel, Nucl. Phys. A 772 (2006) 167 [nucl-th/0511071].
- [27] A. Bazavov, H. T. Ding, P. Hegde, O. Kaczmarek, F. Karsch, E. Laermann, S. Mukherjee and P. Petreczky et al., Phys. Rev. Lett. 109, 192302 (2012) [arXiv:1208.1220 [hep-lat]].
- [28] M. A. Stephanov, K. Rajagopal and E. V. Shuryak, Phys. Rev. D 60 (1999) 114028 [hep-ph/9903292].
- [29] M. A. Stephanov, Phys. Rev. Lett. 102 (2009) 032301 [arXiv:0809.3450 [hep-ph]].
- [30] F. R. Brown, F. P. Butler, H. Chen, N. H. Christ, Z. -h. Dong, W. Schaffer, L. I. Unger and A. Vaccarino, Phys. Rev. Lett. 65 (1990) 2491.
- [31] R. D. Pisarski and F. Wilczek, Phys. Rev. D 29 (1984) 338.
- [32] F. Wilczek, Int. J. Mod. Phys. A 7 (1992) 3911 [Erratum-ibid. A 7 (1992) 6951].
- [33] F. Karsch, E. Laermann and C. Schmidt, Phys. Lett. B 520 (2001) 41 [hep-lat/0107020].
- [34] P. de Forcrand, S. Kim and O. Philipsen, PoS LAT 2007 (2007) 178 [arXiv:0711.0262 [hep-lat]].
- [35] F. Karsch, C. R. Allton, S. Ejiri, S. J. Hands, O. Kaczmarek, E. Laermann and C. Schmidt, Nucl. Phys. Proc. Suppl. 129 (2004) 614 [hep-lat/0309116].
- [36] G. Endrodi, Z. Fodor, S. D. Katz and K. K. Szabo, PoS LAT 2007 (2007) 182 [arXiv:0710.0998 [hep-lat]].
- [37] H. -T. Ding, A. Bazavov, P. Hegde, F. Karsch, S. Mukherjee and P. Petreczky, PoS LATTICE 2011 (2011) 191 [arXiv:1111.0185 [hep-lat]].
- [38] F. Basile, A. Pelissetto and E. Vicari, PoS LAT 2005 (2006) 199 [hep-lat/0509018].
- [39] S. Sharma, V. Dick, F. Karsch, E. Laermann and S. Mukherjee, arXiv:1311.3943 [hep-lat].
- [40] G. Cossu, S. Aoki, H. Fukaya, S. Hashimoto, T. Kaneko, H. Matsufuru and J. -I. Noaki, Phys. Rev. D 87 (2013) 114514 [arXiv:1304.6145 [hep-lat]].
- [41] S. Aoki, H. Fukaya and Y. Taniguchi, arXiv:1312.1417 [hep-lat].
- [42] T. -W. Chiu, W. -P. Chen, Y. -C. Chen, H. -Y. Chou and T. -H. Hsieh, arXiv:1311.6220 [hep-lat].
- [43] H. -T. Ding, A. Bazavov, F. Karsch, Y. Maezawa, S. Mukherjee and P. Petreczky, arXiv:1312.0119 [hep-lat].
- [44] S. Borsanyi, Y. Delgado, S. Durr, Z. Fodor, S. D. Katz, S. Krieg, T. Lippert and D. Nogradi et al., Phys. Lett. B 713 (2012) 342 [arXiv:1204.4089 [hep-lat]].
- [45] B. B. Brandt, A. Francis, H. B. Meyer, O. Philipsen and H. Wittig, arXiv:1310.8326 [hep-lat].
- [46] M. D’Elia and F. Sanfilippo, Phys. Rev. D 80 (2009) 111501 [arXiv:0909.0254 [hep-lat]].
- [47] P. de Forcrand and O. Philipsen, Phys. Rev. Lett. 105 (2010) 152001 [arXiv:1004.3144 [hep-lat]].
- [48] C. Bonati, M. D’Elia, P. de Forcrand, O. Philipsen and F. Sanfillippo, arXiv:1311.0473 [hep-lat].
- [49] S. Ejiri and N. Yamada, arXiv:1312.0102 [hep-lat].
- [50] D. E. Kharzeev, L. D. McLerran and H. J. Warringa, Nucl. Phys. A 803 (2008) 227 [arXiv:0711.0950 [hep-ph]].
- [51] M. Abramczyk, T. Blum, G. Petropoulos and R. Zhou, PoS LAT 2009 (2009) 181 [arXiv:0911.1348 [hep-lat]].
- [52] P. V. Buividovich, M. N. Chernodub, E. V. Luschevskaya and M. I. Polikarpov, Phys. Rev. D 80 (2009) 054503 [arXiv:0907.0494 [hep-lat]].
- [53] A. Yamamoto, Phys. Rev. Lett. 107 (2011) 031601 [arXiv:1105.0385 [hep-lat]].
- [54] E. -M. Ilgenfritz, M. Kalinowski, M. Muller-Preussker, B. Petersson and A. Schreiber, Phys. Rev. D 85 (2012) 114504 [arXiv:1203.3360 [hep-lat]].
- [55] M. D’Elia, S. Mukherjee and F. Sanfilippo, Phys. Rev. D 82 (2010) 051501 [arXiv:1005.5365 [hep-lat]].
- [56] G. S. Bali, F. Bruckmann, G. Endrodi, Z. Fodor, S. D. Katz, S. Krieg, A. Schafer and K. K. Szabo, JHEP 1202 (2012) 044 [arXiv:1111.4956 [hep-lat]].
- [57] G. S. Bali, F. Bruckmann, G. Endrodi, Z. Fodor, S. D. Katz and A. Schafer, Phys. Rev. D 86 (2012) 071502 [arXiv:1206.4205 [hep-lat]].
- [58] F. Bruckmann, G. Endrodi and T. G. Kovacs, JHEP 1304 (2013) 112 [arXiv:1303.3972 [hep-lat]].
- [59] M. D’Elia and F. Negro, Phys. Rev. D 83 (2011) 114028 [arXiv:1103.2080 [hep-lat]].
- [60] G. S. Bali, F. Bruckmann, G. Endrodi, F. Gruber and A. Schaefer, JHEP 1304 (2013) 130 [arXiv:1303.1328 [hep-lat]].
- [61] M. H. Al-Hashimi and U. -J. Wiese, Annals Phys. 324 (2009) 343 [arXiv:0807.0630 [quant-ph]].
- [62] C. Bonati, M. D’Elia, M. Mariti, F. Negro and F. Sanfilippo, Phys. Rev. Lett. 111 (2013) 182001 [arXiv:1307.8063 [hep-lat]].
- [63] L. Levkova and C. DeTar, Phys. Rev. Lett. 112 (2014) 012002 [arXiv:1309.1142 [hep-lat]].
- [64] G. S. Bali, F. Bruckmann, G. Endrodi and A. Schafer, [arXiv:1310.8145 [hep-lat]].
- [65] G. S. Bali, F. Bruckmann, G. Endrodi and A. Schafer, arXiv:1311.2559 [hep-lat].