THE () vs. AS A TRACER OF EARLY-TYPE GALAXIES EVOLUTION IN USGC U376 AND LGG 225 GROUPS
Abstract
With the aim of tracing back the evolution of galaxies in nearby groups we use smooth particle hydrodynamical (SPH) simulations with chemo-photometric implementation. Here we focus on the evolution of the early-type members (Es and S0s, ETGs hereafter) in two groups, USGC U376 and LGG 225, both in the Leo cloud. We use the near-UV (NUV)-optical rest-frame versus color magnitude diagram to follow their evolution, from the blue cloud (BC) to the red sequence (RS), through the green valley (GV). ETGs brighter than mag are older than 13 Gyr and spend up to 10 Gyr of their overall evolutionary time in the BC before they reach the RS migrating through the GV. Fainter ETGs are younger, of 2 Gyr on average, and evolve for about 7-8 Gyr along the BC. The turn-off occurs at . Therefore these ETGs spend up to 3-5 Gyr crossing the GV; UGC 06324, the faintest ETG in the sample, still is in the GV. The mechanism driving their evolution is gravitational, due to merging and/or interaction. Our SPH simulations suggest that ETG members of these groups evolved toward the RS before and during the group collapse phase. This result is consistent with the dynamical analysis of both groups showing that they are not yet virialized.
1 Introduction
The color distribution of galaxies in the local universe,
is nearly bimodal and relates to galaxy morphology (e.g. Strateva et al., 2001; Balogh et al., 2004).
In the color-magnitude diagram (CMD), quiescent early-type galaxies (ETGs) populate the red sequence (RS) and late-types,
with active star formation (SF), populate the blue cloud (BC; e.g. Baldry et al., 2004).
This bimodality is ubiquitous, extending from the field, to groups
and clusters (e.g. Lewis et al., 2002).
The physical origin of this color distribution is still under debate. However,
there is strong evidence that the two distinct populations are the result of
transformations driven by the environment.
Galaxy evolution from the BC to the RS, i.e., from star-forming to quiescent galaxies,
occurs via a transition that leads galaxies in an intermediate zone of the CMD, the green valley (GV; Martin et al., 2007).
Since ultraviolet (UV) bands are excellent tracers of the recent SF,
the red and blue color sequences are especially well separated in the far-UV (FUV)-optical and near-UV (NUV)-optical
CMDs (e.g. Schawinski et al., 2007; Wyder et al., 2007). In particular, FUV studies focused
on the galaxies located in the GV, the paradigm of the transition phase.
FUV, with Galaxy Evolution Explorer (GALEX; Martin et al., 2005), and/or H images
revealed signatures of ongoing SF in the form of inner and/or outer blue ring/arm-like
structures in some ETGs (Salim & Rich, 2010; Marino et al., 2011a). Salim et al. (2012, and references therein)
showed a wide collection of these kind of galaxies
at redshift 0.12.
Signatures of ongoing ( 9%) or recent (47%)
SF are also found in the nuclear regions of nearby ETGs (e.g. Rampazzo et al., 2013).
Such ETGs have been proposed as possible examples of the ongoing transition
(Marino et al., 2011b; Salim et al., 2012; Fang et al., 2012).
Morphology, colors, and the star formation rate (SFR), primarily
depend on small-scale ( 1 Mpc) environment (Hogg et al., 2004; Kauffmann et al., 2004; Blanton et al., 2005; Ball et al., 2008; Wetzel et al., 2012).
This result has been extended through the use of galaxy group catalogs, showing that colors and SF
history most directly depend on the properties of their host dark matter (DM) halo (Blanton & Berlind, 2007; Wei et al., 2010; Tinker et al., 2012), in agreement with results of smooth particle hydrodynamical SPH simulations by Mazzei & Curir (2003, MC03 hereafter).
In this context, the investigation of the evolution of group members in the
nearby universe acquires a great cosmological interest because more than
half of galaxies reside in such environments. Furthermore, since the
velocity dispersion of galaxies is significantly lower in groups than in clusters,
the merger probability and the effects of interaction on galaxy evolution
are much higher. Consequently, groups provide a zoom-in on phenomena
driving the galaxy morphological and SF evolution
before galaxies fall into denser environments (e.g Wilman et al., 2009; Just et al., 2010).
In Marino et al. (2013), we investigated
the UV–optical CMD of the members of three nearby galaxy groups.
Here, we present SPH simulations with chemo-photometric
implementation based on evolutionary population synthesis (EPS) models,
aiming at studying the evolution of all the ETGs in two of these
groups, namely USGC U376 (U376 hereafter, Ramella et al., 2002), and LGG 225
(Garcia, 1993). Our SPH simulations allow us to derive dynamical and
morphological information concurrently with the spectral energy distribution (SED) at each evolutionary
time (“snapshot”, hereafter). Moreover, these simulations allow us to trace the evolutionary path of each ETG, from
the BC to the RS through the GV, in the () versus plane.
Simulations of groups, focusing on galaxy morphological transformation, have been
approached with different techniques in the literature (e.g., Kawata & Mulchaey (2008); Bekki & Couch (2011); Villalobos et al. (2012)).
Kawata & Mulchaey (2008) used a cosmological chemo-dynamical simulation to study
how the group environment affects the SF properties of a disk galaxy.
Bekki & Couch (2011), starting from already-formed galaxies, showed that
spirals (S) in groups can be strongly influenced by repetitive, slow encounters
so that galaxies with thin disks can be transformed into thick disks and gas-poor S0s.
Villalobos et al. (2012) studied the evolution of disk galaxies,
composed of a stellar disk embedded in a DM halo, within a group environment.
The group is modeled using an N-body DM halo following a Navarro et al. (1997) density profile and including
a spherically symmetric stellar component at its center, to account for the central galaxy.
The novelty of our approach is that we explore the merger/interaction scenario starting from collapsing
triaxial systems composed of DM and gas in different proportions and
combine the SPH code with a chemo-dynamical code based on
EPS models. The SED we derive accounts for chemical evolution, stellar emission, internal extinction, and
re-emission by dust in a self-consistent way, as descibed in previous works
(Spavone et al., 2009, 2012, and references therein). Each simulation
self-consistently provides morphological, dynamic, and chemo-photometric
evolution.
Based on this powerful tool, we aim to trace back the evolution of ETGs in nearby groups.
The plan of the paper is as follows. Section 2 summarizes the main
prescriptions of our SPH simulations, fully described in previous works
(Mazzei et al., 2014, and references therein) and provides the initial
conditions of galaxy encounters that best-fit the global properties of selected
ETGs. Section 3 details the results of individual galaxies, in terms of
gas accretion history drawn by the simulation that provides the best-fit of their absolute magnitude, SED,
and morphology. Section 4 presents and discusses the evolutionary predictions in the
() versus , CMD. Conclusions are drawn in Section 5.
Throughout the paper we assume =70 km s-1 Mpc-1,
=0.73, and =0.27, as in HYPERLEDA111http://leda.univ-lyon.fr1 database (Paturel et al., 2003).
2 ETGs in U376 and LGG 225: data and simulations.
Table 1 summarizes photometric and structural parameters of ETGs
in both groups.
For each group (column 1) and galaxy (Column 2), the morphological type (Column 3) is from Marino et al. (2013, their Table 1);
the cosmological corrected scale (Column 4) is derived from NED222NASA/IPAC Extragalactic Database http://ned.ipac.caltech.edu;
the apparent diameter corrected for Galactic extinction and inclination,
(Column 5), is from HYPERLEDA; the effective radii, (Column 6), from RC3 catalog (de Vaucouleurs et al., 1991)
or from labeled references; the -band apparent magnitude corrected for Galactic extinction (Column 7) is
from HYPERLEDA. The and values are reported in kpc using cosmology–corrected scales in the same Table.
The total absolute
magnitude in the -band (Column 8), is taken from HYPERLEDA (left) and derived from the
NED distance modulus (right). We point out that the discrepancy of the above values is due
to the different corrections applied. The left value of MB accounts for the Virgo infall only,
while the right values relates to the 3 K cosmic microwave backgroud (CMB).
We adopt the range of the values above to constrain our simulations (Section 3).
The measured UV and optical total magnitudes are from Marino et al. (2013, their Table 6)
for U376 and Marino et al. (2010, their Tables 3 and 4) for LGG 225. This set has been extended in wavelength
using Two Micron All Sky Survey (2MASS) and far-infrared (FIR) data from NED plus the AKARI/FIS catalog.
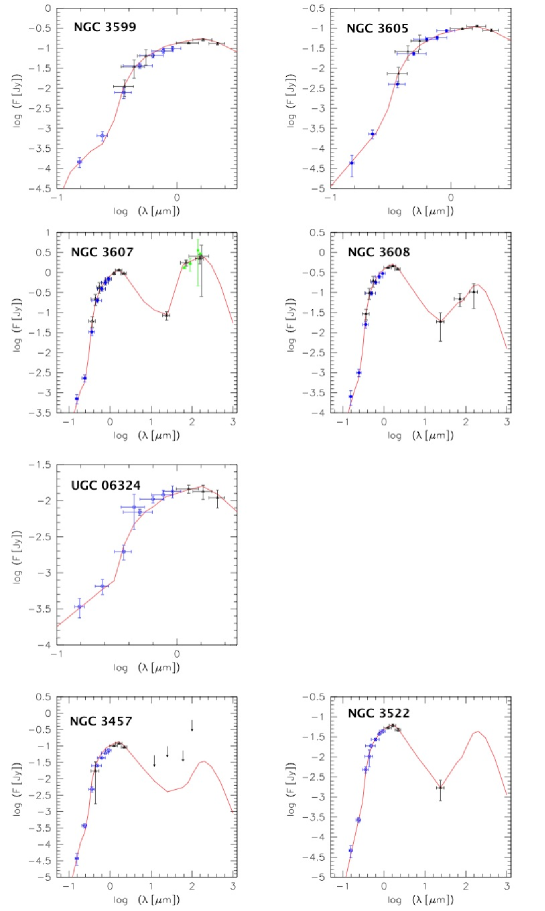
The observed SEDs of almost ETGs extend from the far-UV to 160 m, i.e.,
over about three orders of magnitude in wavelength (Figure 1).
These SEDs will be compared with those derived from our chemo-photometric simulations.
The general prescriptions of SPH simulations and the grid of the impact parameters explored, are reported in several
previous papers (Mazzei et al., 2014; Bettoni et al., 2012; Trinchieri et al., 2012; Spavone et al., 2012).
All of our simulations of galaxy formation and evolution start from collapsing
triaxial systems composed of DM and gas in different proportions and different total masses.
In more detail, each system is built up with a spin parameter,
, given by , where is the
total energy, is the total angular momentum and is the gravitational
constant; is equal to 0.06 and aligned with the shorter
principal axis of the DM halo. The triaxiality ratio of the DM halo,
, is 0.84 where (Warren et al., 1992).
All the simulations include self-gravity of gas, stars and DM,
radiative cooling, hydrodynamical pressure, shock heating,
viscosity, SF, feedback both from
evolved stars and type II SNe, and chemical enrichment.
Simulations provide the synthetic SED, based on EPS models, at each evolutionary stage, i.e. at each snapshot.
The time step between each snapshot is 0.037 Gyr.
The SED accounts for chemical evolution, stellar emission, internal extinction, and
re-emission by dust in a self-consistent way
(Spavone et al., 2009, 2012, and references
therein).
This extends over four orders of magnitude in wavelength at least,
i.e., from 0.06 to 1000 m. Each simulation self-consistently
provides morphological, dynamic, and chemo-photometric evolution.
The initial mass function (IMF) is of Salpeter type with an
upper mass limit of 100 and a lower mass limit of 0.01
(Salpeter, 1955), as in Curir & Mazzei (1999) and MC03.
All the model parameters had been tuned in previously cited papers that
analysed the evolution of isolated collapsing triaxial halos, initially composed of
DM and gas. In those papers the role of
the initial spin of the halos, their total mass and gas fraction,
as well as different IMFs, particle resolutions, SF efficiencies, and values of the feedback parameter were
all examined. The integrated properties of simulated galaxies, stopped at
15 Gyr, i.e., their colors, absolute magnitudes, metallicities, and
mass to luminosity ratios, had been successfully compared with those of local galaxies
(Curir & Mazzei (1999, their Fig. 17), Mazzei (2003, 2004, their Fig. 8)).
In particular, from our IMF choice a slightly higher SFR arises compared with the other possibilities examined;
this allows for the lowest feedback strength and for the expected
rotational support when disk galaxies are formed (Curir & Mazzei, 1999, MC03). As pointed
out by Kroupa (2012), this slope is almost the same as the universal mass
function that links the IMF of galaxies and stars to those of brown dwarfs,
planets and small bodies (meteoroids, asteroids) (Binggeli & Hascher, 2007).
The particle resolution is enhanced here to
6–8104 instead of 1–2104 as in MC03, so there are
3–4104 particle of gas and 3–4104 of DM at the
beginning in each new simulation.
The gravitational softening is 1, 0.5, and 0.05 kpc for DM and gas
and star particles, respectively.
From the grid of physically motivated SPH simulations, we isolate
those simultaneously best fitting the global properties of selected ETGs, i.e. their absolute magnitude,
integrated SED, and current morphology.
ETGs in our groups cannot be
matched by a single collapsing triaxial halo within the same framework and
set of parameters. Mergers and/or interactions are,
indeed, strongly favored in groups, as discussed in Section 1.
We point the reader to the paper by Mazzei et al. (2014) where our approach
to match the photometric, structural (e.g., disk versus bulge), and kinematical (gas versus stars kinemtics) of two S0 galaxies,
NGC 3626 in the U376 group and NGC 1533
in the Dorado group (Firth et al., 2006), has been discussed in great detail.
We put here a further constraint to our simulations, accounting for the dynamical analysis of each group (Marino et al., 2014, see also Appendix).
On this basis, the sum of masses of simulated
systems at their derived current ages, have to be consistent, i.e., they cannot exceed
the dynamical mass of each group, as given in Table 4 (see the Appendix).
Table 2 provides the initial conditions of the encounter of the two halos
able to match the global properties of ETGs in Table 1, as will be discussed in the next section.
In particular, Column 3 of Table 2 gives the total initial number of particles (the number of DM particles
is the same as gas particles), the length of the semi-major axis of the primary halo (Column 4),
the pericentric separation of the halos in unit of their semi-major axis (Column 5), the distance
of the halos centers of mass from the center of mass of the global system (Columns 6 and 7),
the velocity moduli of the halo centers in the same frame (Columns 8 and 9), and
the total mass (Column 10). The initial gas mass resolution, ,
is between 1.33107 and 5105 .
The SF efficiency is 0.4. The value of this parameter is set to
account for our previous works on isolated collapsing systems where
the effect of different values (i.e. 0.2 in Curir & Mazzei (1999) and 0.04 in MC03) were
analyzed and discussed. MC03 concluded that the SFR neither depends on mass gas resolution
nor on the SF efficiency being driven by the total amount of the gas. As far as
the stellar mass resolution is concerned, we point out that the SF
proceeds, if allowed by the onset of two conditions at the same time
(see also Valdarnini, 2002), no more than 10 times in a single cloud. This
implies that the (gas) stellar mass resolution ranges by a factor of 10, from
(0.6) 0.4 to (0.06) 0.04. It turns out
that a value of efficiency of about 0.5 gives rise to a conversion of
gas-into-stars efficiency of about few percent per free-fall time (for
the chosen density threshold it is about 20 Myr), when a strong and
efficient thermal stellar feedback is present (González-Samaniego et al., 2013). These values are close to
the value estimated for the giant molecular clouds in the Milky Way by Krumholz & Tan (2007).
The SFR, which drives the evolution of the global
properties of our simulated galaxy, converges when the initial particle
number is above 104 (MC03 for a discussion, their Fig.1; Christensen et al., 2010, 2012).
The final number of particles doubles at least the initial number in Table 2.
The gas-to-DM fraction is 0.11 in all the simulations presented here.
This value is very similar to the value of 0.13 found by Gonzalez et al. (2013)
by analyzing a large sample of clusters with different total masses.
3 Comparing simulations and data
Among the large set of simulations we performed, for each galaxy we selected the
snapshot that simultaneously best reproduces the current -band total absolute magnitude,
the observed SED, and the galaxy morphology. This snapshot provides, in turn,
several quantities, e.g., the current galaxy age. Furthermore, the corresponding
simulation self-consistently provides the evolutionary path of all the properties of the system components (see for details Mazzei et al., 2014, and references therein).
In Figure 1, we show the match between the synthetic SED
from our chemo-photometric SPH simulations and the multi- observations for each galaxy.
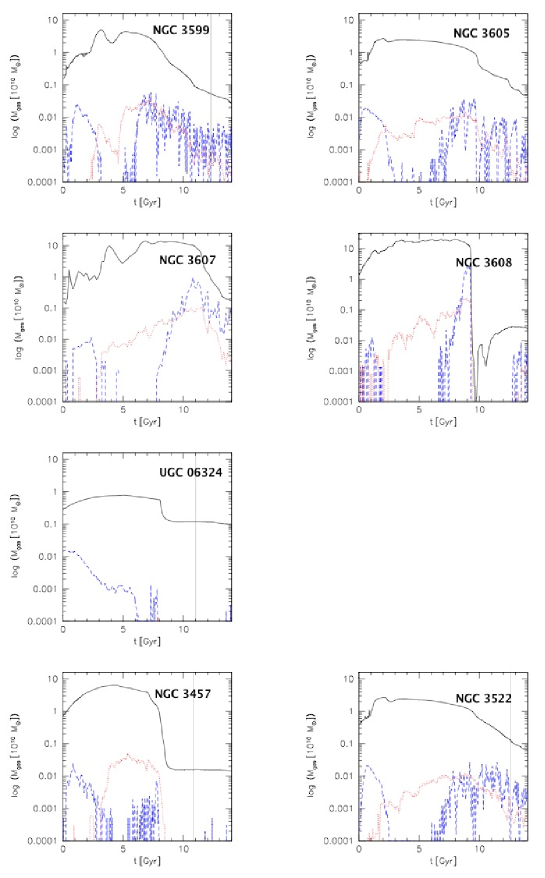
The corresponding gas accretion histories, i.e., the evolution of the
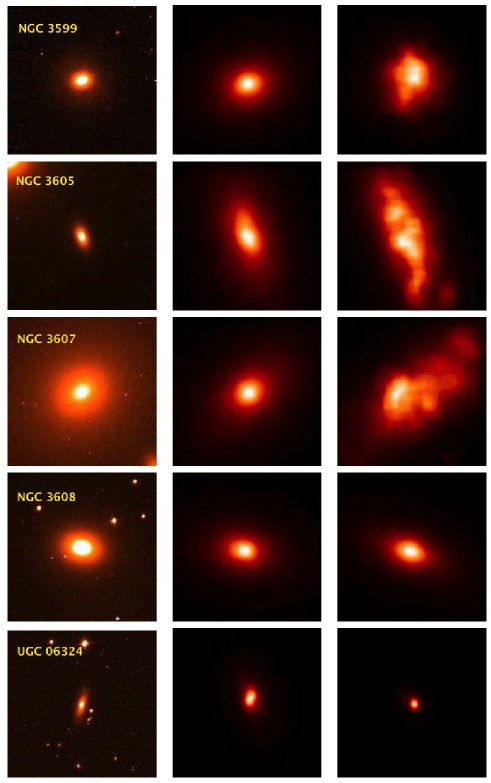
gas mass inside a specific radius, is shown in Figure 2. The observed and simulated -band maps, on the same scale and
spatial resolution (5″), are compared in Figure 3 (right and middle columns).
Most of the analyzed ETGs are well modeled by a single major
merger of two halos (with a mass ratio of 1:1 or 1:2). Only UGC 06324 in U376 and NGC 3457 in LGG 225 are described by a galaxy
encounter.
In Table 3, we summarize the main results obtained from chemo-photometric SPH simulations.
In particular, for each group and ETG (Columns 1 and 2 respectively), we report
within the respective (/2, see Table 1),
the galaxy age (Column 3), the average age of the stellar
population weighted by -band luminosity, , (Column 4), the average stellar metallicity (Column 5), the total mass (Column 6),
the ratio (Column 7), the DM and gas mass fraction (Columns 8 and 9) and the -band total absolute magnitude (Column 10).
We point out that the total mass of all simulated systems in U376 does not exceed the virial mass of the group itself
(Table 4) just from the beginning (Table 2), fulfilling the condition set in Section 2.
In the case of LGG 225, the total initial mass of our simulations exceeds 30% of the virial mass of this group.
However, the total mass of simulated systems inside the virial radius (1.5 times the harmonic radius in Table 4) at
their current age fulfills the condition set, as discussed in Section 3.2.
In the following subsections we provide details of the results for the individual ETGs.
3.1 U376: Individual Notes of its ETGs
NGC 3599 (catalog )
The global properties of this lenticular galaxy are well matched by a major merger with a mass ratio of 1:1.
The spins of the merging systems are equal (=0.06, MC03), parallel, both are aligned with the shorter of their principal axes, and perpendicular to the orbital plane (direct encounter).
The -band total absolute magnitude, mag, and the SED of the selected snapshot match well with the observed values
(Table 1 and Figure 1).
The Sloan Digital Sky Survey (SDSS) -band
morphology is compared with the simulated one on the same scale, 55, in Figure 3.
The age of the galaxy is 12.2 Gyr.
The stellar systems began to
merge into a unique configuration about 8 Gyr ago. The SFR proceeds 4.7 Gyr before the galaxies merge and contributes to 24% of the total SFR.
The total mass of gas
inside a region of 50 kpc at the current galaxy age is 5 10 but no cold gas (10000 K) is expected (Figure 2).
Sil’chenko et al. (2010) estimated a similar age (about 1–1.5 Gyr old) of the
stellar populations in the nuclear region of this galaxy and NGC 3626 (Mazzei et al., 2014), both lenticulars.
The stellar nucleus in NGC 3599 at 3 is 5 Gyr old at least.
We find that the average stellar age within is 4.5 Gyr and rises to 5.7 Gyr within 2.4 .
Ages weighted by -band luminosity become younger, 3.4 and 4.8 Gyr (Table 3), respectively, in good agreement with the previous findings by Sil’chenko et al. (2010).
At odds with us, Sil’chenko et al. (2010) suggested that this ETG results from a minor merger.
Simulated and observed maps in Figure 3 do not show any signature of interactions, in good agreement with the findings
of Marino et al. (2013).
NGC 3605. (catalog )
A merger of two triaxial systems with a mass ratio of 1:1 and total mass
in Table 2 matches well with the -band absolute magnitude,
the SED, and the morphology of this dwarf E galaxy
(Figures 1 and 3).
The spins of the merging systems are equal (=0.06, MC03),
perpendicular, and both aligned with the shorter of their principal axes.
The age of the galaxy is 13.8 Gyr.
The SFR proceeds about 3 Gyr before the merger and contributes to 16% of the total SFR.
The average stellar age within is 5 Gyr and becomes 6 Gyr
within 2 (weighted by -band luminosity: 3.4 Gyr and 4.3 Gyr, respectively).
The system does not form stars at the selected snapshost, consistent with the
overall picture of an old E (Nolan et al., 2007; Marino et al., 2013).
The amount of cold gas provided by the simulation is, on average, lower than 510 in the last stages of its evolution
(Figure 2), in
agreement with Welch et al. (2010) who measured less than 4.810. These authors also estimated a stellar mass of
1.510
comparable with our value, 210 (from Table 3).
NGC 3607. (catalog )
The simulated -band magnitude (Table 3), the SED (Figure 1), and the morphology
(Figure 3) of NGC 3607, the brightest member of U376
are well matched by the merging of two triaxial
collapsing systems with a mass ratio of 2:1 and a total mass almost 10 times larger than that of NGC 3605 (Table 2).
This is a direct encounter with a
first pericenter separation, , corresponding to 1/4 of the semi-major axis of
the primary system. The stellar systems merged into a unique configuration about 8 Gyr ago.
The current age of the galaxy is 13.8 Gyr. The SFR proceeds about 6.5 Gyr before the merger and contributes to about
1/5 of the total SFR.
The average stellar age is younger than the galaxy age as a consequence
of the last burst of SF occurring about 3.5 Gyr ago. In the inner () region, the average age of the stellar
component is almost 4 Gyr and becomes slightly younger, 3 Gyr, weighted by -band luminosity. This value
agrees well with the luminosity-weighted age
of 3.10.5 Gyr measured by Annibali et al. (2010) using Lick line-strength indices. The same authors also estimated
a stellar metallicity of 0.0470.012 (their Table 1), in good agreement with our average value, 0.044, inside
.
For this galaxy, the observed SED extends up to FIR including new
AKARI/FIS data333Fluxes at 65 and 160 m are upper limits (Figure 1).
The predicted FIR SED is composed of a warm and a cold dust
component both including polycyclic aromatic hyfrocarbon (PAH) molecules (Mazzei et al., 1992, 1994).
Warm dust is located in regions of high radiation, i.e., in the neighborhood
of OB clusters, whereas cold dust is heated by the interstellar radiation field.
The intensity and the distribution of diffuse radiation field in Figure 1
are the same as derived by Mazzei et al. (1994) for a nearby complete sample of ETGs.
In particular, its warm dust is cooler (46 K instead of 61 K)
and the warm-to-cold energy ratio is four times higher than the average value for ETGs in Mazzei & de Zotti (1994).
The galaxy has a large amount of molecular gas, log M(H2)=9.13
(Temi et al., 2009), which is spatially extended (Young et al., 2011).
The simulation also indicates the presence of a large amount of residual gas
within a sphere centered on the galaxy (Figure 2).
The mass of gas with a temperature 104 K, the
upper limit of cold gas mass (its cooling timescale is much
shorter than the snapshot time range), is 1.5109 at the
age of our fit, in agreement with Temi et al. (2009).
NGC 3608. (catalog )
The merging of two triaxial collapsing systems with a mass ratio of 1:1 and a
total mass slightly larger than that of NGC 3607 (Table 2) accounts for the global properties of this E.
Its simulated (Table 3) agrees well with observations (Table 1), as well as its SED
and morphology (Figures 1 and 3).
The spins of the systems are equal
(=0.06) and both are aligned with the shorter of their principal axes.
They merged into a unique configuration about 12.5 Gyr ago. The SFR proceeded about 1.3 Gyr before the merger
and contributes to about 2% of the total SFR.
The age of the galaxy is 13.8 Gyr. The average stellar age within is about 5 Gyr
and becomes 5.5 Gyr within 2.
Signatures of accretion rest on some photometric and kinematical peculiarities (McDermid et al., 2006). They estimate
a galaxy age in the inner region of 8.9 Gyr.
The FIR SED takes into account the contributions of the warm and cold dust components, both including PAH molecules, as described for NGC 3607.
The intensity and the distribution of diffuse radiation field, which drives cold dust emission, are as in Mazzei et al. (1994).
The warm dust is slightly cooler than their average, with a temperature of
about 55 K instead of 61 K. The warm-to-cold energy ratio is twice that of the
average, i.e., 1 instead of 0.5 as in Mazzei & de Zotti (1994).
No residual SFR is predicted in NGC 3608, in agreement with the mid-infrared results
(Rampazzo et al., 2013), which depict the galaxy as a passively evolving ETG.
The gas accretion history of this simulation (Figure
2) indicates 2.810 of gas within 50 kpc.
Welch et al. (2010) reported a cold gas amount of 1.4 10, in good agreement with our upper limit
of 110 for the cold gas (20000 K).
UGC 06324. (catalog )
The global properties of this dwarf S0, at the outskirts of the U376 group (Figure 6),
are well matched by a simulation of an encounter between two triaxial
collapsing systems of equal mass and perpendicular spins.
Its SED, from FUV to the band, and morphology are shown in Figures 1 and 3, respectively.
Marino et al. (2013) find no obvious signature of interaction in the FUV, NUV,
or in SDSS band images of this galaxy.
The -band absolute magnitude (Table 3) agrees well with
the measured value in Table 1. The total mass involved is 210 (Table 2), but that
of the galaxy is about 10 times less (Table 3).
Its current age is 10.8 Gyr and the average stellar age within
is 5 Gyr (2 Gyr when weighting stellar ages by -band luminosity).
The gas accretion history within 50 kpc, corresponding to 12.5R25, shows
a large amount of gas, 110, at the current
age (the vertical line in Figure 2),
which reduces to 410 within . No cold (10000 K) gas is expected, in agreement with Sengupta & Balasubramanyam (2006).
NGC 3626 (catalog )
This lenticular galaxy has been the subject of a previous paper (Mazzei et al., 2014).
Its global properties are well matched by a simulation of a 2:1 merger with a total mass of 3 10.
In summary, all the ETGs in U376 arise from a major merger except for the dwarf lenticular galaxy UGC 06324 which is the result of a galaxy encounter. Es have the same age, older than 13 Gyr, and S0s are younger than 1 Gyr at least. We note that, as pointed out in Section 3, the total mass of all simulated systems in U376 does not exceed the virial mass of the group (Table 4) from the beginning (Table 2), fulfilling the condition set in Section 2.
3.2 LGG 225: Individual Notes of its ETGs
NGC 3457 (catalog )
This E is well matched by a
simulation of an encounter between two triaxial collapsing halos
of equal mass and perpendicular spins, like UGC 06324, but with a total mass
10 times larger than that of UGC 06324 (Table 2).
The predicted -band absolute magnitude, mag (Table 3),
agrees well with the measured value in Table 1.
All the total photometric data, from FUV to 100 m, are well matched by the
SED provided by our simulation at the selected snapshot (Figure 1).
Warm and cold dust components in the FIR SED, where only upper limits are available, have the same properties as on
average for Es in Mazzei et al. (1994) and Mazzei & de Zotti (1994).
The current age of the simulated galaxy is 11.4 Gyr and its average stellar age within R25, weighted by -band luminosity, is 4 Gyr
(Table 3).
Marino et al. (2010) derived a stellar mass of 2–4109 from their SED fit
extending from FUV to band. This value is within a factor of two from our value,
9.6 , although based on both different lower mass limit of the IMF and SFR (Marino et al., 2014).
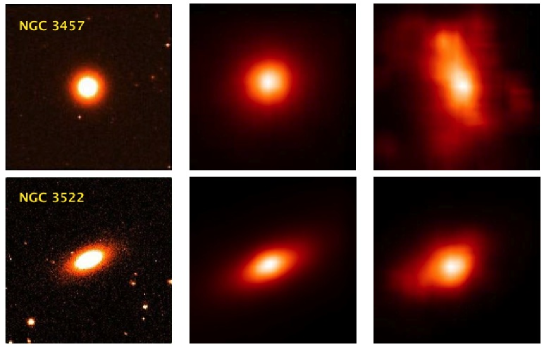
Figure 4 (top panel, left and middle columns) compares, on the same scale and with the same
resolution,
the SDSS -band image of this galaxy with that of our best-fit snapshot.
The gas accretion history within a sphere of radius 50 kpc (16.4) indicates
1.5108 of gas at the current age.
Bettoni et al. (2003) report 108 of HI in this galaxy, in good agreement with our predictions.
Accounting for the further constraint put in Section 2, based on the dynamical analysis of this group (Marino et al., 2014, see Appendix),
this simulation provides a total mass of
5.71011 within a radius corresponding to its
virial radius (1.5 in Table 4), at the current age.
NGC 3522 (catalog )
A merging of two halos with a mass ratio of 1:1 and a total mass five times less than that of NGC 3457
(Table 2) accounts for the evolution of this
dwarf ETG. The spins of the systems are equal (=0.06; MC03),
parallel, and both are aligned with the shorter of their principal axes.
They merge into a unique configuration about 9.4 Gyr ago, the current age of the simulated galaxy
being 12.6 Gyr.
The SFR proceeds about 3.1 Gyr before the merger
and contributes to about 16% of the total SFR.
The -band total magnitude of the simulated galaxy is -17.81 mag,
in good agreement with the values in Table 1. The SED provided by our simulation
best fits all the available total fluxes (Figure 1).
Warm and cold dust components in the FIR SED have the same properties as on average for Es in Mazzei et al. (1994) and Mazzei & de Zotti (1994).
In particular, the fraction of the bolometric luminosity in the FIR range is 0.017, and the luminosity fraction of warm dust
is 0.3 of the FIR luminosity.
The average stellar age within R25 is 4.7 Gyr and
3.3 Gyr weighted by -band luminosity (Table 3).
Marino et al. (2010) estimated a total stellar mass of 1–210 from their SED fit
extending from FUV to band.
Their value agrees well with our value, 3.4, although they used a different
lower mass limit for the IMF and a different SFR (Marino et al., 2014).
Figure 4 (bottom panel, left and middle columns) compares the
SDSS -band image with that of our best-fit snapshot. Figure 2
shows the gas mass evolution within a radius of 50 kpc (i.e., 13 ) from
the -band galaxy center.
There is a large amount of gas, 10, inside such a radius at the selected snapshot,
but the mass of cold gas within 2 is at least 10 times
less, in good agreement with Welch et al. (2010) which report a value of 1.1108 M⊙.
They classified this galaxy as a gas-rich ETG.
The total mass within the virial radius of the group (1.5RH in Table 4) at the current age
is 2.7.
Es in LGG 225 are younger than those in U376 of 1 Gyr at least. NGC 3457 is the result of a galaxy encounter and NGC 3522
arises from a major merger, whereas all the Es in U376 derive from a major merger.
Accounting for previous results,
the total mass of the simulations performed to fit the global
properties of ETGs within the viral radius of the LGG 225 group (Table 4), is
8.4. Therefore, both simulations fulfill the condition set in Section 2.
4 Following the galaxy transformation.
The (NUV-) vs. CMD diagram of U376 and LGG 225
NUV- color is an excellent tracer of even small amounts
(1% mass fraction) of recent (1 Gyr) SF (e.g. Salim et al., 2005; Schawinski et al., 2007, see also Section 1).
By studying a large sample of local (redshift from 0 to 0.11) ETGs, Kaviraj et al. (2007) concluded that at least 30%
of them have NUV- colors consistent with some recent (1 Gyr) SF.
Our fully consistent chemo-photometric simulations permit us to follow not only the NUV- color
variation in the CMD but also the galaxy morphological transformation.
Observations of clusters at 0.2 0.7 (Fasano et al., 2000) show that a sort of conversion in galaxy
population from S to S0s takes place at 0.3–0.4, corresponding to
3–5 Gyr ago. The mechanisms driving the S-to-S0 transformation are still uncertain and debated (e.g. Bekki, 2009).
Recently, Mazzei et al. (2014) analyzed the galaxies NGC 1533 and NGC 3626, two
Sa/S0 galaxies showing ring/arm-like structures
detected in H and FUV. The two galaxies are located in nearby groups
and, in particular NGC 3626 is a member of U376.
They show that these two galaxies have a similar evolution, driven by
a major merging. The star-forming ring/arm-like structures
observed in the above galaxies arise in the latter stages of the merger episode, due to a head-on encounter,
when the galaxies are almost 8 Gyr old.
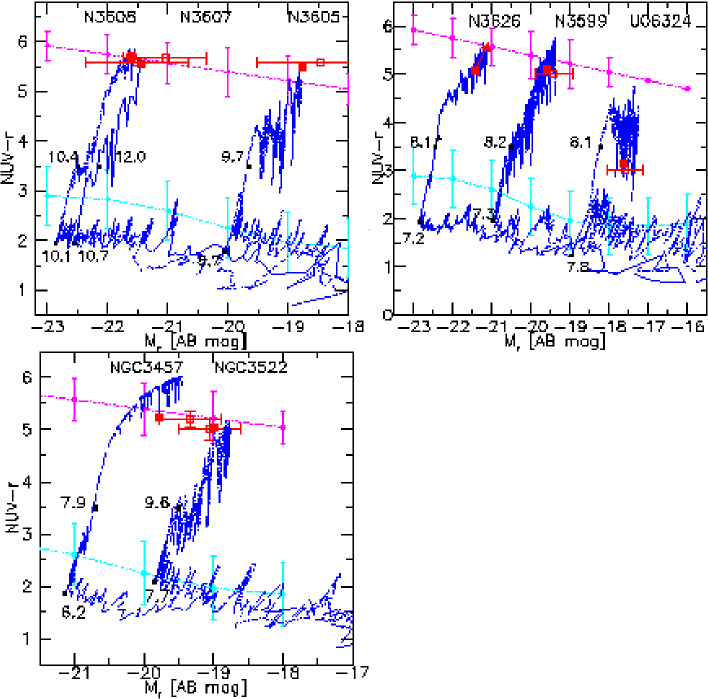
Figure 5 shows the evolutionary paths of ETGs in our groups in the rest-frame
CMD, resulting from theSPH simulations described above.
The evolution of ETGs is stopped at 14 Gyr. Some significant
evolutionary stages are emphasized with dots and bigger dots correspond to their current age.
We assume 3.5 as the NUV- threshold of the GV, this value marks the GV entry of
the brightest galaxy in our sample. We assume 5 for the RS
threshold.
Several “rejuvenation” episodes, which appear in the
CMD as oscillations (see Figure 5), make or keep the color bluer than the RS threshold.
For example, NGC 3457 is about 1 Gyr younger than NGC 3522 (Table 3);
however its stellar populations are, in average, 1 Gyr older. NGC 3522 gets in the GV
after 10 Gyr instead of 8 Gyr as in NGC 3457.
Then, both the galaxies reach their current position on the RS in about 3 Gyr.
The path in the GV of NGC 3522 is marked by several rejuvenation
episodes, at odds with that of NGC 3457.
Therefore, the optical luminosity of NGC 3457 at the current age is dominated by stellar populations older than those in NGC 3522.
The rest-frame CMD of NGC 3607 and NGC 3605 shows rejuvenation episodes that occurred while crossing
the GV, 1 Gyr ago.
In all the S0 galaxies in our sample several rejuvenation episodes
occurred in the last 1 Gyr (Figure 5).
The morphological transformation of selected galaxies in U376 and LGG 225 happened
3.9, 5.1, 3.1, 3.7, and 3.7 Gyr ago for NGC 3599, NGC 3605, NGC 3607, NGC 3608, and UGC 06324, respectively,
and 5.2 and 4.8 Gyr for NGC 3457 and NGC 3522, respectively. We show the morphology at these lookback times,
(corresponding to their brightest absolute magnitude in the CMD of Figure 5),
in Figure 3 and 4 (right panels) for U376 and LGG 225 members respectively.
From the previous analysis, we conclude that:
(1) Es with current magnitudes brighter than [AB]= -21 mag, lived the
BC more quickly the brighter they are. They reach their current
position on the RS, 2–4 Gyr later, showing few and/or weak fluctuations both in the GV and/or in the RS.
(2) Es whose current magnitudes are lower than [AB] mag,
left the BC 2–4 Gyr before their brighter counterparts, show more oscillations in the GV, and
reach their current position on the RS almost 5 Gyr later.
(3) S0 galaxies in U376 moved through the BC more quickly than Es and they moved more quickly the brighter they are. The brighter S0s
show fewer and weaker fluctuations in the GV.
S0s may either cross the GV and reach the RS in the same time (2–4 Gyr) as well as Es, like
NGC 3626, or spend all their remaining lifetime oscillating from the GV to the RS or vice versa, as in the case of UGC6324, depending on their SF histories.
Therefore, fainter ETGs may experience rejuvenation episodes more frequently than other ETGs.
5 Summary and Conclusions
We explore the merger/interaction scenario starting from collapsing triaxial systems composed of DM and gas
and combine the SPH code with the chemo-photometric code based on EPS models.
We trace back the evolution of ETGs in two groups of the Leo cloud, U376 and LGG 225, using
chemo-photometric SPH simulations that are able to match their current global properties.
Simulations of isolated collapsing halos, in the same framework of parameters, indeed, do not reach the same goal.
Here we focus on their SED, morphology, and -band absolute magnitude, and on
their evolutionary path in the rest-frame, NUV– CMD.
This diagram is a powerful diagnostic tool to detect very low levels of SF.
The transition from the BC, where the analyzed ETGs stay at least 7 Gyr, across the GV,
lasts about 3–5 Gyr.
Fasano et al. (2000) found that a sort of conversion in
galaxy population from S to S0s takes place at 0.3–0.4, corresponding to 3–5 Gyr ago,
in good agreement with our findings (see also Mazzei et al., 2014) .
Excursions into the GV from the RS, driven by the acquisition of fresh
gas for SF, are more numerous for dwarf ETGs, so
fainter ETGs may experience rejuvenation episodes more frequently than the brightest, more massive ones.
Some Es in our sample, namely NGC 3607 and NGC 3605 in U367, and
NGC 3522 in LGG 225, experienced rejuvenation episodes within the last 1 Gyr
during their walk through the GV, in agreement with the findings of Kaviraj et al. (2007).
The evolutionary history of most of the ETGs are well matched
by a single wet major merger episode of two halos. SF episodes are regulated by
the secondary episodes of gas infall.
The S0 galaxy U06324 in U376, and the E galaxy NGC 3457 in LGG 225 have the SF quenched by a close encounter
with a companion.
Within the above framework, we suggest that at least one of the
mechanisms of the morphological and photometric transformation of S
into S0s in groups, is gravitational, unrelated to the
intragroup hot medium (Mazzei et al., 2014).
We find that the ETGs in U376 and LGG 225 have followed
different evolutionary paths and experienced merger phenomena. The ETGs have come
from different areas of the cosmic web, within the virial radius of this
group. This picture agrees well with the findings of Wetzel et al. (2012).
They found no significant environmental effects on galaxies before they cross the
of a more massive host halo, which, in our case, would be built up by the
same galaxies we see now, at their current age.
Es in LGG 225 are younger than those in U376 by 1 Gyr at least. NGC 3457 is the result of a galaxy encounter and NGC 3522
arises from a major merger, whereas all the Es in U376 derive from a major merger.
The results of our simulations agree well with the dynamical analysis of these groups,
which puts LGG 225 in a pre-virialized phase and U376 in a more evolved phase, toward virialization although not virialized yet (Marino et al., 2014).
Facilities: GALEX, and SDSS
Appendix A Summary of the Dynamical Analysis of U376 and LGG 225
Summary of the Kinematical and Dynamical Analysis of U376 and LGG 225
We performed a kinematical and dynamical analysis of U376 and LGG 225, whose membership
haa been fully defined in previous papers (Marino et al., 2010, 2013), accounting for the recipes
given by Perea et al. (1990) and Firth et al. (2006). As discussed in these papers, a large scatter in the
properties of the group could arise
from this approach depending on if we weight by luminosity or not, and on the adopted
wavelength (Marino et al., 2010; Bettoni et al., 2011), due
to the different distributions of mass and light.
Marino et al. (2014) presented the non-luminosity-weighted dynamical properties of U376 using
=75 km s-1 Mpc-1.
Here, we apply the same recipes with =70 km s-1 Mpc-1 (Section 1).
Errors are derived via the jackknife method (Efron, 1982). Table 4 summarizes our
results which are the same, within the errors, of the previous paper, showing that the H0 value
adopted here does not produce a meaningful change in the dynamical results.
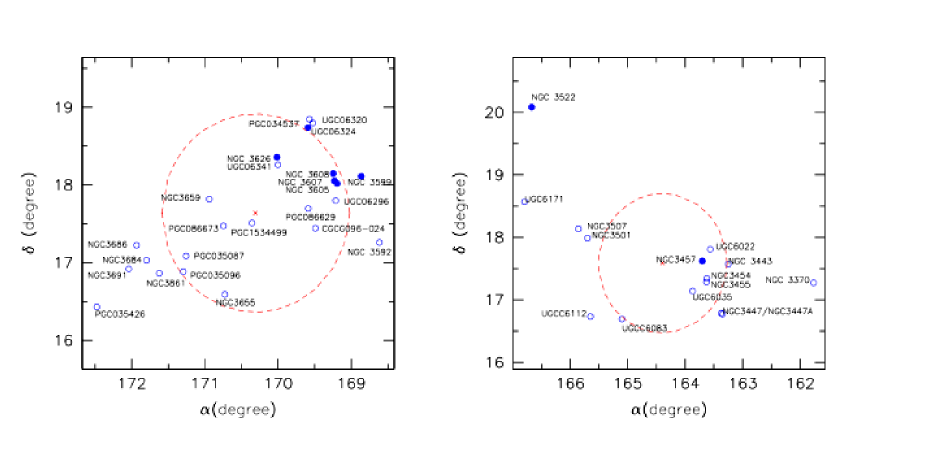
Figure 6 emphasizes the positions of our selected ETGs.
In both the groups, the ETGs appear far away from the dynamical center of the group. Moreover,
accounting for the presence of substructures in U376 (Marino et al., 2013)
and the large crossing-time characterizing LGG 225 (Table 4), probably both groups are not virialized yet.
| Group | Galaxy | Type | scalea | D25 | re | B | MB |
| ETG | (kpc ″-1 | (kpc) | (kpc) | (mag) | Range (mag) | ||
| U376 | |||||||
| NGC 3599 | S0 | 0.081 | 11.6 | 2.431 | 12.780.08 | -17.91 -18.33 | |
| NGC 3605 | E | 0.072 | 5.4 | 1.241–1.51 | 13.060.28 | -17.23 -17.81 | |
| NGC 3607 | E-S0 | 0.089 | 24.4 | 3.92–5.81 | 10.830.17 | -20.04 -20.51 | |
| NGC 3608 | E | 0.110 | 20.2 | 3.71–4.33 | 11.460.26 | -19.93 -20.32 | |
| NGC 3626 | S0-a | 0.127 | 22.3 | 3.3 | 11.700.23 | -20.11 -20.38 | |
| UGC 06324 | S0 | 0.097 | 8.0 | 14.660.32 | -16.52 -17.20 | ||
| LGG 225 | |||||||
| NGC 3457 | E | 0.104 | 6.1 | – | 12.80.24 | -18.55 -18.84 | |
| NGC 3522 | E | 0.107 | 7.5 | – | 13.90.28 | -17.49 -17.84 |
| Group | Galaxy | Npart(t=0) | a | ||||||||
|---|---|---|---|---|---|---|---|---|---|---|---|
| ETG | (kpc) | (kpc) | (kpc) | (km/s) | (km/s) | () | |||||
| U376 | |||||||||||
| NGC 3599 | 8104 | 597 | 1/4 | 343 | 343 | 38 | 38 | 80 | |||
| NGC 3605 | 8104 | 474 | 1/5 | 218 | 218 | 34 | 34 | 40 | |||
| NGC 3607 | 6104 | 1014 | 1/4 | 390 | 778 | 38 | 76 | 300 | |||
| NGC 3608 | 6104 | 1014 | 1/10 | 263 | 263 | 104 | 104 | 400 | |||
| NGC 3626 | 6104 | 1014 | 1/10 | 273 | 546 | 52 | 104 | 300 | |||
| UGC06324 | 8104 | 376 | 1/3 | 506 | 506 | 18 | 18 | 20 | |||
| LGG 225 | |||||||||||
| NGC 3457 | 8104 | 810 | 1/3 | 621 | 621 | 45 | 45 | 200 | |||
| NGC 3522 | 8104 | 474 | 1/5 | 218 | 218 | 34.2 | 34.2 | 40 |
| Group | Galaxy | ||||||||
|---|---|---|---|---|---|---|---|---|---|
| ETG | (Gyr) | (Gyr) | (10) | (/) | (mag) | ||||
| U376 | |||||||||
| NGC 3599 | 12.2 | 4.8 | 0.013 | 1.8 | 22.7 | 0.41 | 0.01 | -18.37 | |
| NGC 3605 | 13.8 | 3.8 | 0.012 | 0.29 | 14.5 | 0.23 | 0.05 | -17.57 | |
| NGC 3607 | 13.8 | 4.0 | 0.015 | 11.2 | 17.6 | 0.30 | 0.01 | -20.25 | |
| NGC 3608 | 13.8 | 6.0 | 0.018 | 10.9 | 16.9 | 0.31 | 0.002 | -20.37 | |
| NGC 3626 | 11.5 | 4.5 | 0.016 | 11.5 | 18.8 | 0.19 | 0.08 | -20.23 | |
| UGC 6324 | 10.8 | 1.9 | 0.005 | 0.16 | 6.3 | 0.24 | 0.24 | -16.75 | |
| LGG 225 | |||||||||
| NGC 3457 | 11.4 | 4.3 | 0.010 | 0.15 | 18.2 | 0.35 | 0.03 | -18.54 | |
| NGC 3522 | 12.5 | 3.3 | 0.019 | 0.48 | 11.7 | 0.26 | 0.03 | -17.80 |
| Group | Center | Velocity | Harmonic | Virial | Projected | Crossing | ||
|---|---|---|---|---|---|---|---|---|
| Name | of Mass | Dispersion | Radius | Mass | Mass | Time | ||
| RA [deg] Dec (deg) | (km/s) | (km/s) | (Mpc) | (Mpc) | (10) | (10) | ||
| U376 | 170.3058 17.6398 | 1134 | 225 | 16.20 | 0.23 | 1.28 | 3.12 | 0.13 |
| LGG 225 | 164.3925 17.5876 | 1100 | 92.2 | 15.72 | 0.20 | 0.18 | 1.02 | 0.37 |
References
- Annibali et al. (2010) Annibali, F., Bressan, A., Rampazzo, R., et al. 2010, A&A, 519, A40
- Baldry et al. (2004) Baldry, I. K., Glazebrook, K., Brinkmann, J., et al. 2004, ApJ, 600, 681
- Ball et al. (2008) Ball, N. M., Loveday, J., & Brunner, R. J. 2008, MNRAS, 383, 907
- Balogh et al. (2004) Balogh, M. L., Baldry, I. K., Nichol, R., et al. 2004, ApJ, 615, L101
- Bekki (2009) Bekki, K. 2009, MNRAS, 399, 2221
- Bekki & Couch (2011) Bekki, K., & Couch, W. J. 2011, MNRAS, 415, 1783
- Bettoni et al. (2012) Bettoni, D., Buson, L., Mazzei, P., & Galletta, G. 2012, MNRAS, 423, 2957
- Bettoni et al. (2003) Bettoni, D., Galletta, G., & García-Burillo, S. 2003, A&A, 405, 5
- Bettoni et al. (2011) Bettoni, D., Galletta, G., Rampazzo, R., et al. 2011, A&A, 534, A24
- Binggeli & Hascher (2007) Binggeli, B., & Hascher, T. 2007, PASP, 119, 592
- Blanton & Berlind (2007) Blanton, M. R., & Berlind, A. A. 2007, ApJ, 664, 791
- Blanton et al. (2005) Blanton, M. R., Eisenstein, D., Hogg, D. W., Schlegel, D. J., & Brinkmann, J. 2005, ApJ, 629, 143
- Cappellari et al. (2006) Cappellari, M., Bacon, R., Bureau, M., et al. 2006, MNRAS, 366, 1126
- Christensen et al. (2012) Christensen, C., Quinn, T., Governato, F., et al. 2012, MNRAS, 425, 3058
- Christensen et al. (2010) Christensen, C. R., Quinn, T., Stinson, G., Bellovary, J., & Wadsley, J. 2010, ApJ, 717, 121
- Curir & Mazzei (1999) Curir, A., & Mazzei, P. 1999, New A, 4, 1
- de Vaucouleurs et al. (1991) de Vaucouleurs, G., de Vaucouleurs, A., Corwin, Jr., H. G., et al. 1991, Third Reference Catalogue of Bright Galaxies. Volume I: Explanations and references. Volume II: Data for galaxies between 0h and 12h. Volume III: Data for galaxies between 12h and 24h.
- Efron (1982) Efron, B. 1982, The Jackknife, the Bootstrap and other resampling plans
- Faber et al. (1989) Faber, S. M., Wegner, G., Burstein, D., et al. 1989, ApJS, 69, 763
- Fang et al. (2012) Fang, J. J., Faber, S. M., Salim, S., Graves, G. J., & Rich, R. M. 2012, ApJ, 761, 23
- Fasano et al. (2000) Fasano, G., Poggianti, B. M., Couch, W. J., et al. 2000, ApJ, 542, 673
- Firth et al. (2006) Firth, P., Evstigneeva, E. A., Jones, J. B., et al. 2006, MNRAS, 372, 1856
- Garcia (1993) Garcia, A. M. 1993, A&AS, 100, 47
- Gonzalez et al. (2013) Gonzalez, A. H., Sivanandam, S., Zabludoff, A. I., & Zaritsky, D. 2013, ApJ, 778, 14
- González-Samaniego et al. (2013) González-Samaniego, A., Colín, P., Avila-Reese, V., Rodríguez-Puebla, A., & Valenzuela, O. 2013, arXiv: astro-ph/1308.4753
- Hogg et al. (2004) Hogg, D. W., Blanton, M. R., Brinchmann, J., et al. 2004, ApJ, 601, L29
- Just et al. (2010) Just, D. W., Zaritsky, D., Sand, D. J., Desai, V., & Rudnick, G. 2010, ApJ, 711, 192
- Kauffmann et al. (2004) Kauffmann, G., White, S. D. M., Heckman, T. M., et al. 2004, MNRAS, 353, 713
- Kaviraj et al. (2007) Kaviraj, S., Schawinski, K., Devriendt, J. E. G., et al. 2007, ApJS, 173, 619
- Kawata & Mulchaey (2008) Kawata, D., & Mulchaey, J. S. 2008, ApJ, 672, L103
- Kroupa (2012) Kroupa, P. 2012, PASA, 29, 395
- Krumholz & Tan (2007) Krumholz, M. R., & Tan, J. C. 2007, ApJ, 654, 304
- Lewis et al. (2002) Lewis, I., Balogh, M., De Propris, R., Couch, W., & et al. 2002, MNRAS, 334, 673
- Marino et al. (2014) Marino, A., Bianchi, L., Mazzei, P., & et al. 2014, arXiv:astro-ph/1309.5031, Advanced in Space Research, Special Iusses: Ultraviolet Astrophysics, accepted, 53
- Marino et al. (2010) Marino, A., Bianchi, L., Rampazzo, R., Buson, L. M., & Bettoni, D. 2010, A&A, 511, A29
- Marino et al. (2011a) Marino, A., Bianchi, L., Rampazzo, R., et al. 2011a, ApJ, 736, 154
- Marino et al. (2011b) Marino, A., Rampazzo, R., Bianchi, L., et al. 2011b, MNRAS, 411, 311
- Marino et al. (2013) Marino, A., Plana, H., Rampazzo, R., et al. 2013, MNRAS, 428, 476
- Martin et al. (2005) Martin, D. C., Fanson, J., Schiminovich, D., & et al. 2005, ApJ, 619, L1
- Martin et al. (2007) Martin, D. C., Wyder, T. K., Schiminovich, D., et al. 2007, ApJS, 173, 342
- Mazzei (2003) Mazzei, P. 2003, Research Signapost, 37/661, India; Recent Research Developments in Astronomy & Astrophysics, 1, 457
- Mazzei (2004) —. 2004, arXiv:astro-ph/0401509
- Mazzei & Curir (2003) Mazzei, P., & Curir, A. 2003, ApJ, 591, 784
- Mazzei & de Zotti (1994) Mazzei, P., & de Zotti, G. 1994, ApJ, 426, 97
- Mazzei et al. (1994) Mazzei, P., de Zotti, G., & Xu, C. 1994, ApJ, 422, 81
- Mazzei et al. (2014) Mazzei, P., Marino, A., Rampazzo, R., & et al. 2014, arXiv:astro-ph/1306.0777, Advanced in Space Research, Special Iusses: Ultraviolet Astrophysics, in press, 53
- Mazzei et al. (1992) Mazzei, P., Xu, C., & de Zotti, G. 1992, A&A, 256, 45
- McDermid et al. (2006) McDermid, R. M., Emsellem, E., Shapiro, K. L., et al. 2006, MNRAS, 373, 906
- Navarro et al. (1997) Navarro, J. F., Frenk, C. S., & White, S. D. M. 1997, ApJ, 490, 493
- Nolan et al. (2007) Nolan, L. A., Dunlop, J. S., Panter, B., et al. 2007, MNRAS, 375, 371
- Paturel et al. (2003) Paturel, G., Petit, C., Prugniel, P., et al. 2003, A&A, 412, 45
- Perea et al. (1990) Perea, J., del Olmo, A., & Moles, M. 1990, A&A, 237, 319
- Ramella et al. (2002) Ramella, M., Geller, M. J., Pisani, A., & da Costa, L. N. 2002, AJ, 123, 2976
- Rampazzo et al. (2013) Rampazzo, R., Panuzzo, P., Vega, O., & et al.. 2013, MNRAS accepted
- Salim et al. (2012) Salim, S., Fang, J. J., Rich, R. M., Faber, S. M., & Thilker, D. A. 2012, ApJ, 755, 105
- Salim & Rich (2010) Salim, S., & Rich, R. M. 2010, ApJ, 714, L290
- Salim et al. (2005) Salim, S., Charlot, S., Rich, R. M., et al. 2005, ApJ, 619, L39
- Salpeter (1955) Salpeter, E. E. 1955, ApJ, 121, 161
- Schawinski et al. (2007) Schawinski, K., Kaviraj, S., Khochfar, S., et al. 2007, ApJS, 173, 512
- Sengupta & Balasubramanyam (2006) Sengupta, C., & Balasubramanyam, R. 2006, MNRAS, 369, 360
- Sil’chenko et al. (2010) Sil’chenko, O. K., Moiseev, A. V., & Shulga, A. P. 2010, AJ, 140, 1462
- Spavone et al. (2012) Spavone, M., Iodice, E., Bettoni, D., et al. 2012, MNRAS, 426, 2003
- Spavone et al. (2009) Spavone, M., Iodice, E., Calvi, R., et al. 2009, MNRAS, 393, 317
- Strateva et al. (2001) Strateva, I., Ivezić, Ž., Knapp, G. R., et al. 2001, AJ, 122, 1861
- Temi et al. (2009) Temi, P., Brighenti, F., & Mathews, W. G. 2009, ApJ, 707, 890
- Tinker et al. (2012) Tinker, J. L., George, M. R., Leauthaud, A., et al. 2012, ApJ, 755, L5
- Trinchieri et al. (2012) Trinchieri, G., Marino, A., Mazzei, P., Rampazzo, R., & Wolter, A. 2012, A&A, 545, A140
- Valdarnini (2002) Valdarnini, R. 2002, ApJ, 567, 741
- Villalobos et al. (2012) Villalobos, Á., ., De Lucia, G., Borgani, S., & Murante, G. 2012, MNRAS, 424, 2401
- Warren et al. (1992) Warren, M. S., Quinn, P. J., Salmon, J. K., & Zurek, W. H. 1992, ApJ, 399, 405
- Wei et al. (2010) Wei, L. H., Kannappan, S. J., Vogel, S. N., & Baker, A. J. 2010, ApJ, 708, 841
- Welch et al. (2010) Welch, G. A., Sage, L. J., & Young, L. M. 2010, ApJ, 725, 100
- Wetzel et al. (2012) Wetzel, A. R., Tinker, J. L., & Conroy, C. 2012, MNRAS, 424, 232
- Wilman et al. (2009) Wilman, D. J., Oemler, Jr., A., Mulchaey, J. S., et al. 2009, ApJ, 692, 298
- Wyder et al. (2007) Wyder, T. K., Martin, D. C., Schiminovich, D., et al. 2007, ApJS, 173, 293
- Yamamura et al. (2009) Yamamura, I., Makiuti, S., Ikeda, N., et al. 2009, in Astronomical Society of the Pacific Conference Series, Vol. 418, AKARI, a Light to Illuminate the Misty Universe, ed. T. Onaka, G. J. White, T. Nakagawa, & I. Yamamura, 3
- Young et al. (2011) Young, L. M., Bureau, M., Davis, T. A., et al. 2011, MNRAS, 414, 940