Pinning modes of high magnetic field Wigner solids with controlled alloy disorder
Abstract
For a series of samples with 2D electron systems in dilute AlxGa1-xAs, with varying from to , we survey the pinning mode resonances of Wigner solids at the low Landau filling termination of the fractional quantum Hall effect (FQHE) series. For all studied, the pinning modes are present with frequencies, , that are consistent with collective weak pinning. For we find vs exhibits a rapid increase that is not present for . We find the observed is much smaller than values calculated with a simple Wigner solid model which neglects the effects of the disorder on the charge distribution of a carrier.
pacs:
In two-dimensional electron systems (2DES) hosted in GaAs an insulating phase occurs at the low Landau filling factor () termination of the fractional quantum Hall effect (FQHE) fqhorig series. The insulator is understood as a form of Wigner solidwcpredict ; jaincfnew ; jaincfwc ; msreview ; db ; williams91 ; willett1 ; willett2 ; buhmann ; kukushkinwctri ; yewc ; lessc ; murthyrvw , a state of matter composed of charge carriers arranged to minimize their mutual repulsion while constrained to a fixed density by charge neutrality. The role of the disorder is crucial in producing the insulating behavior, since the Wigner solid is necessarily pinned by any disorder.
The spectra of the low insulating phases of 2DES exhibit a microwave or rf resonancedb ; williams91 ; willett1 ; willett2 ; lessc ; yewc that is identified as a pinning mode flr ; williams91 ; willett2 ; lessc ; yewc ; murthyrvw , in which pieces of the solid oscillate collectively about their pinned positions. This disorder-induced mode is a powerful tool for study of solid phases in 2DES, which occur under many conditionsmurthyrvw besides the low insulator. But a detailed understanding of how the solid phase is pinned is lacking. The frequency, , of the resonance has been qualitatively found to increase with increasing accidental disorder, as roughly characterized by the mobilities of a variety of samples, but there is no systematic experimental knowledge of the relationship between the disorder characteristics and the pinning mode, and no microscopic picture of the solid in the presence of disorder.
This paper presents pinning mode measurements of the low insulator in a series of samples with quantifiable, controlled alloy disorder, produced by using a dilute Al alloy, AlxGa1-xAs, as the channel in which the 2DES resides. The characteristics of these samples have been well established in earlier work on these wafers wanliscatt ; wanlireentrant ; wanlisclg ; wanlisclganderson ; wanlisclgcross . In particular, study wanliscatt of the mobility vs has shown that for % the Al is randomly distributed in the channel, and has allowed modeling the potential around each Al atom as a spherical square well with known radius and potential-depth parameters. Relevant for high magnetic field () studies, both this radius and the typical Al spacing in three dimensions are much less than the magnetic length, , for all nonzero that we studied, and for any accessible . The samples we studied with had to Al within the typical volume of a carrier.
An important aspect of the disorder in 2DES in high is its effect on the boundary between the insulating phase and fractional quantum Hall liquid states. The lowest disorder n-type 2DES in GaAs are insulating for up to the 1/5 FQHE, and also have a narrow reentrant range of insulating phase just above the 1/5 FQHE. Samples of somewhat larger disorder remain insulating up to the 1/3 FQHEshahar ; wwkyang . One explanation of this is that the pinning energy, which allows the solid to reduce the charge near high points in the impurity potential, can stabilize the Wigner solidpricezhulouie against transition to fractional quantum Hall liquids. Using samples from some of the same wafers studied in this paper, ref (wanlireentrant, ) describes how the phase boundary between the insulating phase and fractional quantum Hall liquid states is shifted to higher by dilute Al alloy disorder, and demonstrates the terminal (lowest ) FQHE is at 1/3 for . For the samples of Ref. wanlireentrant, , and in one other casewwkyang , a reentrant range of insulator in a narrow range of above the 1/3 FQHE can be present.
We find that the resonance is clearly observable even at the largest of 0.85%, at which is increased from its value by about one order of magnitude. Considering only the known densities of the samples, and using a classical shear modulusbm the disorder-enhanced are consistent with the weak pinning picturefl ; chitra ; fertig ; foglerhuse , in which the carrier positions are determined by a tradeoff between the disorder potential and the electron-electron interaction, and the disorder potential is not completely dominant. In the samples increases rapidly as decreases into the insulating phase, in rough agreement with the theories. We estimate the parameters of the disorder in a simple model that takes a carrier of the lattice to have the fixed charge distribution of a lowest Landau level orbital. Using these disorder parameters in weak pinning theorieschitra ; foglerhuse overestimates the effect of the alloy disorder, and predicts that pinning resonances, if present at all, would be at much higher frequency than we observed. This discrepancy could be resolved by the charge distribution at a carrier in the disordered samples responding in a way that reduces pinning energy.
The form of transmission-line-baseddb broadband microwave spectroscopy technique we use has been described elsewhere zhwuneq ; murthyrvw . We calculated the real part of diagonal conductivity, Re, from the loss on transmission line patterned in metal film directly on the sample surface, about 180 nm above the 2DES. The transmission is of coplanar waveguide type, as is shown schematically in Figure 1a. We used a room-temperature transmitter and receiver to measure the transmitted power, , and present data calculated from where m is the slot width between center line and ground plane of the coplanar waveguide, is the reference power obtained from an average of transmitted power at and . is the characteristic impedance calculated from the transmission line geometry for , and is the length of the line ( mm). The formula is a low loss, high frequency approximation valid to within about 20%, from comparison with a detailed calculation, like that described in Ref. zhwuneq, , including the distributed capacitive coupling and allowing for higher loss and reflection. We estimate the 2DES temperature to be approximately 50 mK, as read by nearby resistance thermometers. Slight broadening of the resonance could be discerned on increasing the temperature above that value. The data are taken in the low microwave power limit, in which further decrease of power (at all frequencies measured, and at 50 mK) does not affect the measurement.
In the samples we studied the 2DES is confined at a single AlGaAs /AlxGa1-xAs heterojunction, where or for the layer in which the 2DES mainly resides, and is the Al concentration of the spacer layer. Table 1 shows typical densities () for the microwave measurements, and low temperature mobilities from different pieces of the same waferswanliscatt ; wanlithesis , scaledpfeiffermu to the densities shown. The samples were grown in two series with different characteristicswanlithesis ; series 1 includes and with , and series 2 includes and with . There is other disorder present in addition to that due to the Al in the channel. This background disorder arises from the potential from remote ionized donors, alloy disorder in the spacer, interface roughness and accidental impurities introduced throughout the growth; this background disorder is what gives rise to the pinning mode in the sample. The mobilities in Table 1 clearly show a larger background disorder for series 1; for example the sample of series 2 has higher mobility than lower samples in the series 1. Various densities, , were prepared by brief low temperature illumination before the measurements.
| Wafer | |||
| (%) | Name | (106 cm2/V-s) | ( cm-2) |
| 0 | 7-30-97-2 | 2.0 | 4.6 |
| 0.21 | 8-21-97-2 | 2.3 | 5.9 |
| 0.33 | 8-06-97-1 | 1.7 | 5.6 |
| 0.40 | 12-03-04-1 | 2.6 | 4.9 |
| 0.80 | 12-06-04-1 | 1.6 | 4.9 |
| 0.85 | 7-30-97-2 | 0.72 | 8.2 |
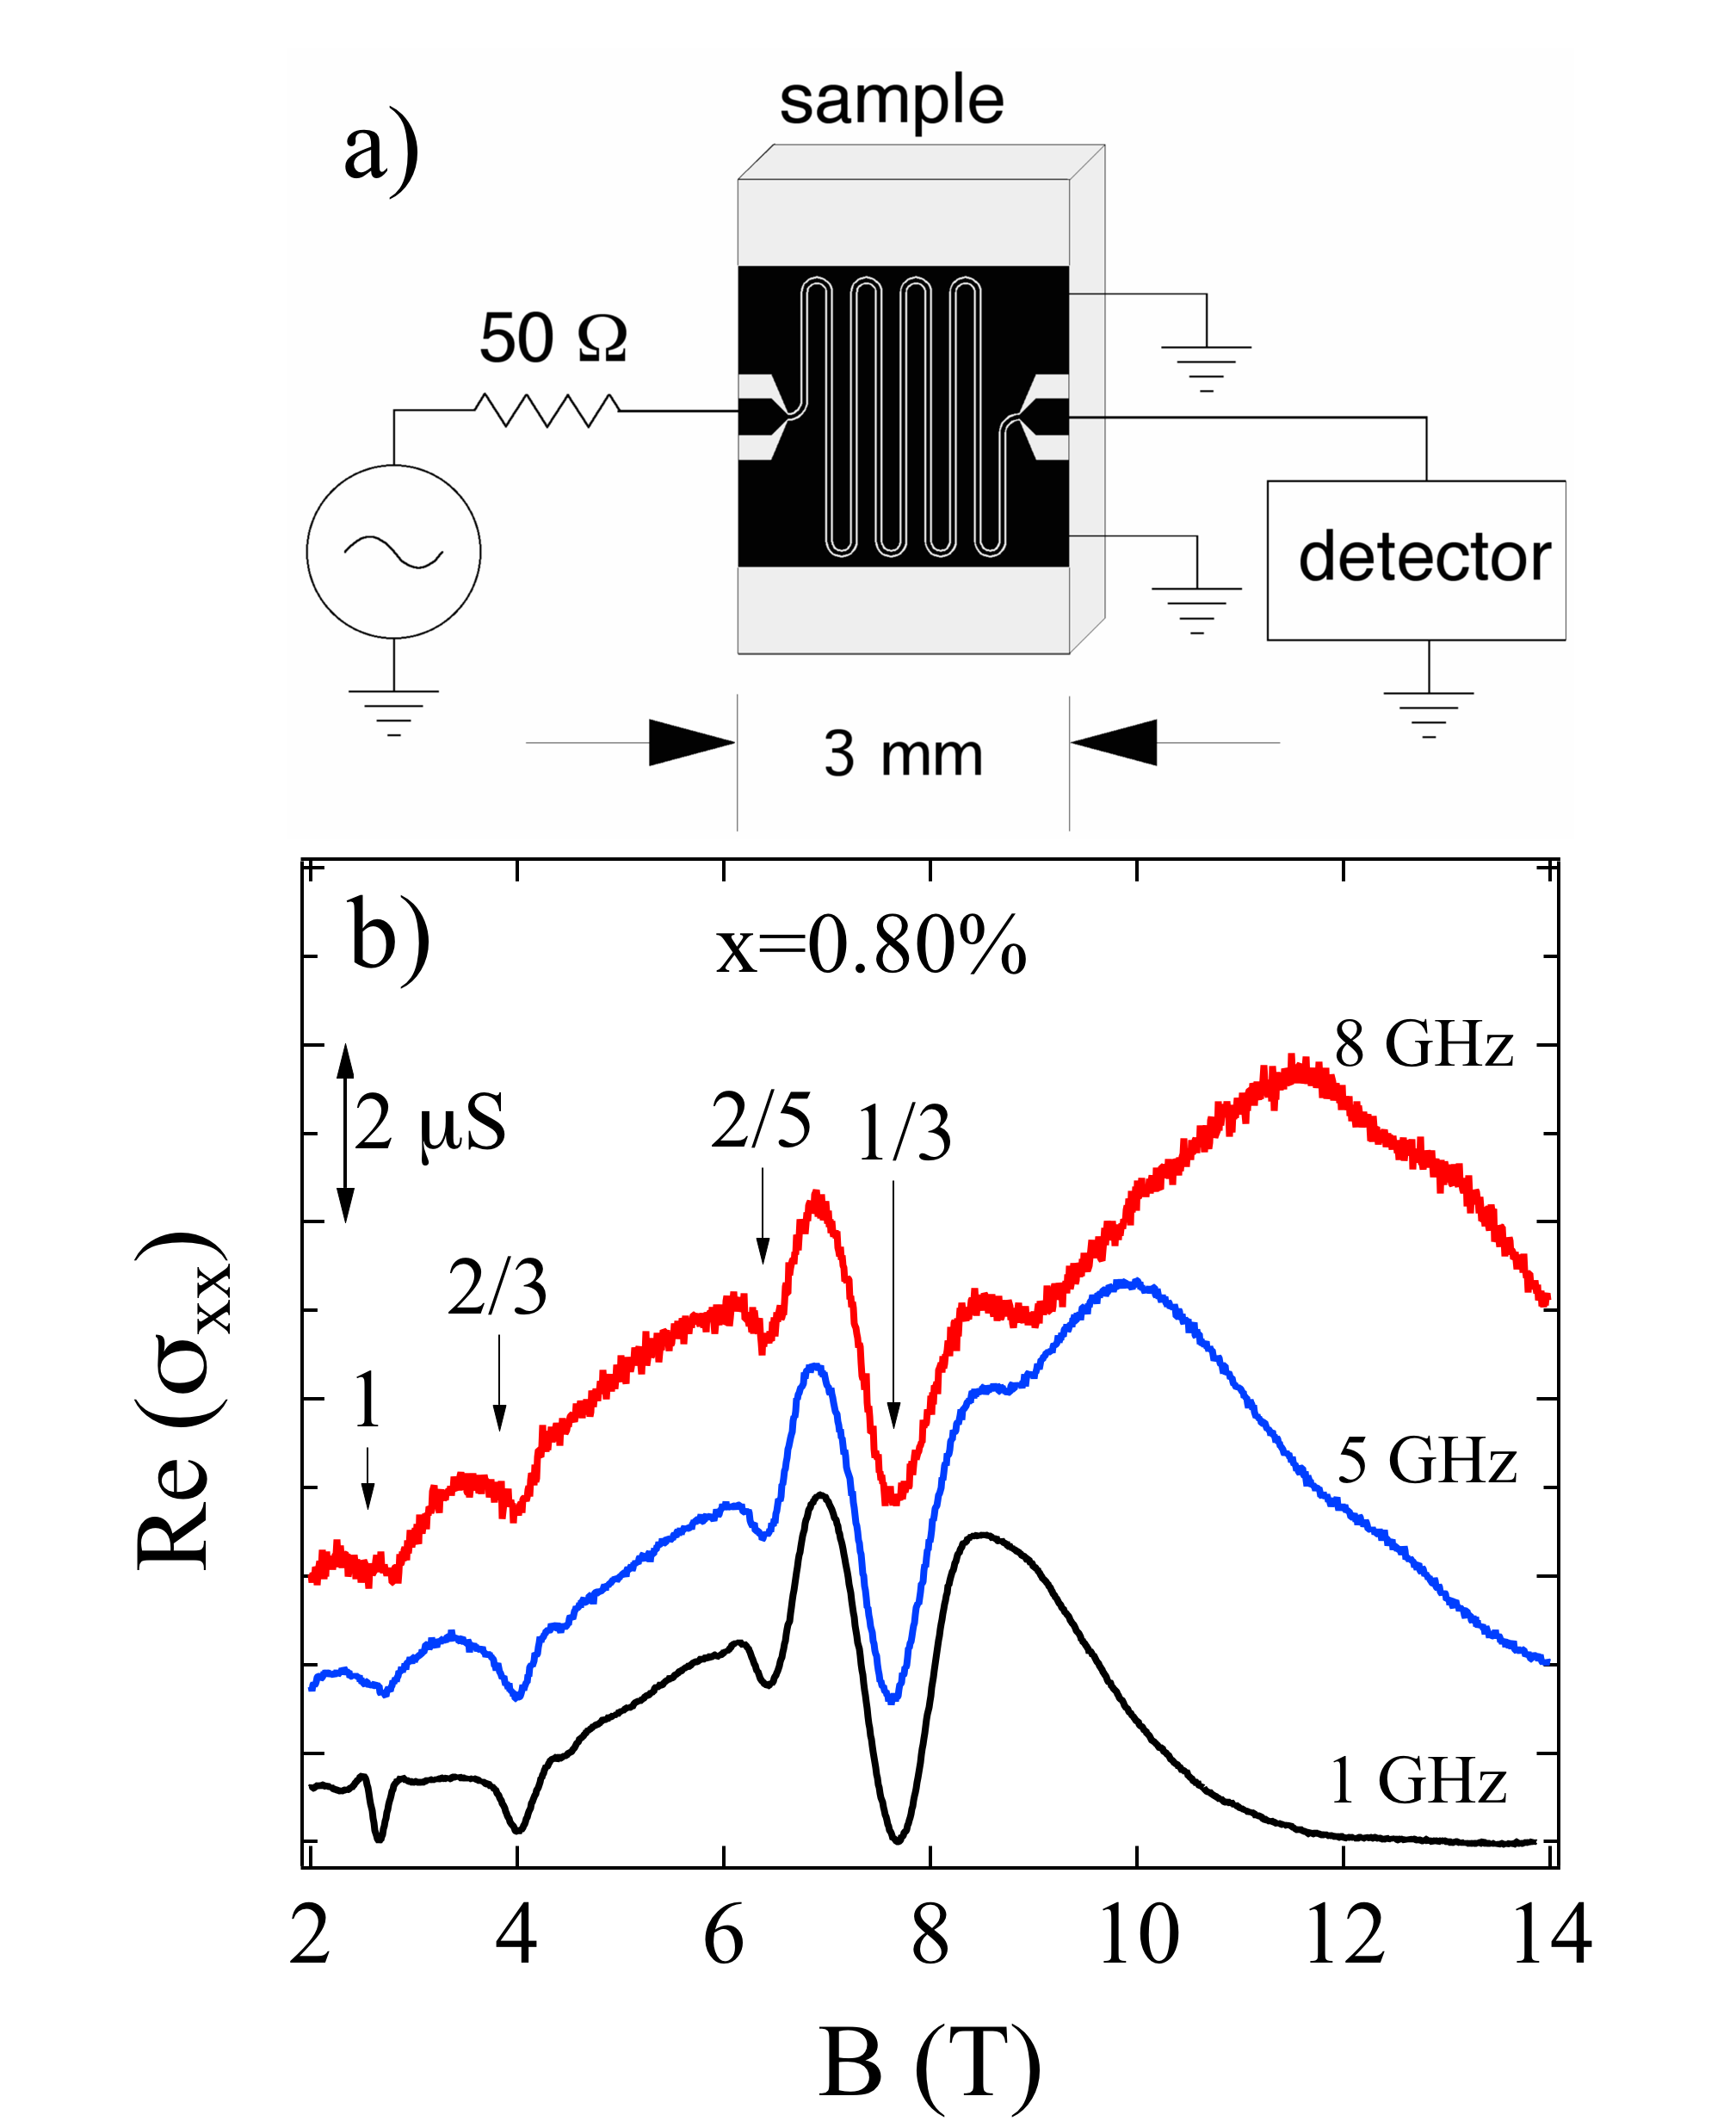
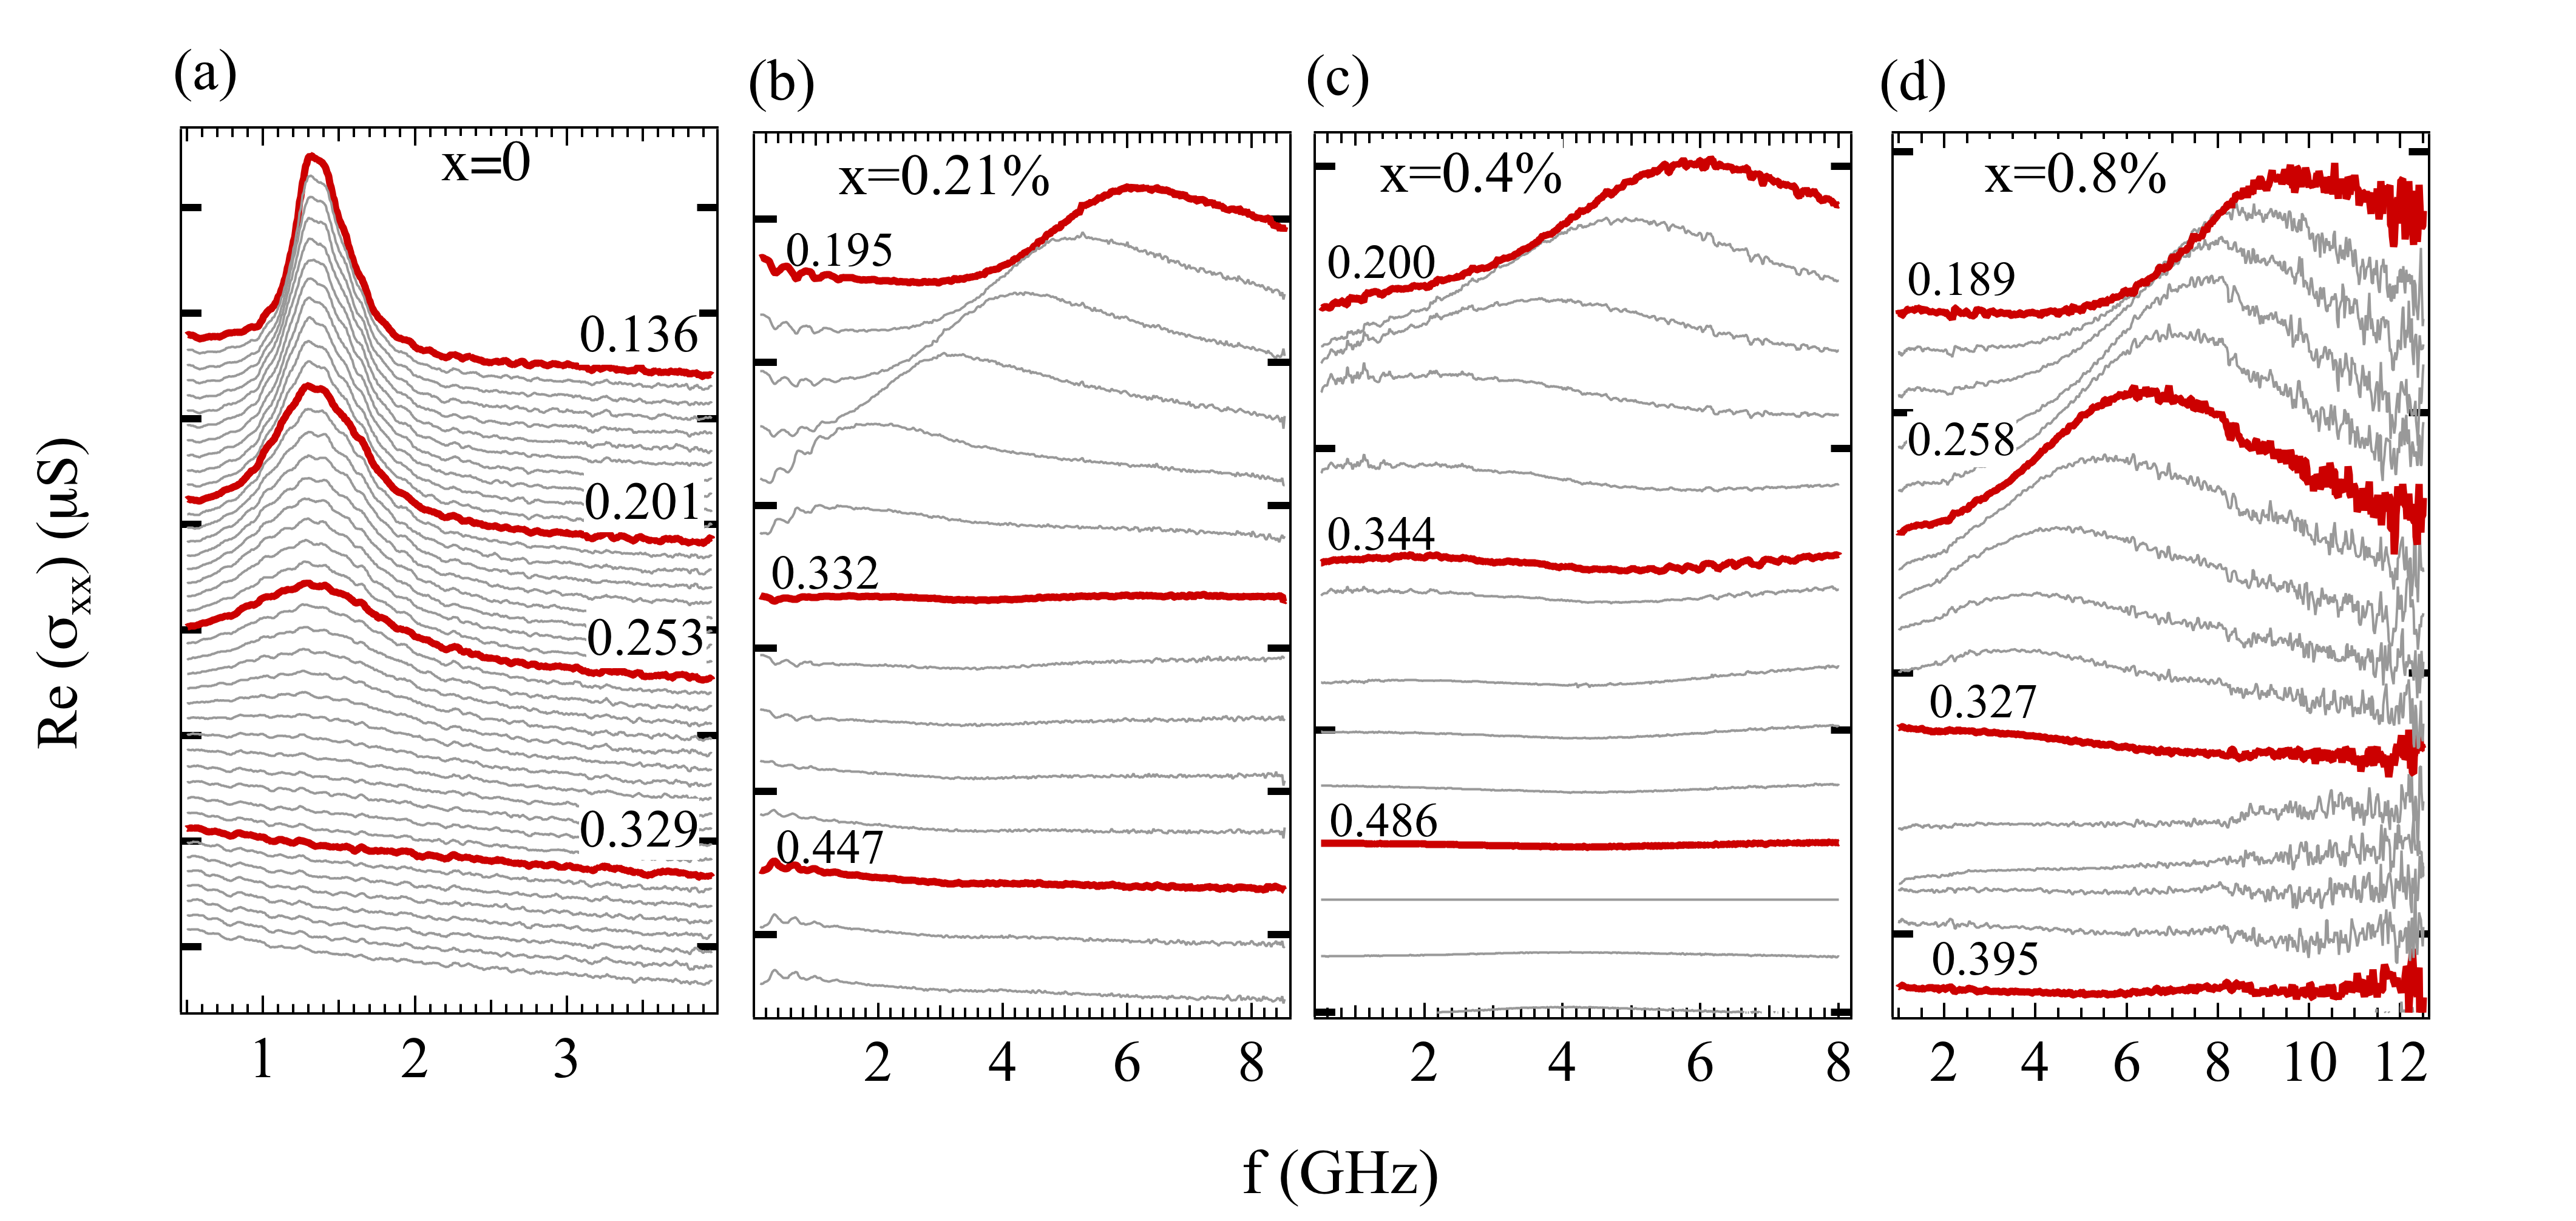
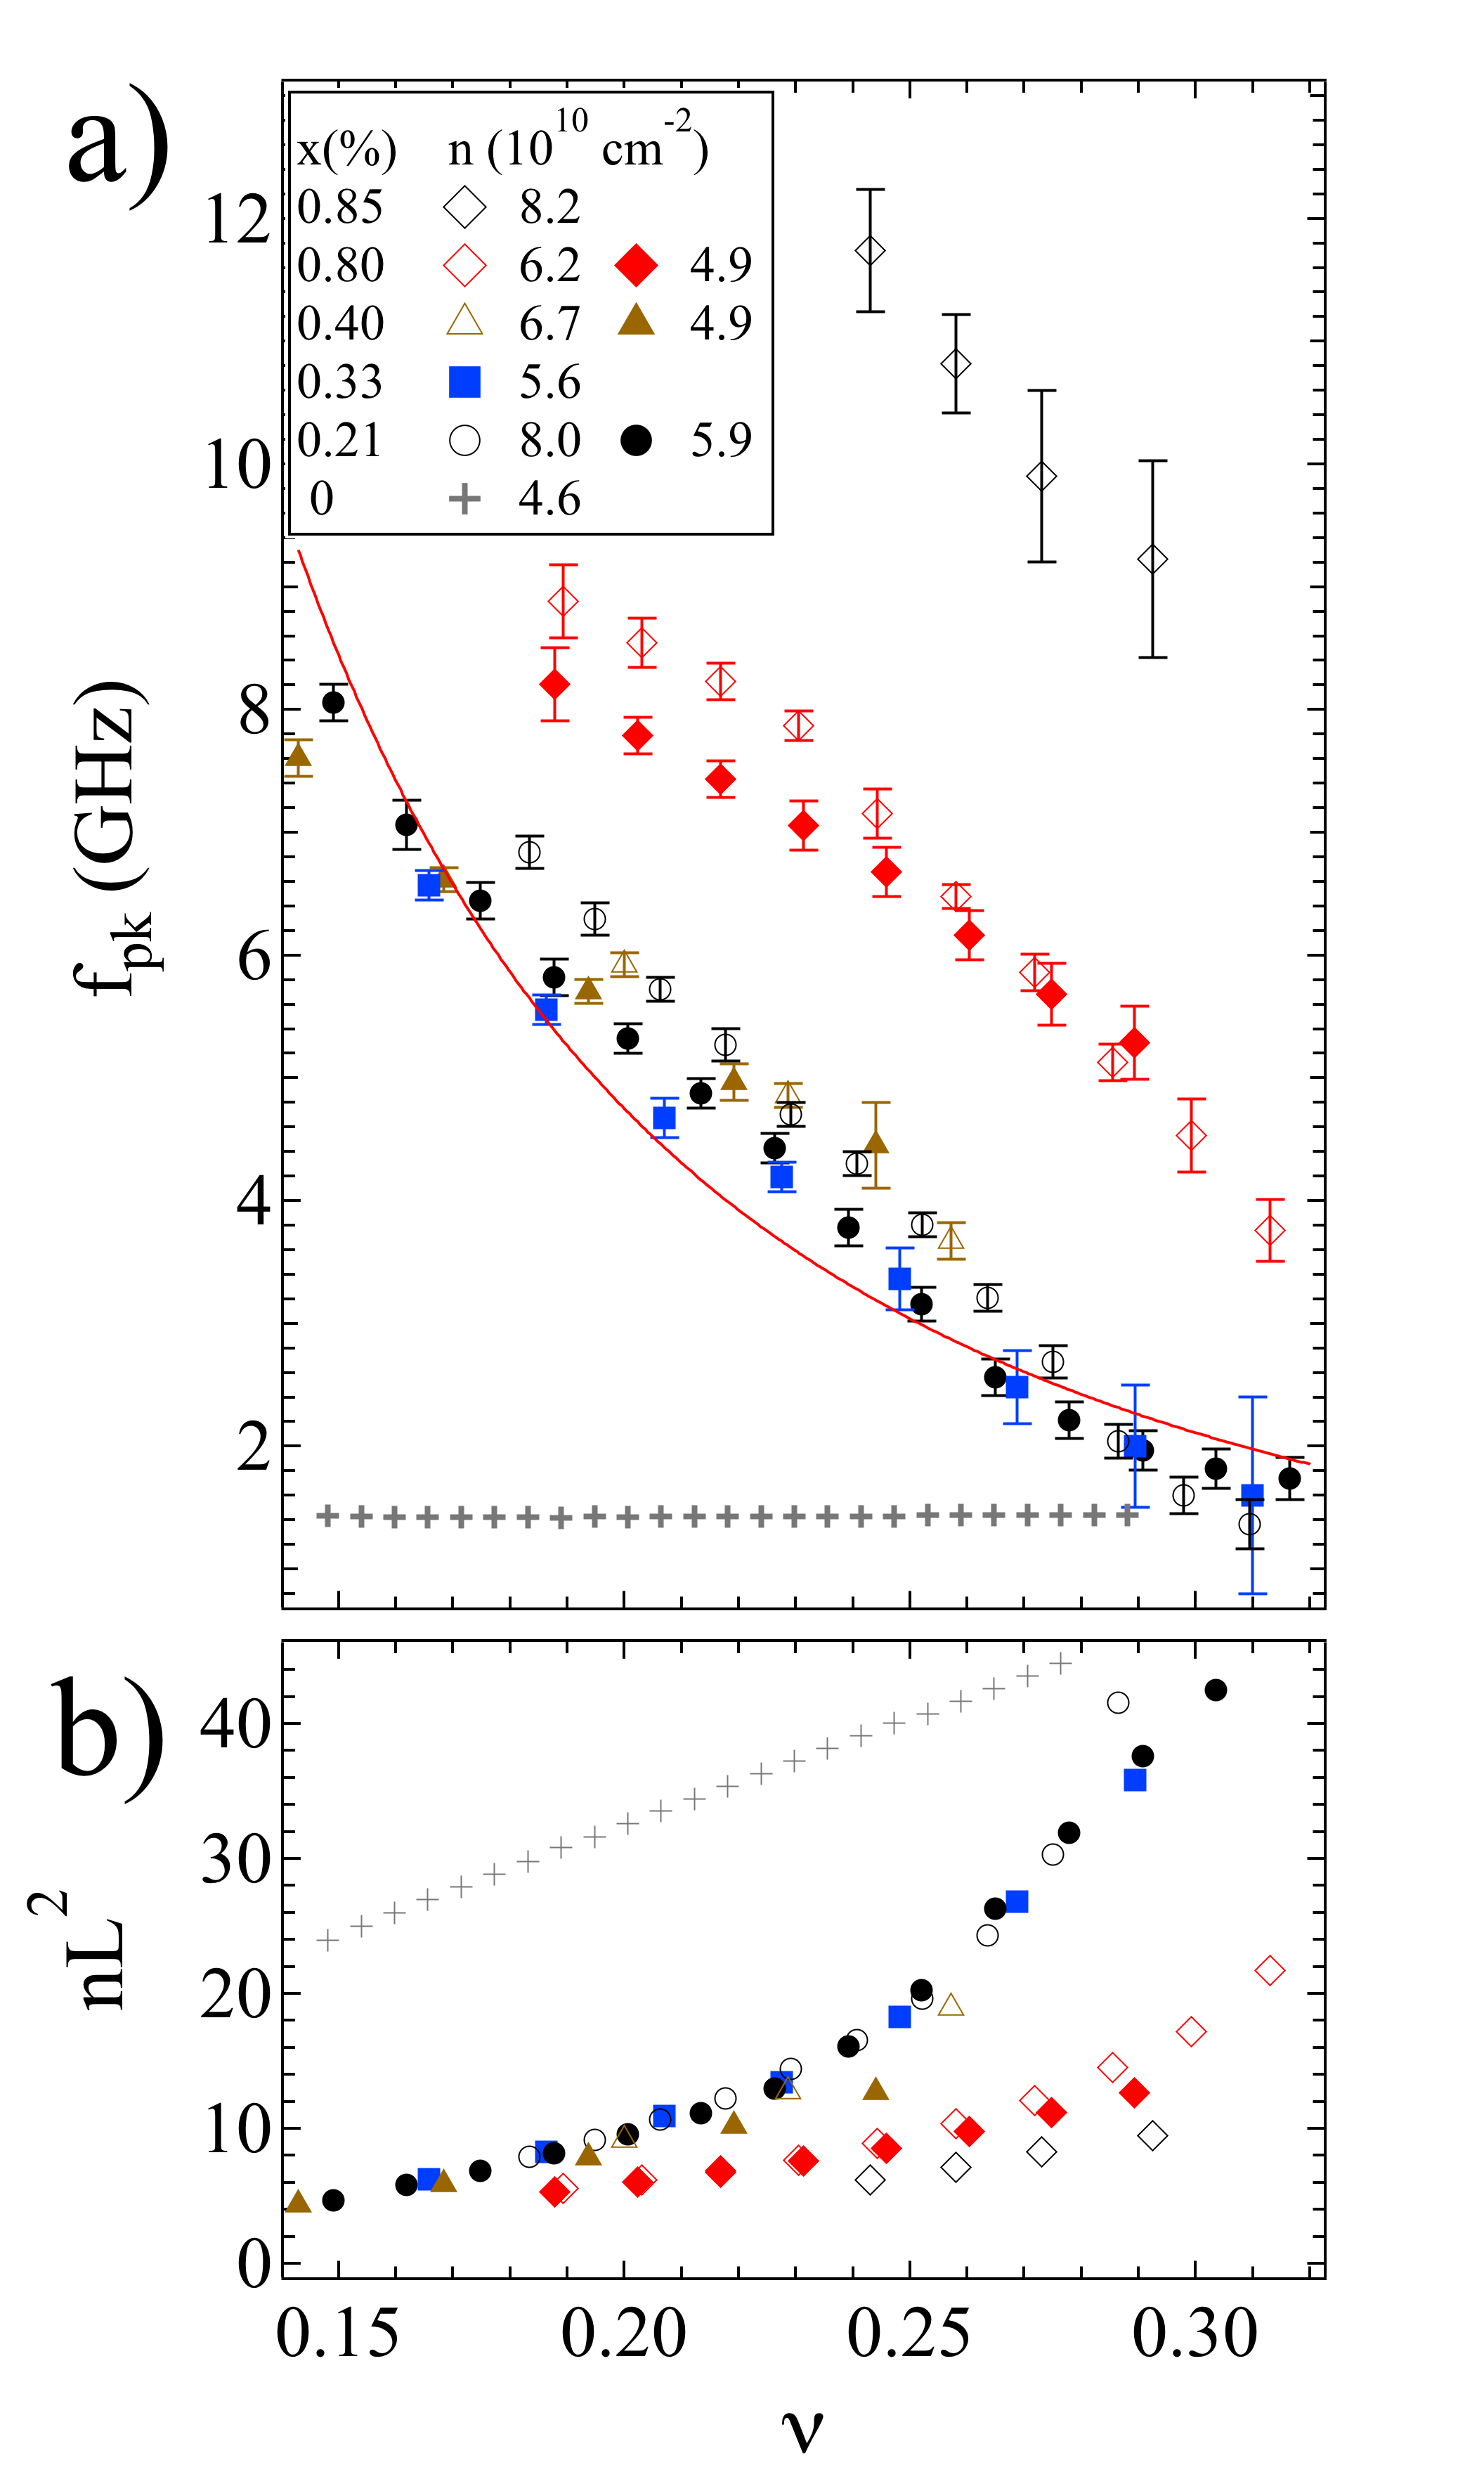
Figure 1b shows Re vs at , and GHz, for the sample with . Dips at and are clearly visible confirming the finding wanlireentrant that the alloy disorder does not inhibit formation of these FQHE states. FQHE features are present for the lower samples as well. In the figure there is slight decrease of , of about 3% as increases to 8 T, and the marked on the figure are taken from the 1/3 FQHE minimum. is calculated from that minimum for all data presented in this paper. As goes below 1/3, the 5 and 8 GHz traces increase markedly owing to the onset of the pinning resonance. Reference wanlireentrant, reported a reentrant insulating phase for between the 1/3 and 2/5 FQHE’s for an Al alloyed sample with and much larger ; the data in Figure 1b show no sign of a resonance in that range.
Figure 2 shows spectra taken at many for the samples with and . For , at cm-2, the resonance emerges as is decreased below 1/3, growing sharper and developing large peak conductivity as is decreased further. The resonance appears superposed on a smaller, decreasing smooth background, which is an artifact of the normalization power . , an average of measurements taken at integer , had a component that decreased with , which we ascribe to parallel conduction. The background has no significance for our results.
A resonance is clearly present for the samples with , as shown in Figure 2b, c and d. As in the sample of Figure 2a, the resonance develops as is decreased below 1/3. For all the samples with , the resonance frequency shifts upwards as decreases.
Figure 3a shows vs for all the samples. for can be regarded as a background, and is much smaller than the for other curves, except where the resonance is quite weak, near the low- edge of the 1/3 FQHE. This means that for the well-developed resonances with , the Al dilute alloy is the main contribution to the pinning frequency. For there is little variation in vs for the several values presented. However, on increasing to there is again a definite increase in . The relatively small change of between and may be explainable by background disorder, contributed by other sources than the deliberately introduced Al. Except for the and samples of series 1, whose resonance frequencies are close together, at any increases with within each series.
In the collective pinning case, the solid deformation occurs over a large enough length that deformation energy can be calculated from the shear modulus . Theories fl ; chitra ; foglerhuse ; fertig for the collective pinning case connect a correlation length of the crystalline order to independent of other characteristics of the disorder, as .For collective pinning to apply, is required. As a rough estimate we take to be the classical value for point particles in a triangular lattice bm . Calculations jaincfnew ; narevichfertig ; jaincfwc that take quantum effects into account using the composite fermion picture give values of that are about 30% larger than for the relevant range of . Figure 3b shows the the number of carriers per domain () vs , with calculated in this way using . Particularly for larger , including conditions under which the resonance is well developed, the collective pinning condition is satisfied.
A semiclassical picture foglerhuse ; chitra ; fertig was developed to explain high magnetic field Wigner solid pinning in weak disorder with correlation length smaller than . In the semiclassical model the carrier guiding centers move in an “effective potential” that results from convolving the true impurity potential with the charge distribution “form factor” of a carrier. Using the notation of Ref. foglerhuse, , the true impurity potential is characterized by its correlation length and its variance . The charge distribution of each carrier is taken from single particle lowest Landau level orbitals in symmetric gauge, a Gaussian of characteristic radius . In the case , which would holds true for the Al alloyed samples considered here, the effective potential (resulting from the convolution) has correlation length and variance . Minimizing the total of deformation and pinning energies gives
| (1) |
.
The theories foglerhuse ; chitra predict that for collective pinning with the . A curve of is superposed on the data in Figure 3a. While the data are clearly not a fit to , the relation roughly describes the extent of the change of over the experimental range of . The discrepancy between the data and may be due to an increase as decreases. Such variation of vs has been predicted jaincfnew ; narevichfertig , using theory based on composite fermion Wigner solids. The change of with in Figure 3a is in contrast with the essentially flat vs for , and is an effect of the alloy disorder. In other work, moderate mobility samples without deliberately induced disorder yewc ; lessc ; clibdep have vs increasing sublinearly as enters the insulating phase or exhibiting a shallow maximum yewc .
It is of interest to try to apply the known parameters of the alloy disorder potential to the semiclassical weak pinning calculations. In this picture, the energy due to each Al in contact with the carrier is , where are the volume and depth of the spherical square well from Ref. wanliscatt, , and is an effective volume of the carrier. Thickness is estimated from the Fang-Howard wave function afsnote at the sample density, . Defining as the density of the dilute Al, , where is the unit cell volume of the AlxGa1-xAs, there are an average of Al per carrier. and total pinning energy per carrier due to Al is 140 K. With randomly distributed Al, the variance, , of the pinning energy of a domain (area ) is . Energy is minimized by setting , where is the displacement required to randomize the carrier pinning energy. Taking obtains equations (1) for and with substituted by .
The results of this calculation, however, are not consistent with the observation of a microwave-range resonance in the samples. The calculated is about three orders of magnitude too large for any of the resonances shown in this paper, and the calculated would be much less than . The pinning energy per Landau orbital carrier is about half the cyclotron energy for the largest of and T. It is possible that the carrier wave function is affected by disorder, so that the Landau orbital is a poor approximation. With random short-range disorder a more spread-out charge distribution would produce weaker pinning. In equations 1 this larger effective carrier size could be modeled by substituting with a larger length. Correlations between carriers, such those incorporated in the composite fermion picture jaincfnew are also likely to be of importance. A more complete picture of a disorder pinned state including correlations was considered by Yannouleas and Landmann yl . They found that larger disorder produces pinned charge-density-wave-like states with reduced charge modulation amplitude, compared with that of Wigner crystals in the low disorder case.
In summary, we have found well-developed microwave resonances in 2DES hosted in dilute AlxGa1-xAs, in the solid at the low termination of the FQHE series, for up to . Relative to the case, the Al significantly increases and also causes a much stronger increase of as decreases into the range of the solid phase. Semiclassical theory for the case of weak disorder, in which a carrier is taken as having a lowest Landau level single-particle form, is not adequate to explain the observation of the pinning modes in the Al alloyed samples.
We thank Kun Yang and J. K. Jain for helpful discussions. The work at Princeton was partially funded by the Gordon and Betty Moore Foundation and the NSF MRSEC Program through the Princeton Center for Complex Materials (DMR-0819860). The microwave spectroscopy work at NHMFL was supported through DOE grant DE-FG02-05-ER46212 at NHMFL/FSU. NHMFL is supported by NSF Cooperative Agreement No. DMR-0084173, the State of Florida and the DOE.
References
- (1) D. C. Tsui, H. L. Stormer, and A. C. Gossard Phys. Rev. Lett. 48, 1559 (1982).
- (2) Y. E. Lozovik and V. I. Yudson, JETP Lett., 22, 11 (1975); P. K. Lam and S. M. Girvin,Phys. Rev. B 30, 473 (1984); Kun Yang, F. D. M. Haldane, and E. H. Rezayi Phys. Rev. B 64, 081301 (2001).
- (3) A. C. Archer, Kwon Park, Jainendra K. Jain, Phys. Rev. Lett., 111, 146804 (2013).
- (4) Chia-Chen Chang, Csaba Töke, Gun Sang Jeon, and Jainendra K. Jain Phys. Rev. B 73, 155323 (2006); Chia-Chen Chang, Gun Sang Jeon, and Jainendra K. Jain Phys. Rev. Lett.94, 016809 (2005).
- (5) M. Shayegan, in Perspectives in Quantum Hall Effects, edited by S. Das Sarma and A. Pinczuk (Wiley-Interscience, New York, 1997), p. 343.
- (6) E. Y. Andrei, G. Deville, D. C. Glattli, F. I. B. Williams. E. Paris, and B. Etienne, “Observation of a magnetically induced Wigner solid,” Phys. Rev. Lett. 60, 2765 (1988).
- (7) F. I. B. Williams, P. A. Wright, R. G. Clark, E. Y. Andrei, G. Deville, D. C. Glattli, O. Probst, B. Etienne, C. Dorin, C. T. Foxon, and J. J. Harris Phys. Rev. Lett. 66, 3285 (1991).
- (8) M. A. Paalanen, R. L. Willett, R. R. Ruel, P. B. Littlewood, K. W. West, L. N. Pfeiffer and D. J. Bishop, Phys. Rev. B 45, 11342 (1992).
- (9) M. A. Paalanen, R. L. Willett, R. R. Ruel, P. B. Littlewood, K. W. West, L. N. Pfeiffer and D. J. Bishop, Phys. Rev. B45, 13784 (1992).
- (10) H. Buhmann, W. Joss, K. v. Klitzing, I. V. Kukushkin, A. S. Plaut, G. Martinez, K. Ploog, and V. B. Timofeev, Phys. Rev. Lett. 66, 926 (1991).
- (11) I. V. Kukushkin, Vladimir I. Fal ko, R. J. Haug, K. von Klitzing, K. Eberl, and K. T temayer Phys. Rev. Lett. 72, 3594(1994).
- (12) P. D. Ye, L. W. Engel, D. C. Tsui, R. M. Lewis, L. N. Pfeiffer, and K. West, Phys. Rev. Lett. 89, 176802 (2002).
- (13) L. W. Engel ,C.-C. Li, D. Shahar, D. C. Tsui and M. Shayegan, Solid State Commun., 104 167-171 (1997).
- (14) G. Sambandamurthy, Zhihai Wang, R.M. Lewis, Yong P. Chen, L.W. Engel, D.C. Tsui, L.N. Pfeiffer and K.W. West, Solid State Commun. 140, 100 (2006) contains a brief review.
- (15) Hidetoshi Fukuyama and Patrick A. Lee Phys. Rev. B 18, 6245 (1978).
- (16) Wanli Li, G.A. Csáthy, D.C. Tsui, L.N. Pfeiffer, and K.W. West, Appl. Phys. Lett. 83, 2832 (2003).
- (17) Wanli Li, D. R. Luhman, D. C. Tsui, L. N. Pfeiffer, and K. W. West Phys. Rev. Lett. 105, 076803 (2010).
- (18) Wanli Li, G.A. Csáthy, D. C. Tsui, L. N. Pfeiffer, and K. W. West Phys. Rev. Lett. 94, 206807 (2005).
- (19) Wanli Li, C. L. Vicente, J. S. Xia, W. Pan, D. C. Tsui, L. N. Pfeiffer, and K. W. West Phys. Rev. Lett. 102, 216801 (2009).
- (20) Wanli Li, J. S. Xia, C. Vicente, N. S. Sullivan, W. Pan, D. C. Tsui, L. N. Pfeiffer, and K. W. West Phys. Rev. B 81, 033305 (2010).
- (21) D. Shahar, D. C. Tsui, M. Shayegan, R. N. Bhatt and J. E. Cunningham, Phys. Rev. Lett. 74, 4511 (1995).
- (22) I. Yang, W. Kang, S. T. Hannahs, L.N. Pfeiffer, and K.W. West, Phys. Rev. B 68, 121302(R) (2003).
- (23) R. Price, Xuejun Zhu, P. M. Platzman, and Steven G. Louie Phys. Rev. B 48, 11473 (1993).
- (24) L. Bonsall and A. A. Maradudin Phys. Rev. B15, 1959 (1977).
- (25) H. Fukuyama, and P. A. Lee, Phys. Rev. B 18, 6245 (1978).
- (26) R. Chitra, T. Giamarchi, and P. Le Doussal, Phys. Rev. Lett. 80, 3827 (1998); R. Chitra, T. Giamarchi, and P. Le Doussal, Phys. Rev. B 65, 035312 (2001).
- (27) H. A. Fertig, Phys. Rev. B 59, 2120 (1999).
- (28) M. M. Fogler, and D. A. Huse, Phys. Rev. B 62, 7553 (2000).
- (29) Zhihai Wang, Yong P. Chen, Han Zhu, L. W. Engel, D. C. Tsui, E. Tutuc, and M. Shayegan Phys. Rev. B 85, 195408 (2012).
- (30) Wanli Li, doctoral dissertation, Princeton University, 2007.
- (31) Loren Pfeiffer, K. W. West, H. L. Stormer, and K. W. Baldwin Appl. Phys. Lett. 55, 1888 (1989).
- (32) R. Narevich, Ganpathy Murthy, and H. A. Fertig Phys. Rev. B 64, 245326 (2001).
- (33) C.-C. Li, L. W. Engel, D. Shahar, D. C. Tsui, and M. Shayegan Phys. Rev. Lett. 79, 1353(1997).
- (34) F.F. Fang and W. E. Howard, Phys. Rev. Lett. 16, 797 (1966). We use , where is the band mass. For the 2DES studied here, was between and cm-2, from which the calculated was between 22 and 19 nm.
- (35) C. Yannouleas and U. Landman, Phys. Rev. B 84, 165327 (2011).