Dog Bone Triplet Metamaterial Half Wave Plate
I. Mohamed, G. Pisano, M. W. Ng, V. Haynes, and B. Maffei
Jodrell Bank Centre for Astrophysics, School of Physics and Astronomy
The University of Manchester, United Kingdom
Abstract— Metamaterials are artificially made sub-wavelength structures arranged in periodic arrays. They can be designed to interact with electromagnetic radiation in many different and interesting ways such as allowing radiation to experience a negative refractive index (NRI). We have used this technique to design and build a quasi-optical Half Wave Plate (HWP) that exhibits a large birefringence by virtue of having a positive refractive index in one axis and a NRI in the other. Previous implementations of such NRI-HWP have been narrow band () due to the inherent reliance on needing a resonance to create the NRI region. We manufacture a W-band prototype of a novel HWP that uses the Pancharatnam method to extend the bandwidth (up to more than twice) of a usual NRI-HWP. Our simulated and experimentally obtained results despite their differences show that a broadening of a flat region of the phase difference is possible even with the initially steep gradient for a single plate.
1 Introduction
Electromagnetic metamaterials are artificially created sub-wavelength structures and are known for their use in creating a negative refractive index (NRI), an effect first demonstrated in 2000 [1].
Wave plates are used to alter the polarisation of radiation passing through them. Rotating HWPs are used to rotate linear polarisations at twice their mechanical rotation speed. Conventionally made from birefringent materials such as sapphire or quartz, wave plates can also be constructed out of metal mesh grids [2]. Such constructions are advantageous due to the costs and limited dimensions of the available birefringent materials at these frequencies and the ability to scale the designs to work at other frequencies. Their use is becoming increasingly important in Cosmic Microwave Background Radiation experiments where the detection of the weak B-mode polarisation is the current goal in observational cosmology.
The phase difference, , between the two polarisations of radiation of frequency, , after passing through a wave plate of thickness, , is given by
| (1) |
where is the speed of light in a vacuum and is the difference in the refractive indices of the birefringent materials two orthogonal axes. By designing a metamaterial with a geometry that has a NRI along one axis and a positive index along the other we are able to create a wave plate with very high birefringence: this allows the creation of relatively thin wave plates. Previous implementations [3, 4] of metamaterial wave plates that have used NRI were narrow band in nature due to the NRI region only occurring in the narrow resonance band and the high gradient of the phase difference in this band. In this paper we seek to show how the functional bandwidth can be increased by utilisation of the Pancharatnam method [5] that has been successfully used in the past with birefringent materials [6].
2 Cell Geometry and Design
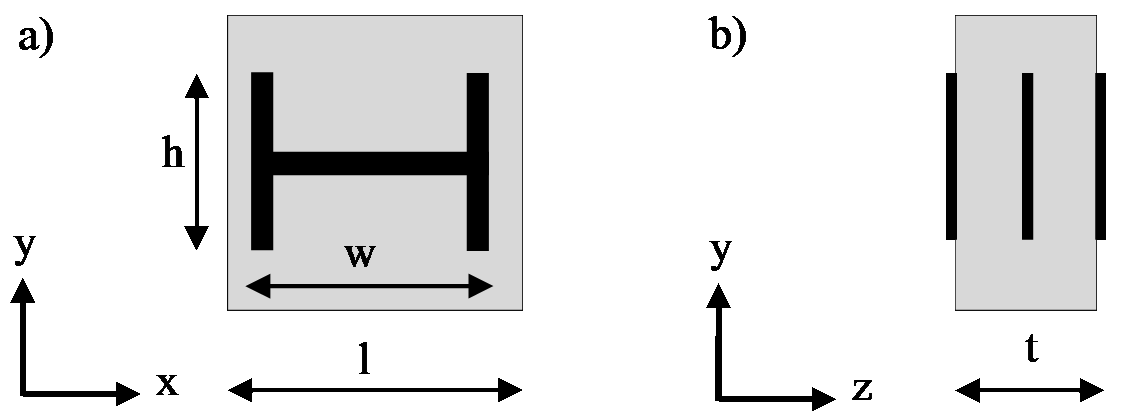
Metal mesh structures can be modelled by isolating a single cell that is in practice reproduced periodically in a two-dimensional array. The electromagnetic properties of the cell can be optimised using finite element analysis software, such as HFSS [7], imposing periodic boundary conditions around it. To create the required phase difference we based our design on a dog bone geometry (also referred to as “I” or “H” in the literature). The metal grid is made of a thick evaporated copper layer, supported by a polypropylene () substrate. The HWP unit cell consists of a triplet of dog bones, with only the middle one embedded in the substrate. All the dimensions are given in the caption to Figure 3. The cell dimensions were optimised at , the centre of the W-band, in order to have transmissions and differential phase-shift along the axes respectively satisfying: and .
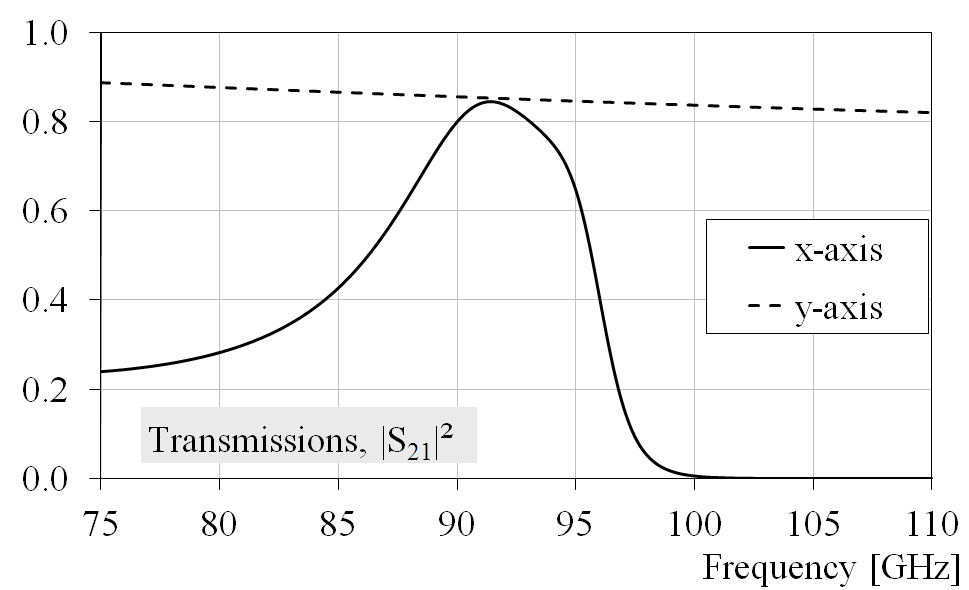
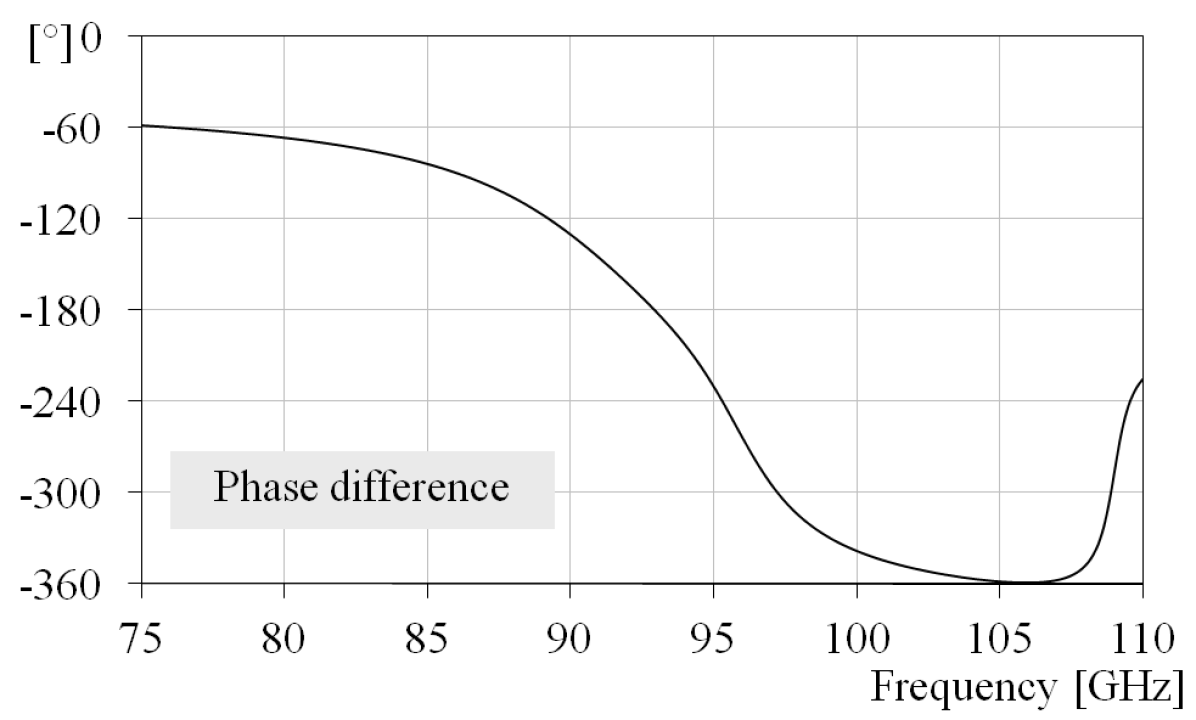
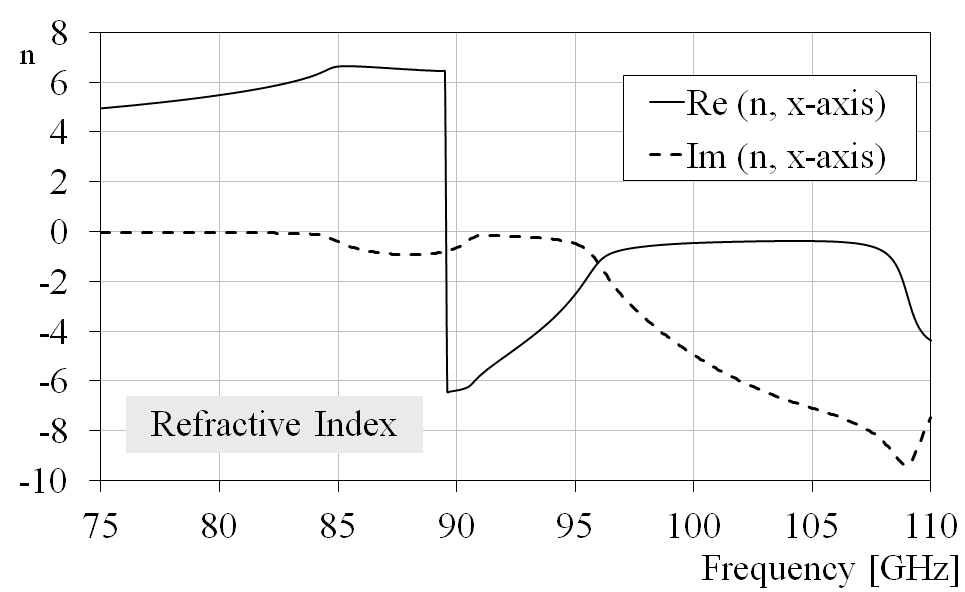
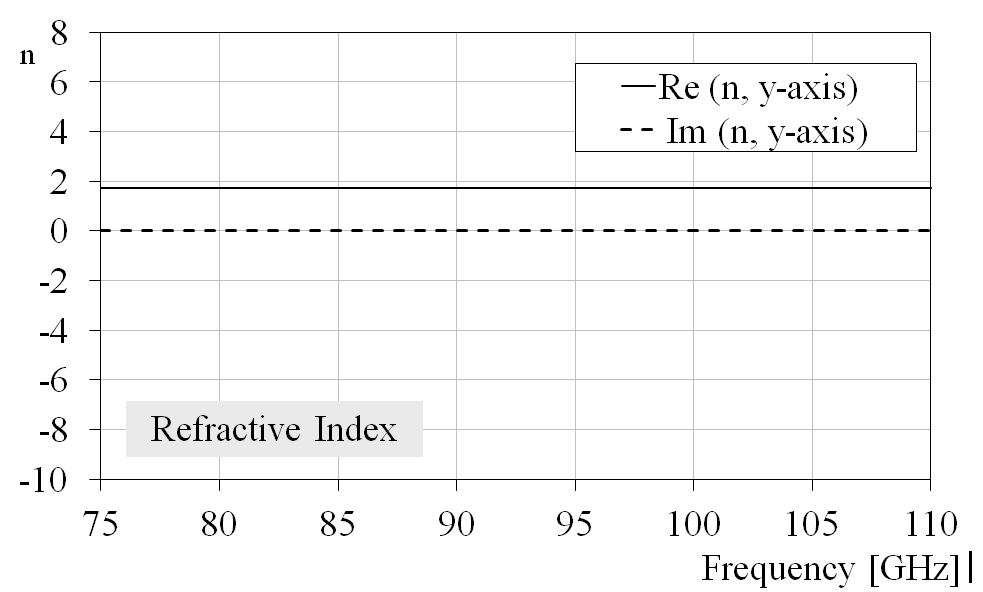
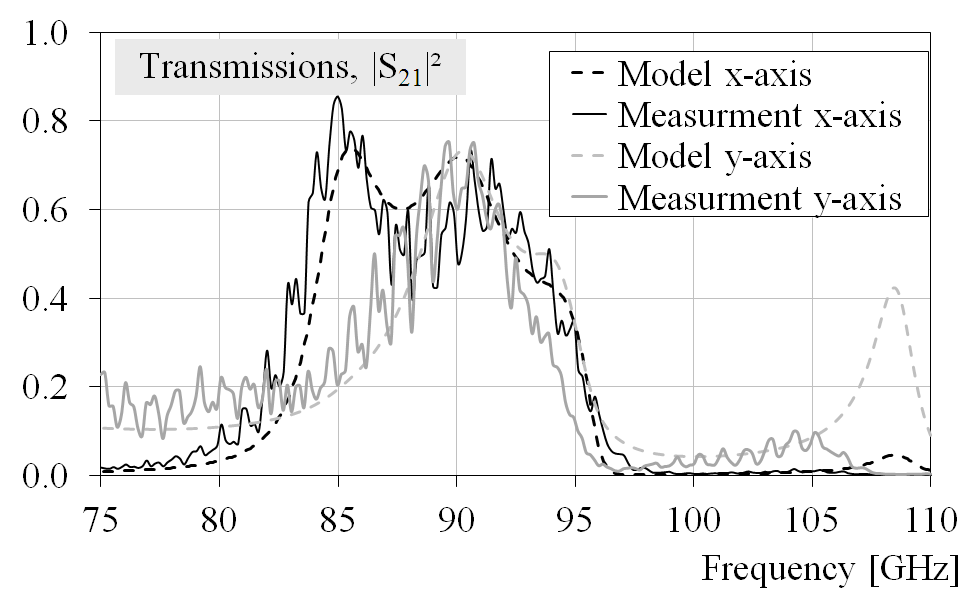
The transmission properties of the optimised unit cell are shown in Figure 3. Around the gradient of the phase difference is very steep. The spectral region where the phase difference is within is extremely narrow, providing an operational fractional bandwidth of only (). In this region the transmissions in the - and -axes have mean values of 0.81 and 0.84 respectively. The refractive indices along the - and -axes are shown in Figure 3. These were calculated starting from the HFSS reflection and transmission coefficients and adopting the extraction methods discussed in [8, 9]. The refractive index, being a property of a bulk material, can only truly be defined for a set of regularly cascaded metamaterials. As each of our plates is only a single cell thick we have taken the effective thickness to be equal to the physical thickness to provide an indicative value of the refractive index. The true refractive index values would be smaller in magnitude as the effective thickness extends beyond the substrate surface to where the reflected radiation has a planar wave front. We see that a NRI band exists for -polarized radiation above whilst in the -axis the refractive index is constant.
(a)
(b)
(a)
(b)
3 Modelling
Whilst modeling of a single cell’s transmission spectra in HFSS can be carried out comfortably, modelling of a cascaded set of cells is a very CPU and memory intensive process. In addition, the Pancharatnam recipes that we want to adopt are based on stacks of rotated plates. Given the geometry of the cell, when rotated it would not be possible to make use of the periodic boundary conditions provided by HFSS. In this case we turned to transmission line modeling which can produce accurate results provided the cells are far enough such that inter-cell interactions can be considered negligible. The S-parameters for a single cell are converted into the ABCD (Transmission) parameters [10] and the air gaps between the cells are represented using the propagation matrices for a transmission line. The Pancharatnam method was then implemented as had been done in previous papers [6] using three plates. The distance and angle between the successive plates was optimised to get the broadest possible bandwidth where the phase difference was flat and the transmission on both axes were as high and equal to each other as possible.
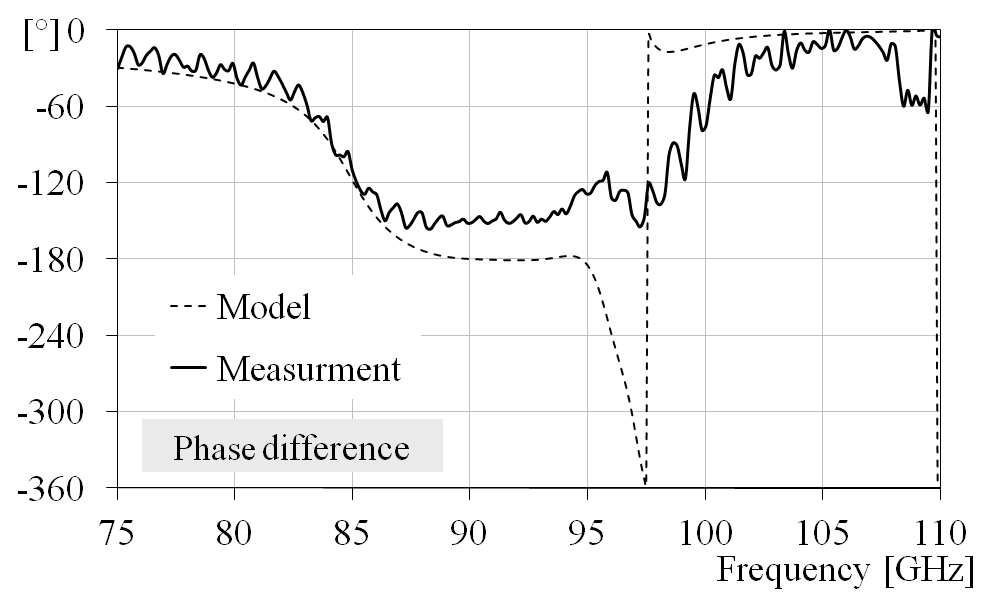
The resultant values came to be for the air gaps and angles of for the plates with respect to the final HWP equivalent fast axis. This increased the bandwidth from , for the single plate, to , between . This shows that despite the phase difference’s initially steep gradient for a single cell, marked improvements can be achieved using the Pancharatnam method: a bandwidth more than a factor 20 wider. The transmissions in this region vary between 0.36 and 0.72 in the -axis and 0.36 and 0.73 in the -axis, with the two axes showing similar transmission values to each other. The simulated transmission and phase differences of this HWP are shown as dashed lines together with experimental data in Figure 4.
4 Measurements
To create the dog bone triplets, the single dog bone grids were made using photolithographic techniques. The plate required three grids to be made and layered atop one another with the appropriate thickness of polypropylene sheets between them. Three of these plates were made and mounted onto aluminium rings that acted as support and provided the necessary air gaps.
Measurements were taken using a Rhode & Schwarz ZVA40 vector network analyser connected to two WR10 heads and corrugated horns to provide Gaussian shaped beams of W-band radiation. Eccosorb was used to cover the surfaces in the setup to reduce unwanted reflections. The transmission measurements along the two axes were taken individually and compared to the simulated data.
(a)
(b)
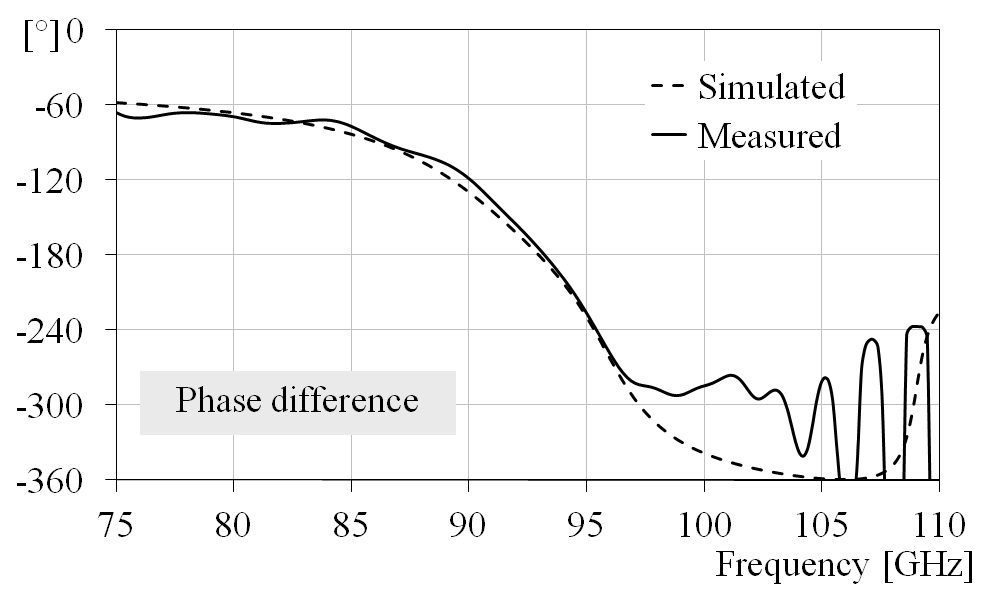
The experimentally obtained transmissions and phase differences are shown as solid lines in Figure 4. Compared to the simulated transmission data, the measured transmission data shows a small red shift in frequency but otherwise the two show comparable concurrence. The phase difference also shows good correlation below . This, unfortunately, does not continue such that it reaches . Instead, a flattening of the phase difference at is achieved between to providing a flat region of bandwidth in size. The difference between the simulation and experimental data is due to fabrication errors in the grids. Simulations have indeed showed that minor deviations in the air gap thicknesses and the plates’ rotations would not impact on the HWP’s ability to produce a phase difference that reached . On the other hand, the comparison of the model and the measured data of the individual plates showed that two of them suffered from deviations above in their phase difference. For example at where the expected phase difference is these two plates had phase differences of . The best performing plate achieved and its measured phase difference is shown in Figure 5. It is interesting to note that the average of these values equals , close to the measured value of the flat region of the final HWP. In all of the plates, above , the measured phase difference ceases to decrease and instead flattens out. This could explain the lack of the dip the measured phase difference makes above in the full HWP.
So whilst the experimental results do not exactly match the simulations for manufacturing reasons, it can be seen that a broadening of a flat region in the phase difference can be achieved using the Pancharatnam method, even with highly birefringent wave plates.
5 Conclusion
We have created a novel HWP that utilises a highly birefringent metamaterial plate with refractive indices of different signs in each axis and cascaded three of them using the Pancharatnam method to increase their bandwidth. The simulated data showed an increase in bandwidth from () for a single plate to () for the whole device: about a factor 20 wider. The experimentally measured data shows a flattening in the phase difference at between to . Whilst not a good match with the simulation this does show that in principle this method can achieve a flattening of the phase difference even with highly birefringent wave plates. An attempt to account for the differences between the simulation and experiment was made by studying the transmissions of the individual plates. It is found that the likely cause for the discrepancy in the final HWP’s performance is due to fabrication errors in the individual grids themselves. Future HWP prototypes will be manufactured using grids selected on their performance in order to achieve the predicted results. Even better performances could in principle be achieved by designing single NRI plates with broader bandwidths, i.e. with geometries showing gentler phase difference slopes.
ACKNOWLEDGMENT
The first author is funded by a studentship from the Science and Technology Facilities Council (STFC).
Bibliography
- [1] Smith, D. R., W. J. Padilla, D. C. Vier, S. C. Nemat-Nasser, and S. Schultz, “Composite medium with simultaneously negative permeability and permittivity,” Phys. Rev. Lett., Vol. 84, No. 18, 4184–4187, 2000.
- [2] Pisano, G., G. Savini, P. A. R. Ade, and V. Haynes, “Metal-mesh achromatic half-wave plate for use at submillimeter wavelengths,” Appl. Opt., Vol. 47, No. 33, 6251–6256, 2008.
- [3] Imhof, C. and R. Zengerle, “Strong birefringence in left-handed metallic metamaterials,” Opt. Comm., Vol. 280, No. 1, 213–216, 2007.
- [4] Weis, P., O. Paul, C. Imhof, R. Beigang, and M. Rahm, “Strongly birefringent metamaterials as negative index terahertz wave plates,” App. Phys. Lett., Vol. 95, No. 17, 171104, 2009.
- [5] Pancharatnam, S., “Achromatic combinations of birefringent plates, Part II: An achromatic quarter-wave plate,” Proc. Indian Acad. Sci., Sec. A, Vol. 41, No. 4, 137–144, 1955.
- [6] Pisano, G., G. Savini, P. A. R. Ade, V. Haynes, and W. K. Gear, “Achromatic half-wave plate for submillimeter instruments in cosmic microwave background astronomy: experimental characterization,” App. Opt., Vol. 45, No. 27, 6982–6989, 2006.
- [7] Ansoft HFSS version 13: http://www.ansoft.com
- [8] Smith, D. R., S. Schultz, P. Markoš, and C. M. Soukoulis, “Determination of effective permittivity and permeability of metamaterials from reflection and transmission coefficients,” Phys. Rev. B, Vol. 65, No. 19, 195104, 2002.
- [9] Chen, X., T. M. Grzegorczyk, B.-I. Wu, J. Pacheco, and J. A. Kong, “Robust method to retrieve the constitutive effective parameters of metamaterials,” Phys. Rev. E, Vol. 70, No. 1, 016608, 2004.
- [10] Pozar, D. M., Microwave Engineering, 2nd Edition, John Wiley & Sons, 1998.