Chemical abundances in bright giants of the globular cluster M62 (NGC 6266)††thanks: Based in part on data collected at Subaru Telescope, which is operated by the National Astronomical Observatory of Japan. This paper includes data gathered with the 6.5 meter Magellan Telescopes located at Las Campanas Observatory, Chile.
Abstract
With the exception of Terzan 5, all the Galactic globular clusters that possess significant metallicity spreads, such as Cen and M22, are preferentially the more luminous clusters with extended horizontal branches. Here we present radial velocities and chemical abundances for seven bright giants in the globular cluster M62, a previously little-studied cluster. With = 9.18, M62 is the ninth most luminous Galactic globular cluster and has an extended horizontal branch. Within our sample, we find (i) no evidence for a dispersion in metallicity, [Fe/H], beyond the measurement uncertainties, (ii) star-to-star abundance variations for C, O, Na and Al with the usual correlations between these elements as seen in other globular clusters, and (iii) a global enrichment for the elements Zr, Ba and La at the level [X/Fe] +0.4 dex. For elements heavier than La, the abundance ratios are consistent with the scaled-solar -process distribution. Below La, the abundances are anomalous when compared to the scaled-solar -process or -process distributions. For these elements, the abundance signature in M62 is in agreement with predictions of the -process from fast-rotating massive stars, although the high [Rb/Y] ratio we measure may be a challenge to this scenario.
keywords:
Stars: abundances – Galaxy: abundances – globular clusters: individual: NGC 62661 INTRODUCTION
A small, but growing, number of Galactic globular clusters exhibit a star-to-star variation in the relative abundances of the heavy elements. Centauri is the most well-known member of this group with its stars spanning a range in metallicity111Here and throughout the paper, iron is the canonical measure of metallicity and we adopt the standard spectroscopic notation [Fe/H] = from [Fe/H] 2.0 to [Fe/H] 0.5; for certain elements, the abundance ratios with respect to iron, [X/Fe], exhibit considerable variations with metallicity (e.g., Norris & Da Costa 1995; Smith et al. 2000; Johnson & Pilachowski 2010; D’Orazi et al. 2011). As the most massive Galactic globular cluster and in light of its complex chemical enrichment history, Cen is regarded to be the core of a disrupted dwarf galaxy (e.g., Freeman 1993; Bekki & Freeman 2003; Bekki & Norris 2006).
M54 is the second most massive Galactic globular cluster. It displays a key characteristic shared by Centauri but absent in the majority of clusters, namely, a metallicity dispersion (Carretta et al., 2010a), albeit of smaller amplitude than that found in Centauri. That M54 is the nuclear star cluster of the Sagittarius dwarf spheroidal galaxy lends further support to the hypothesis that massive globular clusters with metallicity variations may be the nuclei of disrupted dwarf galaxies (although Bellazzini et al. 2008 argue that the nucleus of Sgr likely formed independently of M54). When considering the ensemble of globular clusters with unusual chemical abundance ratios222In addition to Cen and M54, the other clusters include M15 (Sneden et al., 2000; Otsuki et al., 2006; Sobeck et al., 2011; Worley et al., 2013), NGC 362 (Carretta et al., 2013), NGC 1851 (Yong & Grundahl, 2008; Villanova et al., 2010; Carretta et al., 2011), NGC 2419 (Cohen et al., 2010, 2011; Cohen & Kirby, 2012; Mucciarelli et al., 2012), NGC 3201 (Simmerer et al., 2013), NGC 5824 (Saviane et al., 2012), NGC 6656 (Da Costa et al., 2009; Da Costa & Marino, 2011; Marino et al., 2009, 2011; Roederer et al., 2011; Alves-Brito et al., 2012), NGC 7089 (Lardo et al., 2012, 2013) and Terzan 5 (Ferraro et al., 2009; Origlia et al., 2011, 2013) (dispersions in metallicity and/or neutron-capture elements), it is clear that these objects are preferentially the more luminous, and therefore the more massive, clusters.
Lee et al. (2007) considered globular clusters with an extended horizontal branch (i.e., a horizontal branch with extremely blue stars) which likely signifies the presence of He abundance variations (D’Antona et al., 2002). They argued that not only are clusters with an extended horizontal branch preferentially more massive, but also when considered together the clusters have different kinematics from other groupings of the Galactic globular cluster population. The sample of clusters with extended horizontal branches include Cen, M54 and M22, all of which exhibit metallicity variations. Lee et al. (2007) showed that such clusters had kinematics consistent with accretion and thus likely have a different origin to the bulk of the cluster population.
The identification of additional globular clusters with peculiar chemical abundance patterns (e.g., star-to-star variations in metallicity) would advance our understanding of the range and relative frequency of the abundance spread phenomenon in the Galactic globular cluster system. Additionally, quantifying the number of accreted systems has important consequences for understanding the formation and evolution of our Galaxy (Freeman & Bland-Hawthorn, 2002). To this end, the most obvious objects to study are the most massive globular clusters with extended horizontal branches. M62 (NGC 6266) is the ninth most luminous cluster (Harris, 1996) and has an extended blue horizontal branch. In the F439W F555W versus F555W colour magnitude diagram presented by Piotto et al. (2002), the horizontal branch extends down in luminosity to the main sequence turn-off. The extended horizontal branch is also readily identified in dereddened versus and versus diagrams (Alonso-García et al., 2011, 2012). M62 ranks fifth in the number of millisecond pulsars (Cocozza et al., 2008), and there may be a connection between multiple stellar populations and the numbers of millisecond pulsars (Lanzoni et al., 2010). Contreras et al. (2010) find that M62 could contain the most RR-Lyrae of any Galactic globular cluster and is a typical Oosterhoff type I system. This cluster lies in the vicinity of the bulge, although proper-motion measurements indicate that it probably belongs to the thick disk (Dinescu et al., 2003). M62 is highly reddened, ) = 0.47 (Harris, 1996), and it is severely affected by differential reddening, 0.25 (Alonso-García et al., 2012).
The goal of the present paper is to conduct a detailed chemical abundance analysis of M62 based on high-resolution, high signal-to-noise ratio spectra. To our knowledge this is the first such analysis of this cluster and this work therefore represents an essential step towards completing the census and characterisation of the Galaxy’s most massive globular clusters.
2 OBSERVATIONS AND ANALYSIS
2.1 Target selection and spectroscopic observations
Six targets were selected from Rutledge et al. (1997) (see Table 1). All were high probability members based on the published radial velocities and were observed with the High Dispersion Spectrograph (HDS, Noguchi et al. 2002) on the Subaru Telescope on 2013 July 17. The exposure times ranged from 16 to 40 minutes per program star. We used the StdYb setting and the 08 slit which resulted in a wavelength coverage from 4100Å to 6800Å at a spectral resolution of . There were approximately four pixels per resolution element. Spectra of a telluric standard (HD 163955) and a radial velocity standard (HD 182572) were also taken during this observing run.
Two additional targets were selected from Strömgren photometry obtained by J.A-G and observed using the MIKE spectrograph (Bernstein et al., 2003) at the Magellan-II Telescope on 2012 June 26. The exposure times were 1 hour for each star. The 07 slit was employed providing a spectral resolution of = 35,000 (blue CCD) and = 27,000 (red CCD) with a wavelength coverage from 3800Å to 9000Å. There were approximately four pixels per resolution element. A telluric standard (HD 170642) was also observed.
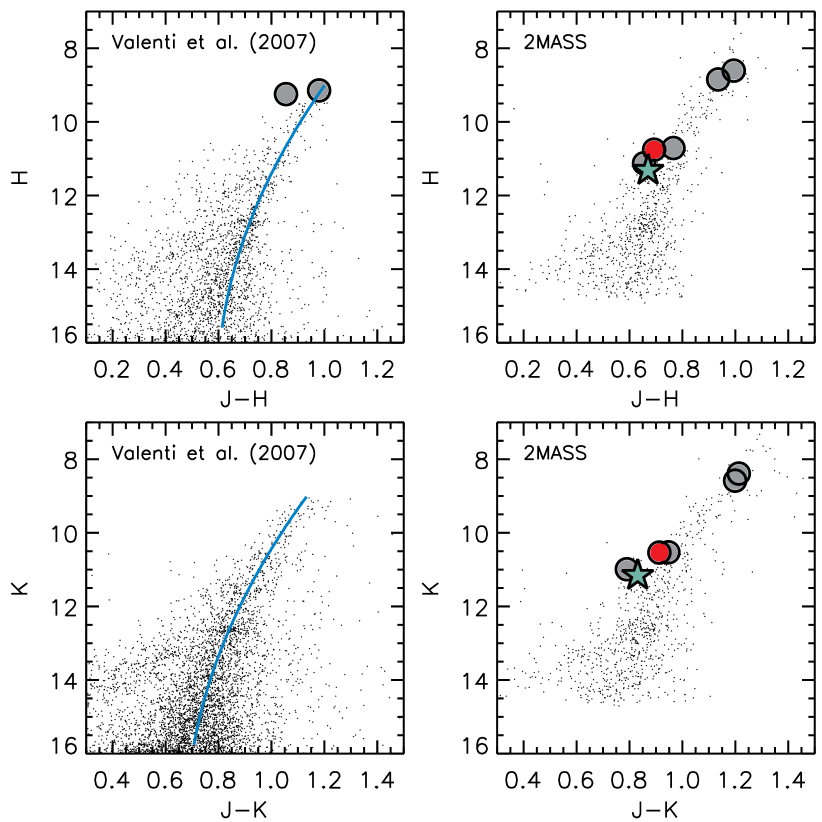
In Figure 1, we show the locations of our targets in colour-magnitude diagrams (CMD). The photometry is from Valenti et al. (2007) and 2MASS (Skrutskie et al., 2006).
| Name333AXXX names are from Alcaino (1978) while c53 and d10 are from Strömgren photometry taken by J.A-G. | RA 2000 | Dec. 2000 | 444Photometry for the AXXX stars is from 2MASS (Skrutskie et al., 2006). Photometry for c53 and d10 are from Valenti et al. (2007). | RV | RV555The uncertainties are the standard error of the mean. | [m/H] | [Fe/H] | |||||
| (km s-1) | (km s-1) | (K) | (cm s-2) | (km s-1) | dex | dex | ||||||
| (1) | (2) | (3) | (4) | (5) | (6) | (7) | (8) | (9) | (10) | (11) | (12) | (13) |
| Subaru Telescope Observations 2013 07 17 | ||||||||||||
| A5 | 17 01 16.21 | 30 03 31.81 | 9.782 | 8.847 | 8.583 | 75.0 | 0.2 | 3950 | 0.50 | 1.79 | 1.10 | 1.12 |
| A7 | 17 01 17.50 | 30 03 20.60 | 9.602 | 8.608 | 8.389 | 89.3 | 0.5 | 3925 | 0.20 | 1.89 | 1.10 | 1.15 |
| A14 | 17 01 17.29 | 30 03 58.69 | 11.476 | 10.710 | 10.529 | 54.2 | 0.2 | 4400 | 1.40 | 1.53 | 1.10 | 1.10 |
| A27 | 17 01 25.19 | 30 04 09.85 | 11.779 | 11.124 | 10.989 | 69.9 | 0.4 | 4625 | 1.50 | 1.76 | 1.20 | 1.24 |
| A124 | 17 01 00.28 | 30 07 38.28 | 11.449 | 10.756 | 10.536 | 68.2 | 0.3 | 4450 | 1.00 | 1.64 | 1.20 | 1.19 |
| A195 | 17 01 12.63 | 30 03 40.78 | 11.988 | 11.318 | 11.157 | 0.1 | 0.4 | … | … | … | … | … |
| Magellan Telescope Observations 2012 06 26 | ||||||||||||
| c53 | 17 01 15.20 | 30 08 36.50 | 10.101 | 9.246 | … | 73.6 | 0.2 | 4450 | 1.40 | 1.78 | 1.10 | 1.11 |
| d10 | 17 01 16.80 | 30 08 18.00 | 10.125 | 9.145 | … | 59.0 | 0.2 | 4175 | 0.90 | 1.90 | 1.10 | 1.15 |
2.2 Data reduction and analysis
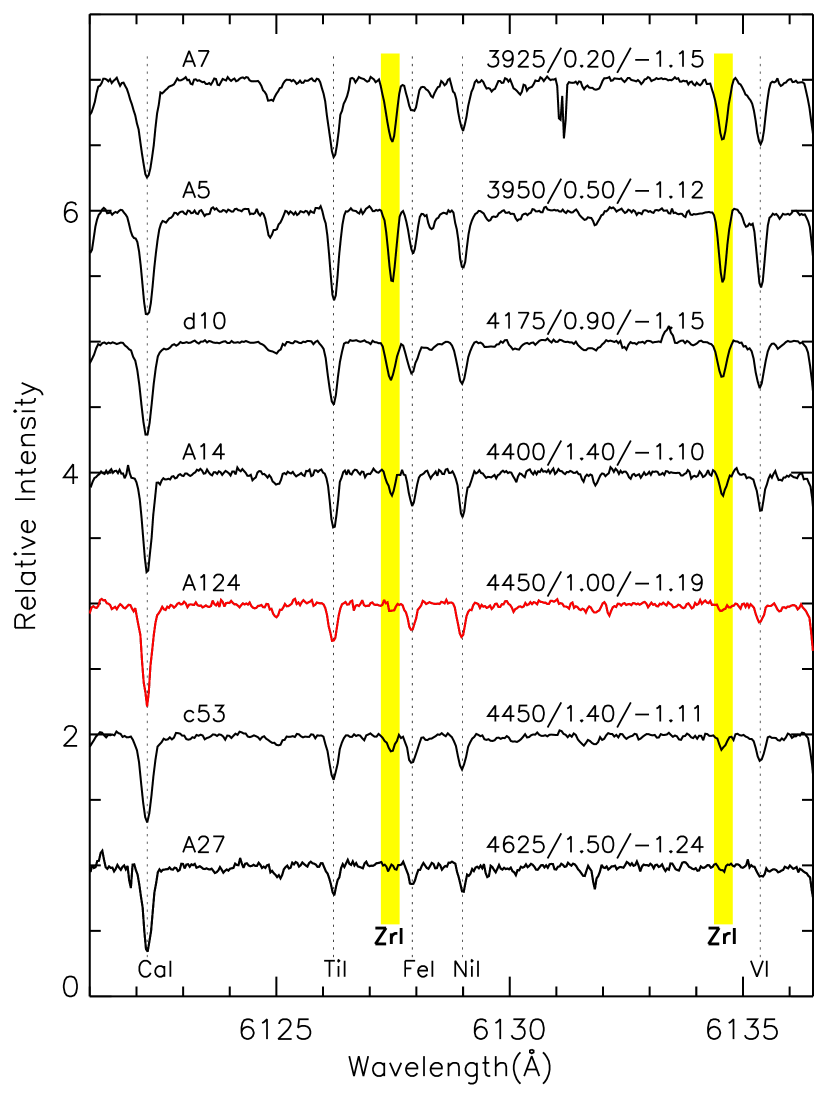
The Subaru spectra were reduced using IRAF666IRAF is distributed by the National Optical Astronomy Observatories, which are operated by the Association of Universities for Research in Astronomy, Inc., under cooperative agreement with the National Science Foundation.. The Magellan spectra were reduced using a combination of IRAF and the mtools package777www.lco.cl/telescopes-information/magellan/instruments/mike/iraf-tools/iraf-mtools-package. In both cases, the approach was similar to that described in Yong et al. (2006). In Figure 2, we plot a region of the spectra for the program stars. The telluric standards were used to correct regions affected by telluric absorption. Star A195 had a signal-to-noise ratio S/N = 40 per pixel near 6000Å. Excluding this star, the S/N ranged from S/N = 65 per pixel (stars A14 and A27) to S/N = 110 per pixel (star d10).
For the program stars observed with Subaru, heliocentric radial velocities were measured by cross-correlating each star against the radial velocity standard, HD 182572, for which we adopted a value888obswww.unige.ch/udry/std/stdnew.dat of 100.35 km s-1. For the program stars observed with Magellan, the radial velocities were determined by measuring the positions of a large number (several hundred) of atomic absorption features. The radial velocities are presented in Table 1 and we note that star A195 is not a radial velocity member.
Equivalent widths (EW) were measured using routines in IRAF and DAOSPEC (Stetson & Pancino, 2008). We note that every line measured using DAOSPEC was also measured, and visually inspected, using IRAF. For all stars, there was good agreement between the two sets of measurements; for a given star, the average difference in EWs between IRAF and DAOSPEC was 0.1 mÅ with a dispersion of 3 mÅ. The line list and EW measurements (average of IRAF and DAOSPEC) are presented in Table 2.
| Wavelength | Species999The digits to the left of the decimal point are the atomic number. The digit to the right of the decimal point is the ionization state (‘0’ = neutral, ‘1’ = singly ionized). | L.E.P | A5 | A7 | A14 | A27 | A124 | c53 | d10 | Source101010A = values taken from Yong et al. (2005) where the references include Den Hartog et al. (2003), Ivans et al. (2001), Kurucz & Bell (1995), Prochaska et al. (2000), Ramírez & Cohen (2002); B = Gratton et al. (2003); C = Oxford group including Blackwell et al. (1979a, b, 1980, 1986, 1995); D = Biemont et al. (1991); E1 = Fuhr & Wiese (2009), E2 = Roederer & Lawler (2012), E3 = Biémont et al. (2011), E4 = Biemont et al. (1981), E5 = Lawler et al. (2001a), E6 = Lawler et al. (2009), E7 = Li et al. (2007), E8 = Den Hartog et al. (2003), E9 = Lawler et al. (2006), E10 = Lawler et al. (2001b), E11 = Roederer et al. (2012); F = Lambert & Luck (1976) | |
| Å | eV | mÅ | mÅ | mÅ | mÅ | mÅ | mÅ | mÅ | |||
| (1) | (2) | (3) | (4) | (5) | (6) | (7) | (8) | (9) | (10) | (11) | (12) |
| 6300.31 | 8.0 | 0.00 | 9.75 | 33.0 | 48.9 | 15.0 | 67.0 | 48.8 | 15.0 | 60.2 | B |
| 6363.78 | 8.0 | 0.02 | 10.25 | … | 17.0 | … | 21.2 | 22.1 | … | 34.4 | A |
| 7771.95 | 8.0 | 9.15 | 0.35 | … | … | … | … | … | … | 12.8 | B |
| 7774.18 | 8.0 | 9.15 | 0.21 | … | … | … | … | … | … | 10.1 | B |
| 5682.65 | 11.0 | 2.10 | 0.67 | … | … | 114.8 | 51.2 | … | 110.3 | 98.0 | B |
This table is published in its entirety in the electronic edition of the paper. A portion is shown here for guidance regarding its form and content.
The stellar parameters were determined using a traditional spectroscopic approach. One dimensional local thermodynamic equilibrium (LTE) model atmospheres were taken from the Castelli & Kurucz (2003) alpha enhanced, [/Fe] = +0.4, grid. To produce particular models we used the interpolation software tested in Allende Prieto et al. (2004). Chemical abundances were generated using the LTE stellar line analysis program MOOG (Sneden, 1973; Sobeck et al., 2011). The effective temperature, , was obtained when there was no trend between the abundance from Fe i lines and the lower excitation potential. The surface gravity, , was established by forcing the iron abundance derived from Fe i and Fe ii lines to be equal. The microturbulent velocity, , was adjusted until the abundance from Fe i lines exhibited no trend with reduced equivalent width, . Finally, we required the derived metallicity to be within 0.1 dex of the value adopted in the model atmosphere. The final stellar parameters (see Table 1) were established only when all conditions above were simultaneously satisfied. The uncertainties in , and are estimated to be 50 K, 0.20 dex and 0.20 km s-1, respectively. We do not present results for star A195 since it is not a radial velocity member and our preliminary analysis indicated that it is a super-solar metallicity clump giant ( = 4750, = 3.1, [Fe/H] = +0.17).
Chemical abundances were determined using the final model atmosphere, measured EW and MOOG. For Cu and the neutron-capture elements, abundances were determined via spectrum synthesis. Lines affected by hyperfine splitting (HFS) and/or isotope shifts (e.g., Sc ii, V i, Mn i, Co i, Rb i, Ba ii, La ii, Pr ii, Eu ii and Pb i) were treated appropriately using the HFS data from Kurucz & Bell (1995) or other sources as noted in Table 2. For Rb and Pb, the wavelength coverage necessary to measure these elements was only obtained in the two stars observed with Magellan (see Figures 3 and 4). C abundances were determined from spectrum synthesis of the 4300Å CH molecular lines using the CH line list compiled by B. Plez et al. (2009, private communication). In our analysis, the dissociation energy for CH was 3.465 eV. The Asplund et al. (2009) solar abundances were adopted and the chemical abundances are presented in Table 3.
| Name | A(X) | Nlines | s.e.logϵ | [X/Fe] | Total Error |
|---|---|---|---|---|---|
| C from CH | |||||
| A5 | 6.46 | synth | … | 0.85 | 0.21 |
| A7 | 6.31 | synth | … | 0.97 | 0.23 |
| A14 | 6.41 | synth | … | 0.92 | 0.21 |
| A27 | 6.76 | synth | … | 0.43 | 0.22 |
| A124 | 6.76 | synth | … | 0.48 | 0.23 |
| c53 | 6.71 | synth | … | 0.61 | 0.22 |
| d10 | 7.01 | synth | … | 0.27 | 0.22 |
| O i | |||||
| A5 | 7.79 | 2 | 0.07 | 0.30 | 0.18 |
| A7 | 7.79 | 2 | 0.04 | 0.39 | 0.20 |
| A14 | 7.68 | 1 | … | 0.16 | … |
| A27 | 8.40 | 2 | 0.09 | 1.05 | 0.18 |
| A124 | 8.08 | 2 | 0.03 | 0.68 | 0.18 |
| c53 | 7.66 | 1 | … | 0.17 | … |
| d10 | 8.31 | 4 | 0.04 | 0.89 | 0.14 |
| Na i | |||||
| A5 | 5.67 | 2 | 0.04 | 0.64 | 0.18 |
| A7 | 5.63 | 2 | 0.00 | 0.68 | 0.17 |
| A14 | 5.79 | 3 | 0.04 | 0.72 | 0.13 |
| A27 | 4.87 | 3 | 0.05 | 0.04 | 0.13 |
| A124 | 4.86 | 2 | 0.01 | 0.09 | 0.15 |
| c53 | 5.59 | 3 | 0.06 | 0.55 | 0.12 |
| d10 | 5.18 | 4 | 0.04 | 0.21 | 0.12 |
This table is published in its entirety in the electronic edition of the paper. A portion is shown here for guidance regarding its form and content.
The uncertainties in the chemical abundances were obtained in the following manner. We repeated the analysis and varied the stellar parameters, one at a time, by their uncertainties. We also considered the uncertainty of the metallicity used to generate the model atmosphere, [M/H], and adjusted this value by +0.2 dex. The systematic error was determined by adding these four error terms in quadrature, and we assume these values are symmetric for positive and negative changes. Following Norris et al. (2010), the random error (s.e.logϵ) was obtained by taking max(s.e.logϵ, 0.20/). The second term is what would be expected for a set of with a dispersion of 0.20 dex (a conservative value based on the abundance dispersion exhibited by Fe i lines). By adding the systematic and random errors, in quadrature, we obtain the total error which is presented in Table 3.
3 RESULTS
3.1 Cluster membership and radial velocities
With the exception of star A195, all program stars have radial velocities consistent with cluster membership. According to the Harris (1996) catalogue, M62 has a heliocentric radial velocity of 70.1 1.4 km s-1 and a central velocity dispersion of 14.3 0.4 km s-1. For our seven program stars, we find an average heliocentric radial velocity of 69.9 4.3 km s-1 ( = 11.4 km s-1).
As we shall discuss in the following subsection, star A124 has low abundance ratios for the neutron-capture elements compared to the other program stars and so the possibility exists that this object may not be a cluster member. With a radial velocity of 68.2 0.3 km s-1, excluding this star would not substantially change the mean radial velocity and velocity dispersion we measure for this cluster.
To investigate the likelihood of observing field stars in the vicinity of M62 with stellar parameters (, and [Fe/H]) and radial velocities comparable to the program stars, we make use of the Besançon model (Robin et al., 2003). First, we consider all stars within a one square degree field centered on M62. Secondly, we restricted the sample to lie near the RGB in the versus CMD; specifically, the left edge was defined as the line from (,) = (0.55,12.0) to (,) = (1.1,8.0) and the right edge as the line from (,) = (1.05,12.0) to (,) = (1.4,8.0). We find 13281 such stars from the Besançon model. Thirdly, of these 13281 stars we counted the number that satisfied the following constraints: () 95 RV 45 km s-1 and () 1.35 [Fe/H] 1.00 dex. And finally, we counted the numbers of stars that lay in a particular region in the - plane, specifically, the area is bounded at the left edge by the line from (,) = (4925,2.0) to (,) = (4225,0.0), at the right edge by the line from (,) = (4200,2.0) to (,) = (3625,0.0) both with 0.0 2.0. We found 490 stars in the Besançon model that satisfied all criteria and therefore estimate that given a sample of stars occupying similar locations in colour-magnitude diagrams as the program stars, the probability of observing a field star with stellar parameters and a radial velocity consistent with the program stars is roughly 4%. In our sample of seven stars, having one field star with stellar parameters and a radial velocity consistent with the cluster sample is not unreasonable given the small number statistics. Accurate proper-motion and parallax measurements from GAIA would establish cluster membership, or otherwise, for this object.
3.2 Chemical abundances
For the program stars, we measure a mean metallicity of [Fe/H] = 1.15 0.02 ( = 0.05). Our metallicity is consistent with previous measurements based primarily on low-resolution spectroscopic measurements: [Fe/H] = 1.28 0.15 (Zinn & West, 1984); [Fe/H] = 1.02 0.04 (Carretta & Gratton, 1997); [Fe/H] = 1.19 (Kraft & Ivans, 2003) when using MARCS model atmospheres (Gustafsson et al., 1975); [Fe/H] = 1.18 0.07 (Carretta et al., 2009). The dispersion in [Fe/H] based on our program stars can be entirely attributed to the measurement uncertainty. The mean metallicity and dispersion are essentially unchanged if we exclude the “neutron-capture poor” star A124 with [Fe/H] = 1.19.
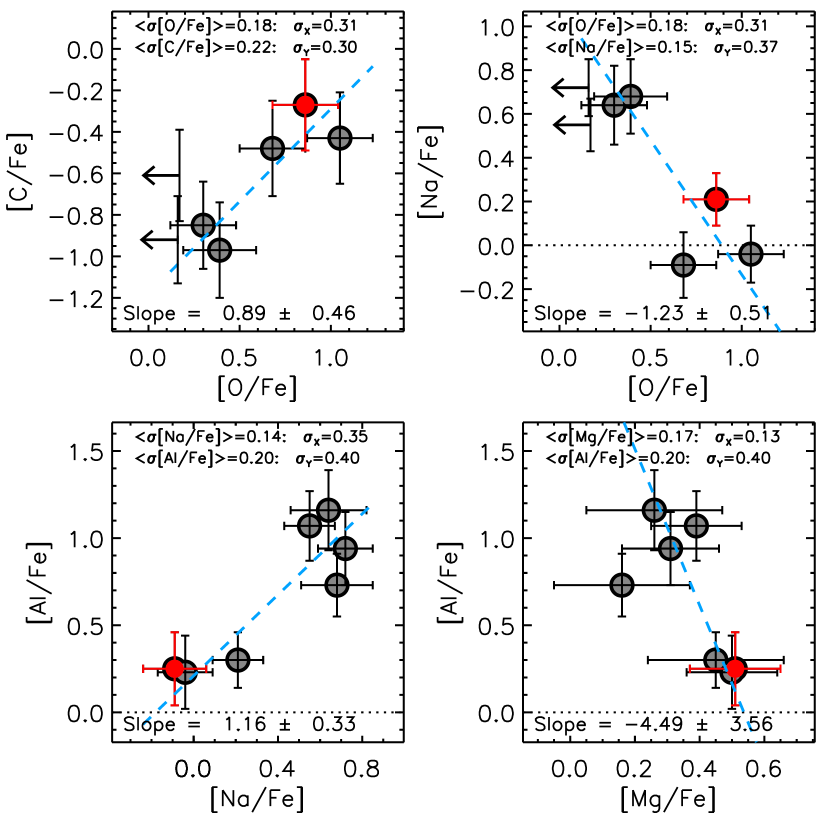
For the light elements, we find evidence for a star-to-star variation for C, O, Na and Al and perhaps Mg (see Figure 5). For O, Na and Al, the observed abundance dispersion exceeds the average measurement error by a factor of 2 indicating a genuine abundance spread for these elements. These abundance dispersions are confirmed by the statistical significance of the correlations between the following pairs of elements, 3- for [O/Fe] vs. [Na/Fe] and [Na/Fe] vs. [Al/Fe]. There is a suggestion that Mg and Al are anticorrelated, a characteristic found in other, but not all, globular clusters. There is no evidence for an abundance variation for Si, nor for correlations between Si and all other elements as seen in NGC 6752 (Yong et al., 2013).
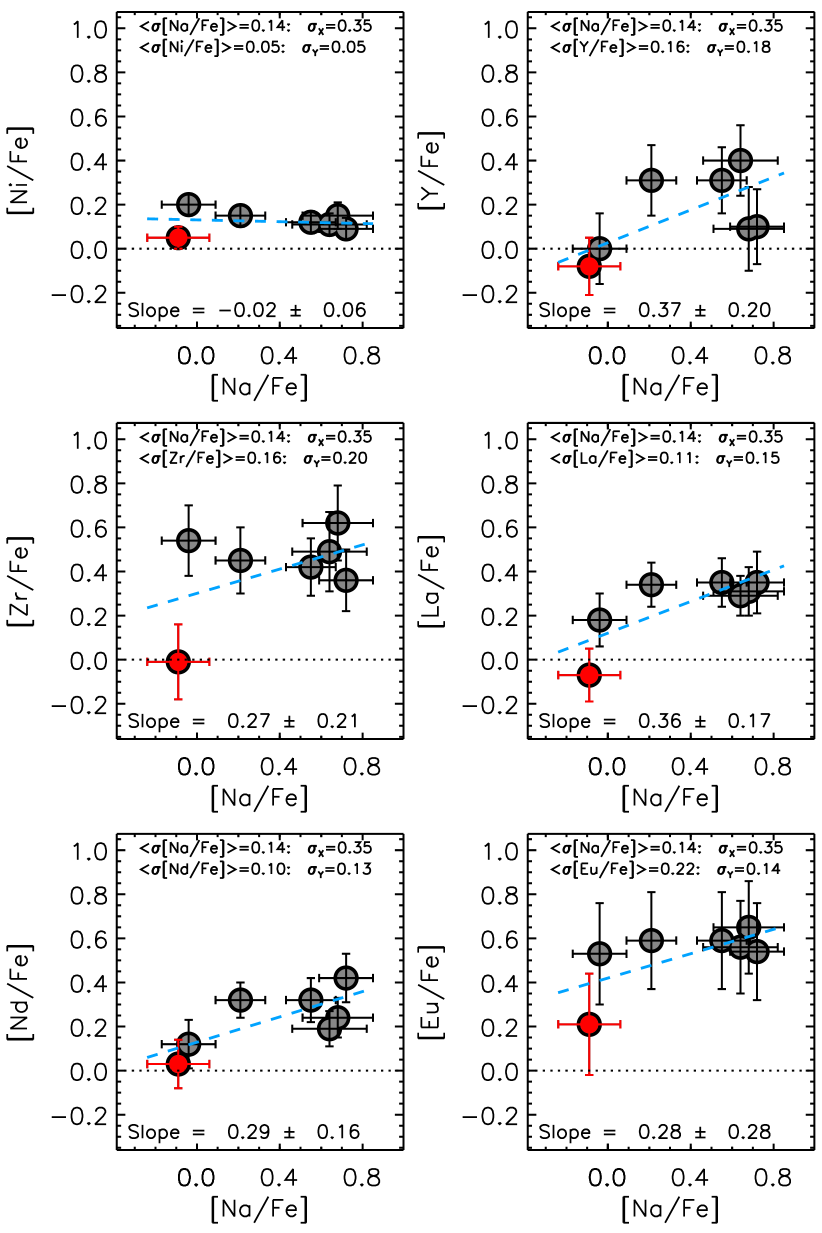
In Figure 6 we plot Ni and a selection of neutron-capture elements versus Na. Star A124, marked in red this and other figures, exhibits systematically lower abundance ratios for the neutron-capture elements compared to the remaining program stars. For a given element, we can compare the [X/Fe] ratio for star A124 to the average [X/Fe] ratio for the other stars. When doing this for the neutron-capture elements from Sr to Eu for A124, we find an average difference of 0.29 0.02 ( = 0.07). This difference is approximately twice the average error and suggests that this star is chemically different from the other six program stars, at least for the neutron-capture elements. Thus, our quantitative analysis confirms the visual impression from Figure 2 in which star A124 has weaker Zr lines relative to other program stars of comparable stellar parameters. Aside from star A124, we find no compelling evidence for an abundance dispersion for the neutron-capture elements. In all cases, the observed abundance dispersion is consistent with the measurement uncertainty. We find no evidence for a statistically significant correlation between any of the heavy elements and Na; such a correlation has been identified in the globular cluster NGC 6752 (Yong et al., 2013).
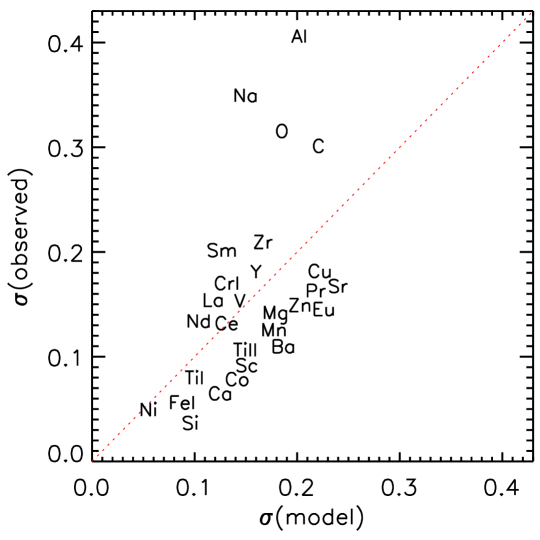
In Figure 7, we compare the measured abundance dispersion (including star A124) with the average total error. As already noted, the light elements O, Na and Al exhibit significantly larger dispersions than expected given the measurement uncertainty. For all other elements, with the possible exception of C, the observed abundance dispersions can be attributed to the measurement uncertainty. Note that the abundances for Fe ii were forced to match those of Fe i, and this species is not included in Figure 7. Had we excluded star A124 when generating this figure, the (observed) values would have decreased such that a larger proportion of the data would lie below the 1:1 relation. As such, our measurement uncertainties might be overestimated.
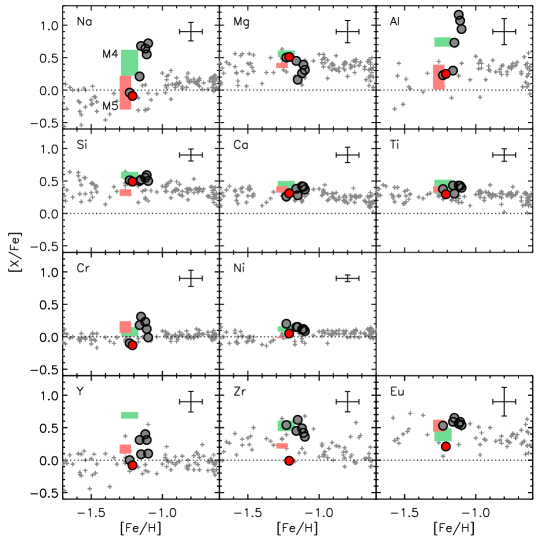
In Figure 8, we plot [X/Fe] vs. [Fe/H] for the program stars and field stars from Fulbright (2000). For Na and Al, one can clearly see that the abundance dispersions for [Na/Fe] and [Al/Fe] in M62 far exceed that of the field stars of comparable metallicity and that the lower envelope of the cluster values are in good agreement with field stars. Such results have been well established for other clusters (e.g., see reviews by Kraft 1994; Gratton et al. 2004; Gratton et al. 2012). We note that star A124 has Na and Al abundances in agreement with field stars. Further, the neutron-capture element abundances for this star, while lower than the cluster average, appear typical for field halo stars at the same metallicity, which is consistent with it being a field interloper.
For Si, Ca, Ti, Cr and Ni, the abundance ratios for M62 are in good agreement with field stars of the same metallicity. In solar system material, elements mainly produced via the -process include Y and Zr, and we refer to these as -process elements. Similarly, elements predominantly produced via the -process in solar system material are referred to as -process elements and include Eu. For the -process elements Y and Zr, the M62 values lie slightly above field halo stars of comparable metallicity. For the -process element Eu, the M62 values lie near the upper envelope defined by the field stars. (We caution that zero-point offsets may reduce, or amplify, the abundance differences between M62 and the field stars.)
In Figure 8, we also include the comparable metallicity globular clusters M4 ([Fe/H] = 1.08; Ivans et al. 1999) and M5 ([Fe/H] = 1.21; Ivans et al. 2001) using the data from Yong et al. (2008a, b). For Na and Al, while the abundance dispersions found in M4 and M5 are considerably smaller than in M62, we note that our sample sizes are small. Examination of the larger samples in Ivans et al. (1999, 2001) and Marino et al. (2008) also indicate that the abundance dispersions for Na and Al in M4 and M5 are probably smaller than those of M62. For the elements Si to Ni, the abundance ratios [X/Fe] in M4 and M5 match those of M62 and field stars in their metallicity range. For the -process elements, M4 is known to have larger [X/Fe] ratios than M5.
We conclude this section by noting some physical parameters for M4, M5 and M62 which may provide insight into any chemical abundance differences between these clusters. De Angeli et al. (2005) measured relative ages for these three clusters and found M5 to be 10-15% younger111111De Angeli et al. (2005) regard their typical uncertainties to be 5% to 8%. than M4 and M62 with the latter two being coeval. Marín-Franch et al. (2009) also found M5 to be slightly younger than M4. On the other hand, VandenBerg et al. (2013) measured ages for M4 and M5 of 11.50 Gyr, but did not study M62. The absolute luminosities for M4, M5 and M62 are 7.19, 8.81 and 9.18, respectively, and the central velocity dispersions are 4.0, 5.5 and 14.3 km s-1, respectively (Harris, 1996). M4 and M62 have orbits that are restricted to the inner disk and bulge, apocentric radii of = 5.9 kpc (Dinescu et al., 1999) and = 3.1 kpc (Allen et al., 2006), respectively while M5 has an orbit which may be consistent with an accretion event, = 35.4 kpc.
4 DISCUSSION
The focus of this discussion is to examine the nature of M62 in light of its chemical abundances. In Table 4, we present the average cluster abundance ratios with and without star A124, which has lower neutron-capture element abundances.
| Species | Z | [X/Fe] | [X/Fe]121212Standard deviation | [X/Fe] | [X/Fe]a |
|---|---|---|---|---|---|
| All stars | Excluding A124 | ||||
| O i | 8 | 0.52 | 0.35 | 0.49 | 0.38 |
| Na i | 11 | 0.38 | 0.35 | 0.46 | 0.31 |
| Mg i | 12 | 0.37 | 0.13 | 0.34 | 0.13 |
| Al i | 13 | 0.67 | 0.40 | 0.74 | 0.39 |
| Si i | 14 | 0.52 | 0.04 | 0.53 | 0.04 |
| Ca i | 20 | 0.35 | 0.06 | 0.35 | 0.07 |
| Sc ii | 21 | 0.20 | 0.09 | 0.23 | 0.06 |
| Ti i | 22 | 0.34 | 0.08 | 0.36 | 0.06 |
| Ti ii | 22 | 0.42 | 0.09 | 0.43 | 0.10 |
| V i | 23 | 0.22 | 0.15 | 0.27 | 0.11 |
| Cr i | 24 | 0.09 | 0.17 | 0.12 | 0.15 |
| Mn i | 25 | 0.30 | 0.12 | 0.30 | 0.13 |
| Fe i131313[Fe i/H] or [Fe ii/H] | 26 | 1.15 | 0.05 | 1.15 | 0.05 |
| Fe iib | 26 | 1.16 | 0.05 | 1.15 | 0.05 |
| Co i | 27 | 0.08 | 0.08 | 0.09 | 0.08 |
| Ni i | 28 | 0.12 | 0.05 | 0.14 | 0.04 |
| Cu i | 29 | 0.22 | 0.18 | 0.19 | 0.17 |
| Zn i | 30 | 0.11 | 0.15 | 0.10 | 0.16 |
| Rb i141414Measurements only for stars c53 and d10. | 37 | 0.11 | 0.03 | 0.11 | 0.03 |
| Sr i | 38 | 0.39 | 0.17 | 0.33 | 0.08 |
| Y ii | 39 | 0.16 | 0.18 | 0.20 | 0.16 |
| Zr i | 40 | 0.41 | 0.20 | 0.48 | 0.09 |
| Ba ii | 56 | 0.32 | 0.11 | 0.36 | 0.03 |
| La ii | 57 | 0.25 | 0.15 | 0.30 | 0.07 |
| Ce ii | 58 | 0.01 | 0.13 | 0.04 | 0.07 |
| Pr ii | 59 | 0.18 | 0.15 | 0.23 | 0.09 |
| Nd ii | 60 | 0.23 | 0.13 | 0.27 | 0.11 |
| Sm ii | 62 | 0.32 | 0.20 | 0.37 | 0.14 |
| Eu ii | 63 | 0.52 | 0.14 | 0.58 | 0.04 |
| Pb ic | 82 | 0.20 | … | 0.20 | … |
4.1 The light elements
It is now well established that every globular cluster exhibits star-to-star abundance variations for C, N, O, F, Na, Mg and Al (e.g., see reviews by Kraft 1994; Gratton et al. 2012). These abundance variations are believed to have been produced via hydrogen-burning at high temperature in asymptotic giant branch (AGB) stars, fast-rotating massive stars and/or massive binaries (e.g., Fenner et al. 2004; Ventura & D’Antona 2005; Decressin et al. 2007; de Mink et al. 2009; Marcolini et al. 2009).
Carretta (2006) and Carretta et al. (2010b) found that the abundance dispersions for the light elements correlate with various physical parameters. In particular, they noted that the interquartile range (IQR) for [O/Fe], [Na/Fe], [O/Na] and [Mg/Al] exhibits a correlation with the absolute luminosity, i.e., total mass. Within our modest sample, assuming for the purposes of this exercise that the [O/Fe] limits are detections, we find IQR[O/Na] = 1.11 and IQR[Mg/Al] = 0.89. With = 9.18 (Harris, 1996), the IQR values for M62 are consistent with those of other luminous clusters.
4.2 The neutron-capture elements
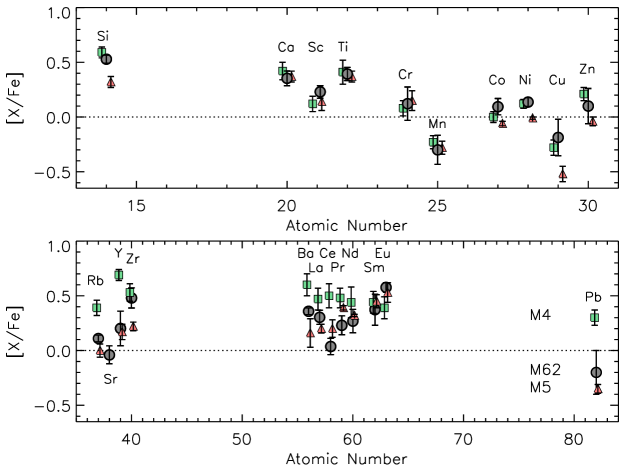
In Figure 9 we plot [X/Fe] versus atomic number for M62, M4 and M5. Regarding the -process elements, Zr, Ba and La have ratios of [X/Fe] +0.4. Such values differ from the majority of field halo stars of similar metallicity and from the comparable metallicity globular cluster M5. On the other hand, these abundance ratios in M62 are comparable (but not identical) to M4, a cluster believed to have formed from gas enriched in -process material. It is intriguing that both M4 and M62 are inner disk globular clusters of similar metallicity. Enhancements in the -process elements are also seen in the globular clusters Cen and M22 (e.g., Da Costa & Marino, 2011, and references therein). For elements other than Zr, Ba and La, the abundance pattern in M62 more closely resembles that of M5 rather than M4.
At the metallicity of these clusters, published neutron-capture element abundances in inner disk and bulge stars are limited. The Fulbright (2000) comparison field stars in Figure 8 are solar neighbourhood objects. Since the pioneering work by McWilliam & Rich (1994) on chemical abundances in the bulge, the handful of papers presenting neutron-capture element abundances at or below [Fe/H] = 1.0 in the inner disk or bulge include Johnson et al. (2012) and Bensby et al. (2013). Although their sample sizes are modest, some stars are enriched with material produced by -process nucleosynthesis. Among the bulge and inner disk globular clusters with [Fe/H] 1.0, NGC 6522 exhibits enhancements in the -process elements (Barbuy et al., 2009; Chiappini et al., 2011) while HP-1 (Barbuy et al., 2006) and NGC 6558 (Barbuy et al., 2007) do not.
The abundances of Rb and Pb offer important diagnostics regarding the nature of the -process. Due to a branching point at 85Kr along the -process path, the Rb/Zr ratio is sensitive to the neutron density at the site of the -process. At high neutron density, the [Rb/Zr] ratio is expected to be a factor of 10 larger than at low neutron density (Beer & Macklin, 1989; Kappeler et al., 1989), although the yields depend on details in the models and nuclear reaction rates (Pignatari et al., 2008, 2010; van Raai et al., 2012). Indeed, large Rb abundances have been observed in massive AGB stars (García-Hernández et al., 2006, 2009). Pb and Bi are the last stable nuclei along the -process path. If the total neutron exposure, or neutron supply per seed nuclei, is sufficiently high, large overabundances of these elements are predicted (e.g., Gallino et al., 1998; Busso et al., 1999, 2001; Goriely & Mowlavi, 2000), and have been observed (e.g., Van Eck et al., 2001; Ivans et al., 2005).
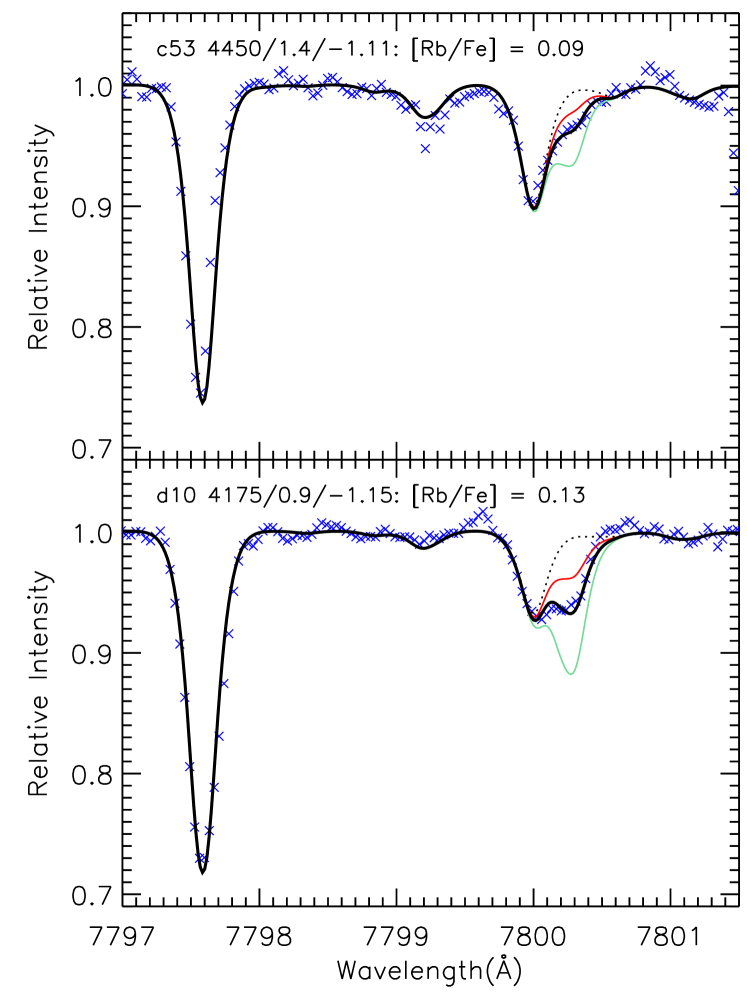
As already noted, measurements of Rb and Pb were only possible for the two program stars observed at the Magellan Telescope. In Figure 3 we show observed and synthetic spectra near the 7800Å Rb i feature. We measure values of [Rb/Fe] = +0.09 and +0.13 for stars c53 and d10, respectively. As can be seen in Figure 9, those values fall closer to M5 ([Rb/Fe] = 0.00) than to M4 ([Rb/Fe] = +0.39; Yong et al. 2008b). D’Orazi et al. (2013) measured [Rb/Fe] in three globular clusters (NGC 6752, NGC 1904 and 47 Tuc) and found constant values in each cluster at the [Rb/Fe] 0.0 level. The [Rb/Zr] ratios are 0.04 and 0.05 for stars c53 and d10, respectively, when the Zr abundances are shifted on the Smith et al. (2000) scale as described in Yong et al. (2006). The [Rb/Zr] ratios in M62 lie below those of M4 and M5, [Rb/Zr] = +0.17 and +0.08, respectively, but above the Cen values (Smith et al., 2000). In summary, the low [Rb/Fe] and [Rb/Zr] ratios in M62 offer no support for a weak -process contribution (i.e., the -process in massive stars from the 22Ne(,)25Mg reaction) from which the high neutron density would result in considerably higher [Rb/Fe] and [Rb/Zr] ratios than observed. We will revisit the [Rb/Zr] ratio in the context of fast-rotating massive stars later in this subsection.
The Sr abundance in M62, [Sr/Fe] = 0.39, appears to be unusually low compared to the neighbouring elements, [Rb/Fe] = +0.11 and [Y/Fe] = +0.16. Since our analysis only considered one line, Sr i 4607.33Å, we regard the low Sr abundance with some caution. Indeed, other studies that consider the 4607.33Å Sr i line in globular cluster giants find [Sr/Fe] ratios that are lower than for the neighbouring elements [Rb/Fe], [Y/Fe] and [Zr/Fe] (e.g., Roederer et al., 2011, Yong et al. 2014, in preparation). Bergemann et al. (2012) investigated non-LTE corrections for the 4607.33Å Sr line, and for //[Fe/H] = 4400/2.2/1.2, the correction is 0.29 dex. The magnitude and sign of this correction would help to reconcile the Sr abundances with those of Rb and Y. In Figure 9 we adjust the Sr abundance accordingly.
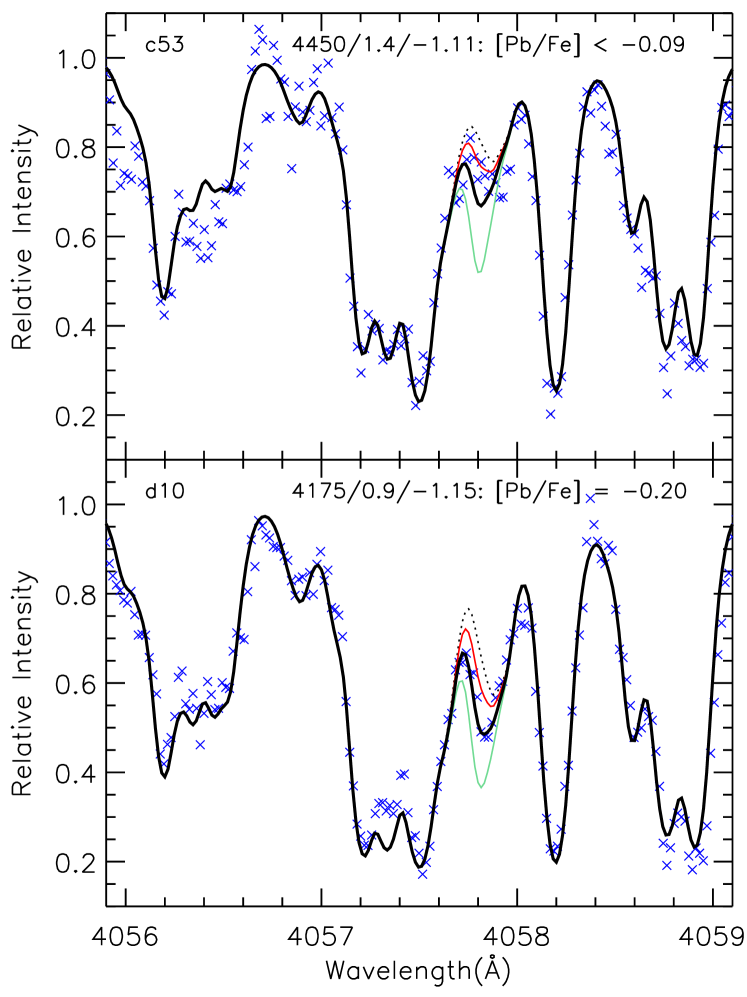
In Figure 4, we plot observed and synthetic spectra near the 4058Å Pb i feature. We measure values of [Pb/Fe] 0.09 and [Pb/Fe] = 0.20 for stars c53 and d10, respectively. For comparison, the average values in M4 and M5 are [Pb/Fe] = +0.30 and 0.35, respectively (Yong et al., 2008b). Thus, the M62 values for [Pb/Fe] lie closer to M5 than to M4 (see Figure 9). Roederer et al. (2010) argue that the Pb/Eu ratio offers a good diagnostic of the presence of -process enriched material. For M62, the Pb to Eu ratios are at the same level as the (more metal-poor) “-process standard stars” in Roederer et al. (2010).
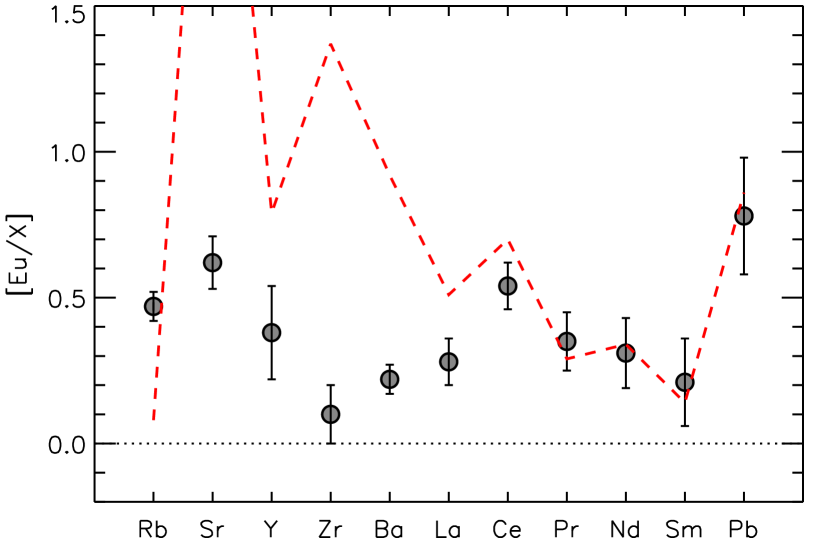
From Table 4, all element ratios [Eu/X] (for X = La and heavier elements) are consistent, within 0.2 dex, with the scaled-solar -process distribution (Bisterzo et al., 2011), see Figure 10. (Note that while we refer to -process and -process elements according to their origin in solar system material, those definitions may be incorrect in M62, e.g., La and Ce in this cluster are likely produced primarily through the -process.) Regarding the lighter elements, the first to deviate from the -process signature is Ba: while the solar -process value is [Eu/Ba]r 0.9 dex, M62 exhibits a ratio of 0.2 dex. In the same way, all elements lighter than Ba depart from the solar system -process signature.
The neutron-capture element abundance ratios of the M62 stars are not consistent with -process nucleosynthesis occurring in AGB stars of low metallicity. Low-mass AGB stars of are the main site of the -process in the Galaxy and typically produce [hs/ls]151515 refers to the heavy -process elements (Ba, La, etc.) and refers to the light -process elements (Y, Zr, etc.). , [Pb/hs] dex and [Rb/Zr] at [Fe/H] (e.g., Busso et al. 2001; Cristallo et al. 2011; Fishlock et al. 2014, in preparation). This is a direct consequence of the operation of the 13C(,)16O reaction which is the dominant neutron source for (e.g., Busso et al., 1999; Lugaro et al., 2012; Bisterzo et al., 2012). For intermediate-mass AGB stars the 22Ne(,)25Mg reaction is the neutron source and operates during convective thermal pulses. The abundance pattern produced in those stars should be dominated by lighter -process elements (Y, Rb, Sr, Zr) (van Raai et al., 2012; Karakas et al., 2012). At [Fe/H] , typical abundances in stars are [hs/ls] , [Pb/hs] , and [Rb/Zr] dex (Fishlock et al. 2014, in preparation).
Fast-rotating massive stars (which we hereafter refer to interchangeably as “spin stars”) can produce a large amount of -process products at low metallicity, where the dominant neutron source is 22Ne(,)25Mg in the convective He-burning core and in the subsequent convective C-burning shell (Pignatari et al., 2008; Frischknecht et al., 2012). In these stars, 22Ne is primary, i.e., it is not directly produced from the initial CNO abundances as in non-rotating massive stars (see for instance the weak -process in massive stars at solar metallicity, e.g., The et al. 2007; Pignatari et al. 2010). The faster the star rotates, the more primary 22Ne can be made available in the He core. The most abundant elements from the -process in spin stars are Sr, Y and Zr while production for heavier elements up to Ba strongly depends on the rotation speed and on nuclear uncertainties, e.g., on the -capture rates on 22Ne (Pignatari et al., 2008) and on the -capture rates on 17O (e.g., Best et al. 2013). The -process in massive stars cannot produce elements beyond the Ba neutron-magic peak (N = 82) due to basic properties of 22Ne as a neutron source (e.g., Pignatari et al. 2013).
Spin stars have been suggested as the source of the light element abundance variations in globular clusters (Decressin et al., 2007). Recall that in Figure 6 there was no significant correlation between the abundances of Na and the neutron-capture elements. Thus, there is no obvious connection between the star-to-star Na abundance variation and the enhancement in Y, Zr and Ba abundances in this cluster.
Pignatari et al. (2008) explored the impact of changing the amount of primary 22Ne available to make neutrons, from 1 percent (in mass fraction) to 0.2 percent, for a 25 M⊙ model at [Fe/H] = 3. The result of this change was an increase in the [Zr/Ba] ratio from 0.18 to 0.67. As expected, Eu is not efficiently produced by the -process regardless of the initial abundance of 22Ne. M62 stars exhibits an average [Eu/Ba] = +0.2, and this value lies between the -process abundance signature of spin stars and the -process. This intermediate value may be a consequence of the combination of the -process (which makes Eu and some Ba) and the -process in spin stars (producing Ba and only a small amount of Eu).
M62 exhibits [Rb/Zr] and [Rb/Y] ratios of 0.4 and 0.1, respectively. In the models considered by Pignatari et al. (2008), reducing the initial 22Ne abundance from 1 per cent (in mass fraction) to 0.2 percent increases the [Rb/Zr] ratio from 0.86 to 0.57, and the [Rb/Y] ratio from 0.86 to 0.75. The predicted [Rb/Zr] ratio is slightly lower than the observations. Those predictions were based on a 25 M⊙ spin star model. It would be of great interest to explore a larger range of initial masses in order to quantify the final core-collapse supernova yields for the elements from Rb to Zr. On the other hand, it is difficult to reconcile the average [Rb/Y] observed in M62 with spin star nucleosynthesis. Y is efficiently produced at high neutron densities from Sr. The dispersion in the [Y/Fe] ratio is consistent with the measurement uncertainties, although there is a hint that the [Y/Fe] ratios cluster around two values, 0.1 and 0.4.
The abundance enhancement at Y and Zr is a key feature of the lighter element primary process (LEPP) exhibited by some halo stars at lower metallicities, [Fe/H] 2 (e.g., Travaglio et al. 2004). While the astrophysical site of the LEPP is not clearly understood, a number of scenarios have been proposed, including explosive nucleosynthesis triggered by neutrino-winds in core-collapse supernovae (e.g., Woosley & Hoffman 1992; Fröhlich et al. 2006; Farouqi et al. 2009; Arcones & Montes 2011) and the -process in fast-rotating massive stars (e.g., Pignatari et al. 2008). While the aforementioned LEPP explosive scenarios cannot efficiently contribute to elements up to the Ba peak, the -process in spin stars may potentially produce them.
To summarise, while the abundance ratios for the elements Y, Zr and Ba may be consistent with the -process in spin stars, the high [Rb/Y] ratio is difficult to explain. Spin-star models at metallicities closer to that of M62 and for a larger range of initial masses would be needed to perform a consistent chemical evolution study, and test the spin stars scenario for this cluster.
In this context, it has been reported that NGC 6522, a bulge globular cluster, has enhanced Sr and Y abundances consistent with spin star nucleosynthesis (Chiappini et al., 2011). In that study, the abundances were derived from the Sr i 6503.99Å and Y ii 6613.73Å lines. As noted in their paper, the Sr i line is weak. We suspect that this Y ii line is blended with the Fe i 6613.82Å line (Nave et al., 1994), and this Fe line has a lower excitation potential and value of 1.011 eV and 5.587, respectively (Vienna Atomic Line Database, Kupka et al. 1999). It would therefore be interesting to re-examine the Sr and Y abundances in NGC 6522 using additional lines to confirm the Sr and Y enhancements in that cluster.
4.3 The lack of abundance dispersions
Our analysis reveals no evidence for an intrinsic metallicity dispersion in M62. As noted in the introduction, the globular clusters with metallicity dispersions are preferentially the more luminous objects and tend to have extended horizontal branches. Some, and perhaps all, of these clusters may be the nuclei of accreted dwarf galaxies. Based on our results, M62 is a massive globular cluster with an extended horizontal branch that does not harbour a metallicity dispersion.
Star A124 has lower ratios of the neutron-capture elements when compared to the other program stars. Although A124 has stellar parameters and a radial velocity consistent with cluster membership, the Besançon model (Robin et al., 2003) predicts that some field contamination is likely, 4%. The simplest explanation is that A124 is a field star. The O and Na abundances for A124 lie at the lower end of the distribution defined by the cluster stars and are similar to field stars. Proper-motion and/or parallax measurements will test this hypothesis. Nevertheless, future studies may reveal additional stars in M62 with a range of neutron-capture element abundances. If M62 really hosts two populations of stars, of equal size, with distinct neutron-capture element abundances, then the probability of observing six out of seven program stars from a single population is 6%.
5 CONCLUDING REMARKS
In this paper we present a chemical abundance analysis of seven bright giants in M62, a luminous globular cluster with an extended horizontal branch. We find no evidence for a metallicity dispersion, as seen in other luminous globular clusters with similar horizontal branch morphology. We find star-to-star abundance variations and correlations for O, Na and Al and the amplitudes of those variations are comparable to those found in the most massive globular clusters. The elements Zr, Ba and La exhibit enhancements, [X/Fe] +0.4, compared to field stars at the same metallicity. The lack of a significant correlation between the abundances of Na and the neutron-capture elements would suggest that the light element variations and enhancement in Y, Zr and Ba are produced in different processes and/or sites.
For the elements heavier than La, the abundances are consistent with the scaled-solar -process distribution. On the other hand, Y, Zr and Ba are clearly enhanced when compared to the scaled-solar -process distribution. The abundance pattern for these elements is incompatible with the s-process in AGB stars or in non-rotating massive stars. On the other hand, while the abundance distribution for these elements could be produced by fast-rotating massive stars, the high [Rb/Y] ratios that we measure do not match existing FRMS model predictions.
One star has neutron-capture element abundance ratios that are distinct from the remaining stars. While this is likely a field halo star, the identification of additional stars in the vicinity of M62 with similar abundance patterns would be of great interest. Studies of other luminous globular clusters are necessary to complete the census and characterisation of the most luminous clusters in the Milky Way.
Acknowledgments
We thank Christian Johnson for helpful discussions. D.Y, A.A.B, G.D.C, A.I.K and J.E.N gratefully acknowledge support from the Australian Research Council (grants DP0984924, FS110200016, FT110100475 and DP120101237). J.A.-G acknowledges support by the Chilean Ministry for the Economy, Development, and Tourism’s Programa Iniciativa Científica Milenio through grant P07-021-F, awarded to The Milky Way Millennium Nucleus; by Proyecto Fondecyt Postdoctoral 3130552; by Proyecto Fondecyt Regular 1110326; and by Proyecto Basal PFB-06/2007. M.P acknowledges support from the Ambizione grant of the SNSF (Switzerland) and EuroGenesis (MASCHE). Funding for the Stellar Astrophysics Centre is provided by The Danish National Research Foundation. The research is supported by the ASTERISK project (ASTERoseismic Investigations with SONG and Kepler) funded by the European Research Council (Grant agreement no.: 267864).
References
- Alcaino (1978) Alcaino, G. 1978, A&AS, 32, 379
- Allen et al. (2006) Allen, C., Moreno, E., & Pichardo, B. 2006, ApJ, 652, 1150
- Allende Prieto et al. (2004) Allende Prieto, C., Barklem, P. S., Lambert, D. L., & Cunha, K. 2004, A&A, 420, 183
- Alonso-García et al. (2012) Alonso-García, J., Mateo, M., Sen, B., Banerjee, M., Catelan, M., Minniti, D., & von Braun, K. 2012, AJ, 143, 70
- Alonso-García et al. (2011) Alonso-García, J., Mateo, M., Sen, B., Banerjee, M., & von Braun, K. 2011, AJ, 141, 146
- Alves-Brito et al. (2012) Alves-Brito, A., Yong, D., Meléndez, J., Vásquez, S., & Karakas, A. I. 2012, A&A, 540, A3
- Arcones & Montes (2011) Arcones, A. & Montes, F. 2011, ApJ, 731, 5
- Asplund et al. (2009) Asplund, M., Grevesse, N., Sauval, A. J., & Scott, P. 2009, ARA&A, 47, 481
- Barbuy et al. (2009) Barbuy, B., Zoccali, M., Ortolani, S., Hill, V., Minniti, D., Bica, E., Renzini, A., & Gómez, A. 2009, A&A, 507, 405
- Barbuy et al. (2007) Barbuy, B., Zoccali, M., Ortolani, S., Minniti, D., Hill, V., Renzini, A., Bica, E., & Gómez, A. 2007, AJ, 134, 1613
- Barbuy et al. (2006) Barbuy, B., Zoccali, M., Ortolani, S., Momany, Y., Minniti, D., Hill, V., Renzini, A., Rich, R. M., Bica, E., Pasquini, L., & Yadav, R. K. S. 2006, A&A, 449, 349
- Beer & Macklin (1989) Beer, H. & Macklin, R. L. 1989, ApJ, 339, 962
- Bekki & Freeman (2003) Bekki, K. & Freeman, K. C. 2003, MNRAS, 346, L11
- Bekki & Norris (2006) Bekki, K. & Norris, J. E. 2006, ApJ, 637, L109
- Bellazzini et al. (2008) Bellazzini, M., Ibata, R. A., Chapman, S. C., Mackey, A. D., Monaco, L., Irwin, M. J., Martin, N. F., Lewis, G. F., & Dalessandro, E. 2008, AJ, 136, 1147
- Bensby et al. (2013) Bensby, T., Yee, J. C., Feltzing, S., Johnson, J. A., Gould, A., Cohen, J. G., Asplund, M., Meléndez, J., Lucatello, S., Han, C., Thompson, I., Gal-Yam, A., Udalski, A., Bennett, D. P., Bond, I. A., Kohei, W., Sumi, T., Suzuki, D., Suzuki, K., Takino, S., Tristram, P., Yamai, N., & Yonehara, A. 2013, A&A, 549, A147
- Bergemann et al. (2012) Bergemann, M., Hansen, C. J., Bautista, M., & Ruchti, G. 2012, A&A, 546, A90
- Bernstein et al. (2003) Bernstein, R., Shectman, S. A., Gunnels, S. M., Mochnacki, S., & Athey, A. E. 2003, in Society of Photo-Optical Instrumentation Engineers (SPIE) Conference Series, Vol. 4841, Society of Photo-Optical Instrumentation Engineers (SPIE) Conference Series, ed. M. Iye & A. F. M. Moorwood, 1694–1704
- Best et al. (2013) Best, A., Beard, M., Görres, J., Couder, M., deBoer, R., Falahat, S., Güray, R. T., Kontos, A., Kratz, K.-L., LeBlanc, P. J., Li, Q., O’Brien, S., Özkan, N., Pignatari, M., Sonnabend, K., Talwar, R., Tan, W., Uberseder, E., & Wiescher, M. 2013, Phys. Rev. C, 87, 045805
- Biemont et al. (1991) Biemont, E., Baudoux, M., Kurucz, R. L., Ansbacher, W., & Pinnington, E. H. 1991, A&A, 249, 539
- Biémont et al. (2011) Biémont, É., Blagoev, K., Engström, L., Hartman, H., Lundberg, H., Malcheva, G., Nilsson, H., Whitehead, R. B., Palmeri, P., & Quinet, P. 2011, MNRAS, 414, 3350
- Biemont et al. (1981) Biemont, E., Grevesse, N., Hannaford, P., & Lowe, R. M. 1981, ApJ, 248, 867
- Bisterzo et al. (2011) Bisterzo, S., Gallino, R., Straniero, O., Cristallo, S., & Käppeler, F. 2011, MNRAS, 418, 284
- Bisterzo et al. (2012) —. 2012, MNRAS, 422, 849
- Blackwell et al. (1986) Blackwell, D. E., Booth, A. J., Haddock, D. J., Petford, A. D., & Leggett, S. K. 1986, MNRAS, 220, 549
- Blackwell et al. (1979a) Blackwell, D. E., Ibbetson, P. A., Petford, A. D., & Shallis, M. J. 1979a, MNRAS, 186, 633
- Blackwell et al. (1995) Blackwell, D. E., Lynas-Gray, A. E., & Smith, G. 1995, A&A, 296, 217
- Blackwell et al. (1979b) Blackwell, D. E., Petford, A. D., & Shallis, M. J. 1979b, MNRAS, 186, 657
- Blackwell et al. (1980) Blackwell, D. E., Petford, A. D., Shallis, M. J., & Simmons, G. J. 1980, MNRAS, 191, 445
- Busso et al. (2001) Busso, M., Gallino, R., Lambert, D. L., Travaglio, C., & Smith, V. V. 2001, ApJ, 557, 802
- Busso et al. (1999) Busso, M., Gallino, R., & Wasserburg, G. J. 1999, ARA&A, 37, 239
- Carretta (2006) Carretta, E. 2006, AJ, 131, 1766
- Carretta et al. (2009) Carretta, E., Bragaglia, A., Gratton, R., D’Orazi, V., & Lucatello, S. 2009, A&A, 508, 695
- Carretta et al. (2010a) Carretta, E., Bragaglia, A., Gratton, R. G., Lucatello, S., Bellazzini, M., Catanzaro, G., Leone, F., Momany, Y., Piotto, G., & D’Orazi, V. 2010a, ApJ, 714, L7
- Carretta et al. (2013) Carretta, E., Bragaglia, A., Gratton, R. G., Lucatello, S., D’Orazi, V., Bellazzini, M., Catanzaro, G., Leone, F., Momany, Y., & Sollima, A. 2013, A&A, 557, A138
- Carretta et al. (2010b) Carretta, E., Bragaglia, A., Gratton, R. G., Recio-Blanco, A., Lucatello, S., D’Orazi, V., & Cassisi, S. 2010b, A&A, 516, A55
- Carretta & Gratton (1997) Carretta, E. & Gratton, R. G. 1997, A&AS, 121, 95
- Carretta et al. (2011) Carretta, E., Lucatello, S., Gratton, R. G., Bragaglia, A., & D’Orazi, V. 2011, A&A, 533, A69
- Castelli & Kurucz (2003) Castelli, F. & Kurucz, R. L. 2003, in IAU Symp. 210, Modelling of Stellar Atmospheres, ed. N. Piskunov, W. W. Weiss, & D. F. Gray (San Francisco, CA: ASP), A20
- Chiappini et al. (2011) Chiappini, C., Frischknecht, U., Meynet, G., Hirschi, R., Barbuy, B., Pignatari, M., Decressin, T., & Maeder, A. 2011, Nature, 472, 454
- Cocozza et al. (2008) Cocozza, G., Ferraro, F. R., Possenti, A., Beccari, G., Lanzoni, B., Ransom, S., Rood, R. T., & D’Amico, N. 2008, ApJ, 679, L105
- Cohen et al. (2011) Cohen, J. G., Huang, W., & Kirby, E. N. 2011, ApJ, 740, 60
- Cohen & Kirby (2012) Cohen, J. G. & Kirby, E. N. 2012, ApJ, 760, 86
- Cohen et al. (2010) Cohen, J. G., Kirby, E. N., Simon, J. D., & Geha, M. 2010, ApJ, 725, 288
- Contreras et al. (2010) Contreras, R., Catelan, M., Smith, H. A., Pritzl, B. J., Borissova, J., & Kuehn, C. A. 2010, AJ, 140, 1766
- Cristallo et al. (2011) Cristallo, S., Piersanti, L., Straniero, O., Gallino, R., Domínguez, I., Abia, C., Di Rico, G., Quintini, M., & Bisterzo, S. 2011, ApJS, 197, 17
- Da Costa et al. (2009) Da Costa, G. S., Held, E. V., Saviane, I., & Gullieuszik, M. 2009, ApJ, 705, 1481
- Da Costa & Marino (2011) Da Costa, G. S. & Marino, A. F. 2011, PASA, 28, 28
- D’Antona et al. (2002) D’Antona, F., Caloi, V., Montalbán, J., Ventura, P., & Gratton, R. 2002, A&A, 395, 69
- De Angeli et al. (2005) De Angeli, F., Piotto, G., Cassisi, S., Busso, G., Recio-Blanco, A., Salaris, M., Aparicio, A., & Rosenberg, A. 2005, AJ, 130, 116
- de Mink et al. (2009) de Mink, S. E., Pols, O. R., Langer, N., & Izzard, R. G. 2009, A&A, 507, L1
- Decressin et al. (2007) Decressin, T., Meynet, G., Charbonnel, C., Prantzos, N., & Ekström, S. 2007, A&A, 464, 1029
- Den Hartog et al. (2003) Den Hartog, E. A., Lawler, J. E., Sneden, C., & Cowan, J. J. 2003, ApJS, 148, 543
- Dinescu et al. (1999) Dinescu, D. I., Girard, T. M., & van Altena, W. F. 1999, AJ, 117, 1792
- Dinescu et al. (2003) Dinescu, D. I., Girard, T. M., van Altena, W. F., & López, C. E. 2003, AJ, 125, 1373
- D’Orazi et al. (2011) D’Orazi, V., Gratton, R. G., Pancino, E., Bragaglia, A., Carretta, E., Lucatello, S., & Sneden, C. 2011, A&A, 534, A29
- D’Orazi et al. (2013) D’Orazi, V., Lugaro, M., Campbell, S. W., Bragaglia, A., Carretta, E., Gratton, R. G., Lucatello, S., & D’Antona, F. 2013, ApJ, 776, 59
- Farouqi et al. (2009) Farouqi, K., Kratz, K.-L., Mashonkina, L. I., Pfeiffer, B., Cowan, J. J., Thielemann, F.-K., & Truran, J. W. 2009, ApJ, 694, L49
- Fenner et al. (2004) Fenner, Y., Campbell, S., Karakas, A. I., Lattanzio, J. C., & Gibson, B. K. 2004, MNRAS, 353, 789
- Ferraro et al. (2009) Ferraro, F. R., Dalessandro, E., Mucciarelli, A., Beccari, G., Rich, R. M., Origlia, L., Lanzoni, B., Rood, R. T., Valenti, E., Bellazzini, M., Ransom, S. M., & Cocozza, G. 2009, Nature, 462, 483
- Freeman & Bland-Hawthorn (2002) Freeman, K. & Bland-Hawthorn, J. 2002, ARA&A, 40, 487
- Freeman (1993) Freeman, K. C. 1993, in Astronomical Society of the Pacific Conference Series, Vol. 48, The Globular Cluster-Galaxy Connection, ed. G. H. Smith & J. P. Brodie, 608
- Frischknecht et al. (2012) Frischknecht, U., Hirschi, R., & Thielemann, F.-K. 2012, A&A, 538, L2
- Fröhlich et al. (2006) Fröhlich, C., Martínez-Pinedo, G., Liebendörfer, M., Thielemann, F.-K., Bravo, E., Hix, W. R., Langanke, K., & Zinner, N. T. 2006, Physical Review Letters, 96, 142502
- Fuhr & Wiese (2009) Fuhr, J. R. & Wiese, W. L. 2009, in CRC Handbook of Chemistry and Physics, 90th edn. CRC Press, Boca Raton, p. 10
- Fulbright (2000) Fulbright, J. P. 2000, AJ, 120, 1841
- Gallino et al. (1998) Gallino, R., Arlandini, C., Busso, M., Lugaro, M., Travaglio, C., Straniero, O., Chieffi, A., & Limongi, M. 1998, ApJ, 497, 388
- García-Hernández et al. (2006) García-Hernández, D. A., García-Lario, P., Plez, B., D’Antona, F., Manchado, A., & Trigo-Rodríguez, J. M. 2006, Science, 314, 1751
- García-Hernández et al. (2009) García-Hernández, D. A., Manchado, A., Lambert, D. L., Plez, B., García-Lario, P., D’Antona, F., Lugaro, M., Karakas, A. I., & van Raai, M. A. 2009, ApJ, 705, L31
- Goriely & Mowlavi (2000) Goriely, S. & Mowlavi, N. 2000, A&A, 362, 599
- Gratton et al. (2004) Gratton, R., Sneden, C., & Carretta, E. 2004, ARA&A, 42, 385
- Gratton et al. (2012) Gratton, R. G., Carretta, E., & Bragaglia, A. 2012, A&A Rev., 20, 50
- Gratton et al. (2003) Gratton, R. G., Carretta, E., Claudi, R., Lucatello, S., & Barbieri, M. 2003, A&A, 404, 187
- Gustafsson et al. (1975) Gustafsson, B., Bell, R. A., Eriksson, K., & Nordlund, A. 1975, A&A, 42, 407
- Harris (1996) Harris, W. E. 1996, AJ, 112, 1487
- Ivans et al. (2001) Ivans, I. I., Kraft, R. P., Sneden, C., Smith, G. H., Rich, R. M., & Shetrone, M. 2001, AJ, 122, 1438
- Ivans et al. (2005) Ivans, I. I., Sneden, C., Gallino, R., Cowan, J. J., & Preston, G. W. 2005, ApJ, 627, L145
- Ivans et al. (1999) Ivans, I. I., Sneden, C., Kraft, R. P., Suntzeff, N. B., Smith, V. V., Langer, G. E., & Fulbright, J. P. 1999, AJ, 118, 1273
- Johnson & Pilachowski (2010) Johnson, C. I. & Pilachowski, C. A. 2010, ApJ, 722, 1373
- Johnson et al. (2012) Johnson, C. I., Rich, R. M., Kobayashi, C., & Fulbright, J. P. 2012, ApJ, 749, 175
- Kappeler et al. (1989) Kappeler, F., Beer, H., & Wisshak, K. 1989, Reports on Progress in Physics, 52, 945
- Karakas et al. (2012) Karakas, A. I., García-Hernández, D. A., & Lugaro, M. 2012, ApJ, 751, 8
- Kraft (1994) Kraft, R. P. 1994, PASP, 106, 553
- Kraft & Ivans (2003) Kraft, R. P. & Ivans, I. I. 2003, PASP, 115, 143
- Kupka et al. (1999) Kupka, F., Piskunov, N., Ryabchikova, T. A., Stempels, H. C., & Weiss, W. W. 1999, A&AS, 138, 119
- Kurucz & Bell (1995) Kurucz, R. & Bell, B. 1995, Atomic Line Data (R.L. Kurucz and B. Bell) Kurucz CD-ROM No. 23. Cambridge, Mass.: Smithsonian Astrophysical Observatory, 1995., 23
- Lambert & Luck (1976) Lambert, D. L. & Luck, R. E. 1976, The Observatory, 96, 100
- Lanzoni et al. (2010) Lanzoni, B., Ferraro, F. R., Dalessandro, E., Mucciarelli, A., Beccari, G., Miocchi, P., Bellazzini, M., Rich, R. M., Origlia, L., Valenti, E., Rood, R. T., & Ransom, S. M. 2010, ApJ, 717, 653
- Lardo et al. (2013) Lardo, C., Pancino, E., Mucciarelli, A., Bellazzini, M., Rejkuba, M., Marinoni, S., Cocozza, G., Altavilla, G., & Ragaini, S. 2013, MNRAS, 433, 1941
- Lardo et al. (2012) Lardo, C., Pancino, E., Mucciarelli, A., & Milone, A. P. 2012, A&A, 548, A107
- Lawler et al. (2001a) Lawler, J. E., Bonvallet, G., & Sneden, C. 2001a, ApJ, 556, 452
- Lawler et al. (2006) Lawler, J. E., Den Hartog, E. A., Sneden, C., & Cowan, J. J. 2006, ApJS, 162, 227
- Lawler et al. (2009) Lawler, J. E., Sneden, C., Cowan, J. J., Ivans, I. I., & Den Hartog, E. A. 2009, ApJS, 182, 51
- Lawler et al. (2001b) Lawler, J. E., Wickliffe, M. E., den Hartog, E. A., & Sneden, C. 2001b, ApJ, 563, 1075
- Lee et al. (2007) Lee, Y.-W., Gim, H. B., & Casetti-Dinescu, D. I. 2007, ApJ, 661, L49
- Li et al. (2007) Li, R., Chatelain, R., Holt, R. A., Rehse, S. J., Rosner, S. D., & Scholl, T. J. 2007, Phys. Scr, 76, 577
- Lugaro et al. (2012) Lugaro, M., Karakas, A. I., Stancliffe, R. J., & Rijs, C. 2012, ApJ, 747, 2
- Marcolini et al. (2009) Marcolini, A., Gibson, B. K., Karakas, A. I., & Sánchez-Blázquez, P. 2009, MNRAS, 395, 719
- Marín-Franch et al. (2009) Marín-Franch, A., Aparicio, A., Piotto, G., Rosenberg, A., Chaboyer, B., Sarajedini, A., Siegel, M., Anderson, J., Bedin, L. R., Dotter, A., Hempel, M., King, I., Majewski, S., Milone, A. P., Paust, N., & Reid, I. N. 2009, ApJ, 694, 1498
- Marino et al. (2009) Marino, A. F., Milone, A. P., Piotto, G., Villanova, S., Bedin, L. R., Bellini, A., & Renzini, A. 2009, A&A, 505, 1099
- Marino et al. (2011) Marino, A. F., Sneden, C., Kraft, R. P., Wallerstein, G., Norris, J. E., Da Costa, G., Milone, A. P., Ivans, I. I., Gonzalez, G., Fulbright, J. P., Hilker, M., Piotto, G., Zoccali, M., & Stetson, P. B. 2011, A&A, 532, A8
- Marino et al. (2008) Marino, A. F., Villanova, S., Piotto, G., Milone, A. P., Momany, Y., Bedin, L. R., & Medling, A. M. 2008, A&A, 490, 625
- McWilliam & Rich (1994) McWilliam, A. & Rich, R. M. 1994, ApJS, 91, 749
- Mucciarelli et al. (2012) Mucciarelli, A., Bellazzini, M., Ibata, R., Merle, T., Chapman, S. C., Dalessandro, E., & Sollima, A. 2012, MNRAS, 426, 2889
- Nave et al. (1994) Nave, G., Johansson, S., Learner, R. C. M., Thorne, A. P., & Brault, J. W. 1994, ApJS, 94, 221
- Noguchi et al. (2002) Noguchi, K., Aoki, W., Kawanomoto, S., Ando, H., Honda, S., Izumiura, H., Kambe, E., Okita, K., Sadakane, K., Sato, B., Tajitsu, A., Takada-Hidai, T., Tanaka, W., Watanabe, E., & Yoshida, M. 2002, PASJ, 54, 855
- Norris & Da Costa (1995) Norris, J. E. & Da Costa, G. S. 1995, ApJ, 447, 680
- Norris et al. (2010) Norris, J. E., Yong, D., Gilmore, G., & Wyse, R. F. G. 2010, ApJ, 711, 350
- Origlia et al. (2013) Origlia, L., Massari, D., Rich, R. M., Mucciarelli, A., Ferraro, F. R., Dalessandro, E., & Lanzoni, B. 2013, ApJ in press (arXiv:1311.1706)
- Origlia et al. (2011) Origlia, L., Rich, R. M., Ferraro, F. R., Lanzoni, B., Bellazzini, M., Dalessandro, E., Mucciarelli, A., Valenti, E., & Beccari, G. 2011, ApJ, 726, L20
- Otsuki et al. (2006) Otsuki, K., Honda, S., Aoki, W., Kajino, T., & Mathews, G. J. 2006, ApJ, 641, L117
- Pignatari et al. (2010) Pignatari, M., Gallino, R., Heil, M., Wiescher, M., Käppeler, F., Herwig, F., & Bisterzo, S. 2010, ApJ, 710, 1557
- Pignatari et al. (2008) Pignatari, M., Gallino, R., Meynet, G., Hirschi, R., Herwig, F., & Wiescher, M. 2008, ApJ, 687, L95
- Pignatari et al. (2013) Pignatari, M., Hirschi, R., Wiescher, M., Gallino, R., Bennett, M., Beard, M., Fryer, C., Herwig, F., Rockefeller, G., & Timmes, F. X. 2013, ApJ, 762, 31
- Piotto et al. (2002) Piotto, G., King, I. R., Djorgovski, S. G., Sosin, C., Zoccali, M., Saviane, I., De Angeli, F., Riello, M., Recio-Blanco, A., Rich, R. M., Meylan, G., & Renzini, A. 2002, A&A, 391, 945
- Prochaska et al. (2000) Prochaska, J. X., Naumov, S. O., Carney, B. W., McWilliam, A., & Wolfe, A. M. 2000, AJ, 120, 2513
- Ramírez & Cohen (2002) Ramírez, S. V. & Cohen, J. G. 2002, AJ, 123, 3277
- Robin et al. (2003) Robin, A. C., Reylé, C., Derrière, S., & Picaud, S. 2003, A&A, 409, 523
- Roederer et al. (2010) Roederer, I. U., Cowan, J. J., Karakas, A. I., Kratz, K.-L., Lugaro, M., Simmerer, J., Farouqi, K., & Sneden, C. 2010, ApJ, 724, 975
- Roederer & Lawler (2012) Roederer, I. U. & Lawler, J. E. 2012, ApJ, 750, 76
- Roederer et al. (2012) Roederer, I. U., Lawler, J. E., Sobeck, J. S., Beers, T. C., Cowan, J. J., Frebel, A., Ivans, I. I., Schatz, H., Sneden, C., & Thompson, I. B. 2012, ApJS, 203, 27
- Roederer et al. (2011) Roederer, I. U., Marino, A. F., & Sneden, C. 2011, ApJ, 742, 37
- Rutledge et al. (1997) Rutledge, G. A., Hesser, J. E., Stetson, P. B., Mateo, M., Simard, L., Bolte, M., Friel, E. D., & Copin, Y. 1997, PASP, 109, 883
- Saviane et al. (2012) Saviane, I., Da Costa, G. S., Held, E. V., Sommariva, V., Gullieuszik, M., Barbuy, B., & Ortolani, S. 2012, A&A, 540, A27
- Simmerer et al. (2013) Simmerer, J., Ivans, I. I., Filler, D., Francois, P., Charbonnel, C., Monier, R., & James, G. 2013, ApJ, 764, L7
- Skrutskie et al. (2006) Skrutskie, M. F., Cutri, R. M., Stiening, R., Weinberg, M. D., Schneider, S., Carpenter, J. M., Beichman, C., Capps, R., Chester, T., Elias, J., Huchra, J., Liebert, J., Lonsdale, C., Monet, D. G., Price, S., Seitzer, P., Jarrett, T., Kirkpatrick, J. D., Gizis, J. E., Howard, E., Evans, T., Fowler, J., Fullmer, L., Hurt, R., Light, R., Kopan, E. L., Marsh, K. A., McCallon, H. L., Tam, R., Van Dyk, S., & Wheelock, S. 2006, AJ, 131, 1163
- Smith et al. (2000) Smith, V. V., Suntzeff, N. B., Cunha, K., Gallino, R., Busso, M., Lambert, D. L., & Straniero, O. 2000, AJ, 119, 1239
- Sneden (1973) Sneden, C. 1973, ApJ, 184, 839
- Sneden et al. (2000) Sneden, C., Johnson, J., Kraft, R. P., Smith, G. H., Cowan, J. J., & Bolte, M. S. 2000, ApJ, 536, L85
- Sobeck et al. (2011) Sobeck, J. S., Kraft, R. P., Sneden, C., Preston, G. W., Cowan, J. J., Smith, G. H., Thompson, I. B., Shectman, S. A., & Burley, G. S. 2011, AJ, 141, 175
- Stetson & Pancino (2008) Stetson, P. B. & Pancino, E. 2008, PASP, 120, 1332
- The et al. (2007) The, L.-S., El Eid, M. F., & Meyer, B. S. 2007, ApJ, 655, 1058
- Travaglio et al. (2004) Travaglio, C., Gallino, R., Arnone, E., Cowan, J., Jordan, F., & Sneden, C. 2004, ApJ, 601, 864
- Valenti et al. (2007) Valenti, E., Ferraro, F. R., & Origlia, L. 2007, AJ, 133, 1287
- Van Eck et al. (2001) Van Eck, S., Goriely, S., Jorissen, A., & Plez, B. 2001, Nature, 412, 793
- van Raai et al. (2012) van Raai, M. A., Lugaro, M., Karakas, A. I., García-Hernández, D. A., & Yong, D. 2012, A&A, 540, A44
- VandenBerg et al. (2013) VandenBerg, D. A., Brogaard, K., Leaman, R., & Casagrande, L. 2013, ApJ, 775, 134
- Ventura & D’Antona (2005) Ventura, P. & D’Antona, F. 2005, ApJ, 635, L149
- Villanova et al. (2010) Villanova, S., Geisler, D., & Piotto, G. 2010, ApJ, 722, L18
- Woosley & Hoffman (1992) Woosley, S. E. & Hoffman, R. D. 1992, ApJ, 395, 202
- Worley et al. (2013) Worley, C. C., Hill, V., Sobeck, J., & Carretta, E. 2013, A&A, 553, A47
- Yong et al. (2006) Yong, D., Aoki, W., Lambert, D. L., & Paulson, D. B. 2006, ApJ, 639, 918
- Yong & Grundahl (2008) Yong, D. & Grundahl, F. 2008, ApJ, 672, L29
- Yong et al. (2005) Yong, D., Grundahl, F., Nissen, P. E., Jensen, H. R., & Lambert, D. L. 2005, A&A, 438, 875
- Yong et al. (2008a) Yong, D., Karakas, A. I., Lambert, D. L., Chieffi, A., & Limongi, M. 2008a, ApJ, 689, 1031
- Yong et al. (2008b) Yong, D., Lambert, D. L., Paulson, D. B., & Carney, B. W. 2008b, ApJ, 673, 854
- Yong et al. (2013) Yong, D., Meléndez, J., Grundahl, F., Roederer, I. U., Norris, J. E., Milone, A. P., Marino, A. F., Coelho, P., McArthur, B. E., Lind, K., Collet, R., & Asplund, M. 2013, MNRAS, 434, 3542
- Zinn & West (1984) Zinn, R. & West, M. J. 1984, ApJS, 55, 45