119–126
Effectiveness of WISE colour-based selection techniques to uncover obscured AGN
Abstract
We present a highly reliable and efficient mid-infrared colour-based selection technique for luminous active galactic nuclei (AGN) using the Wide-field Infrared Survey Explorer (WISE) survey. Our technique is designed to identify objects with red mid-infrared power-law spectral energy distributions. We studied the dependency of our mid-infrared selection on the AGN intrinsic luminosity and the effectiveness of our technique to uncover obscured AGN missed in X-ray surveys. To do so we used two samples of luminous AGN independently selected in hard X-ray and optical surveys. We used the largest catalogue of 887 [] 5007-selected type 2 quasars (QSO2s) at z0.83 in the literature from the Sloan Digital Sky Survey (SDSS), and the 258 hard (4.5 keV) X-ray-selected AGN from the Bright Ultrahard XMM-Newton Survey (BUXS). The effectiveness of our mid-infrared selection technique increases with the AGN luminosity. At high luminosities and at least up to 1 our technique is very effective at identifying both Compton-thin and Compton-thick AGN.
keywords:
galaxies: general, galaxies: active, infrared: galaxies1 Introduction
A complete census of the obscured AGN is crucial to fully understand the cosmological growth of supermassive black holes (SMBH) and to reveal the nature of the SMBH-galaxy co-evolution. Obscured accretion is a key phase both in AGN growth and in the co-evolution of AGN and their host galaxies as most SMBH mass growth occurs in heavily obscured environments ([Fabian & Iwasawa (1999), Fabian & Iwasawa 1999]). However, even the deepest X-ray surveys conducted to date with XMM-Newton and Chandra at energies 2 keV are incomplete for AGN with line-of-sight neutral hydrogen column densities and they miss the Compton-thick AGN (; e.g. [Burlon et al. 2011), Burlon et al. 2011]).
Surveys at mid-infrared wavelengths (5m) are much less affected by extinction since the obscuring circumnuclear dust reradiates the absorbed nuclear optical-to-X-ray radiation in the infrared. As shown by selection techniques mainly developed with data from Spitzer-IRAC, surveys conducted at mid-infrared wavelengths can potentially reveal the elusive obscured accretion missed by hard X-ray surveys (e.g. [Lacy et al. (2004), Lacy et al. 2004]; [Stern et al. (2005), Stern et al. 2005]; [Alonso-Herrero et al. (2006), Alonso-Herrero et al. 2006]; [Donley et al. (2012), Donley et al. 2012]). AGN population studies with the Wide-field Infrared Survey Explorer (WISE; [Wright et al. (2010), Wright et al. 2010]) are starting to fill the gap between local/deep mid-infrared surveys with IRAS/Spitzer, completing our census of obscured SMBH growth in regions of the luminosity-redshift parameter space poorly sampled. Several works have already demonstrated that using WISE colours alone it is possible to separate stars and star-forming galaxies from luminous AGN (e.g. [Mateos et al. (2012), Mateos et al. 2012]; [Stern et al. (2012), Stern et al. 2012]; [Assef et al. (2013), Assef et al. 2013]; [Mateos et al. (2013), Mateos et al. 2013]; [Yan et al. (2013), Yan et al. 2013]).
In [Mateos et al. (2012), Mateos et al. (2012)] (hereafter M12) we presented a colour-based selection technique of luminous AGN using the 3.4, 4.6, and 12 m bands of WISE (hereafter mid-infrared wedge). We demonstrated this technique is one of the most reliable and efficient to detect X-ray luminous AGN in the literature. Furthermore, in [Mateos et al. (2013), Mateos et al. (2013)] (hereafter M13) we showed it is very effective at revealing both Compton-thin and Compton-thick luminous AGN, at least up to z1. Here we briefly summarise the results of these studies.
2 The data
The samples used are described in detail in M12, M13 and [Reyes et al. (2008), Reyes et al. (2008)] (hereafter R08). Briefly, the Bright Ultra-hard XMM-Newton Survey (BUXS) is a complete flux-limited sample of 258 bright () “ultra-hard” (4.5-10 keV) X-ray selected sources detected over a sky area of 44.43 deg2. Currently 253 objects have been identified through optical spectroscopy, 143 as type 1 AGN (Sy1-1.5) and 110 as type 2 AGN (Sy1.8-2).
We also have used the largest catalogue of 887 [] 5007-selected type 2 quasars (QSO2s) at 0.83 in the literature from the Sloan Digital Sky Survey (SDSS) from R08. These QSO2s were selected independently of their X-ray properties hence, the sample should be unaffected by nuclear obscuration.
3 Results
3.1 Mid-infrared selection of AGN with WISE
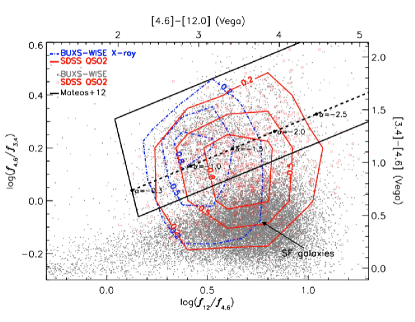
Fig. 1 illustrates our mid-infrared wedge and power-law locus and the WISE colour distributions of the SDSS QSO2s. For comparison we show the colours of all the WISE sources detected in the BUXS fields and of those detected at 2-10 keV energies down to the full depth of the XMM-Newton observations. The great majority of WISE objects detected in X-rays fall in the mid-infrared wedge and cluster near the power-law locus. It seems however, that a substantial fraction of the SDSS QSO2s have the infrared colours of low star-forming galaxies (horizontal sequence in the lower-right part of the diagram).
3.2 Dependence on AGN luminosity
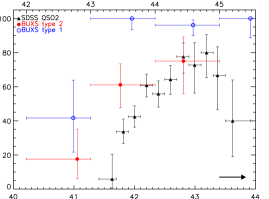
It is well known that the effectiveness of any mid-infrared selection technique is a strong function of the AGN luminosity (e.g. M12; [Donley et al. (2012), Donley et al. 2012]; [Messias et al. (2013), Messias et al. 2013]; M13). Fig. 2 shows the dependence on luminosity of the fraction of SDSS QSO2s and BUXS AGN in the mid-infrared wedge. As most SDSS QSO2s have not been observed in X-rays to compare with the results for the AGN in BUXS we derived their intrinsic 2-10 keV luminosities using the empirical relation between hard X-ray emission and [] 5007 luminosity from [Jin, Ward, & Done (2012), Jin, Ward, & Done (2012)] (top axis in Fig. 2). We see that the effectiveness of our selection technique increases with the AGN luminosity. The fraction of SDSS QSO2s in the mid-infrared wedge is substantially lower than for the BUXS type 1 AGN but it is consistent, within the uncertainties, with that for the BUXS type 2 AGN, especially at the highest luminosities. The apparent different fractions of type 1 and type 2 AGN in the mid-infrared wedge could be explained if all type 2 objects suffer larger extinction at rest-frame near-infrared wavelengths so that, for a given luminosity, their observed WISE fluxes, especially at the shortest wavelengths, are more contaminated by their host galaxies than those of type 1 AGN. Still, at luminosities the mid-infrared wedge is highly effective at selecting obscured AGN ( for the BUXS type 2 AGN and for the SDSS QSO2s).
3.3 Effectiveness of mid-infrared selection to uncover Compton-thick AGN
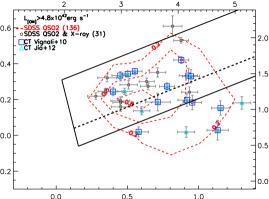
To investigate the effectiveness of our mid-infrared wedge at identifying absorbed luminous AGN missed by deep X-ray surveys we have evaluated whether the SDSS QSO2s identified as Compton-thick candidates in the literature from the studies of [Vignali et al. (2010), Vignali et al. (2010)] and [Jia et al. (2013), Jia et al. (2013)] would be selected by our mid-infrared wedge. To date the X-ray follow-up of the SDSS QSO2s in R08 has focused mainly on the most luminous objects hence, in what follows, we used only the SDSS QSO2s with . The fraction of those objects in the mid-infrared wedge is (99 out of 136 objects). Out of the 31 SDSS QSO2s in this sample with X-ray follow-up, 18 objects are robust Compton-thick candidates. Of these 12 are in the mid-infrared wedge (%). We show in Fig. 3 the WISE colours of the SDSS QSO2s with X-ray follow-up and indicate those objects identified as Compton-thick candidates. We see that the Compton-thick AGN have a distribution of colours that is consistent with that for the SDSS QSO2s with same luminosities. All these results fully support that at high AGN luminosities and at least up to z1 our mid-infrared selection technique is very effective at identifying both Compton-thin and Compton-thick AGN.
Based on observations collected at the European Organisation for Astronomical Research in the Southern Hemisphere, Chile. Based on observations made with the William Herschel Telescope, the Telescopio Nazionale Galileo and the Gran Telescopio de Canarias installed in the Spanish Observatorio del Roque de los Muchachos of the Instituto de Astrofísica de Canarias, in La Palma, Spain. SM acknowledges financial support from the Spanish Plan Nacional through grants AYA2010-21490-C02-01 and AYA2012-31447.
References
- [Alonso-Herrero et al. (2006)] Alonso-Herrero A., et al. 2006, ApJ, 640, 167
- [Assef et al. (2013)] Assef R. J., et al. 2013, ApJ, 772, 26A
- [Burlon et al. 2011)] Burlon D., Ajello M., Greiner J., Comastri A., Merloni A., Gehrels N. 2011, ApJ, 728, 58
- [Donley et al. (2012)] Donley J. L., et al. 2012, ApJ, 748, 142
- [Fabian & Iwasawa (1999)] Fabian A. C., Iwasawa K. 1999, MNRAS, 303, L34
- [Jia et al. (2013)] Jia J., Ptak A., Heckman T., Zakamska N. L. 2013, ApJ, 777, 27
- [Jin, Ward, & Done (2012)] Jin C., Ward M., Done C. 2012, MNRAS, 422, 3268
- [Lacy et al. (2004)] Lacy M., et al. 2004, ApJS, 154, 166
- [Mateos et al. (2012)] Mateos S., et al. 2012, MNRAS, 426, 3271
- [Mateos et al. (2013)] Mateos S., Alonso-Herrero A., Carrera F. J., Blain A., Severgnini P., Caccianiga A., Ruiz A. 2013, MNRAS, 434, 941
- [Messias et al. (2013)] Messias H., Afonso J. M., Salvato M., Mobasher B., Hopkins A. M. 2013, A&A, in press (arXiv:1312.3336)
- [Reyes et al. (2008)] Reyes R., et al. 2008, AJ, 136, 2373
- [Stern et al. (2005)] Stern D., et al. 2005, ApJ, 631, 163
- [Stern et al. (2012)] Stern D., Assef R.J., Benford D.J., et al. 2012, ApJ, 753, 30
- [Vignali et al. (2010)] Vignali C., Alexander D. M., Gilli R., Pozzi F. 2010, MNRAS, 404, 48
- [Wright et al. (2010)] Wright E. L., et al. 2010, AJ, 140, 1868
- [Yan et al. (2013)] Yan L., et al. 2013, AJ, 145, 55