Evidence for a superconducting origin of prominent features of the in-plane infrared response of underdoped cuprates and implications of their persistence above
Abstract
We report on results of our analysis of published experimental data of the in-plane infrared response of two representative underdoped high- cuprate superconductors, focusing on a characteristic gap feature in the spectra of the real part of the conductivity and the corresponding structures of the memory function, that develop below a temperature considerably higher than . Several arguments based on comparisons of the data with results of our calculations are provided indicating that the features are due to superconductivity and that marks the onset of a precursor superconducting phase.
pacs:
74.25.Gz, 74.72.-hThe possible persistence of some form of superconductivity many tens of above the bulk superconducting transition temperature in underdoped cuprate superconductors belongs to the most vividly discussed topics in the field of high- superconductivity, for representative examples of related experimental studies, see Refs. Wang:2006:PRB, ; Li:2010:PRB, ; Li:2013:PRB, ; Gomes:2007:Science, ; Dubroka:2011:PRL, ; Kaiser:2012:condmat, ; Kondo:2011:NaturePhys, ; Reber:2012:NaturePhys, ; Reber:2013:PRB, ; Tallon:2013:PRB, ; Mahyari:2013:PRB, . Surprisingly high (up to above ) values of the temperature of the onset of an increase of coherence, presumably due to an onset of a precursor superconducting phase, have been deduced from the data of the -axis infrared response of underdoped YBa2Cu3O7-δ (Y-123)Dubroka:2011:PRL . The interpretation of the scale in terms of a precursor superconductivity, however, has not yet been widely accepted. The main reasons are: (i) The -axis response of Y-123 is a fairly complex quantity due to the specific bilayer structure of this compound. (ii) Underdoped cuprates are known to exhibit ordered states distinct from superconductivity, in particular, charge modulations have been reportedGhiringhelli:2012:Science ; Chang:2012:NaturePhys that set on at temperatures comparable to . It is thus possible to speculate that the scale is determined by an order competing with superconductivity rather than by superconducting correlations themselves. In this context it is of high importance to identify manifestations of the increase of coherence below in the in-plane response, a quantity, that is less sensitive to structural details than the -axis response, and to ascertain their relation to superconductivity.
It has been already shown by Dubroka et al.Dubroka:2011:PRL that the in-plane infrared conductivity of underdoped Y-123 changes at in a way similar to that of an optimally doped superconductor at . The focus, however, has been on qualitative aspects of the relevant spectral weight shifts, and the related spectral structures have not been addressed. Here we concentrate on the temperature dependence of three prominent spectral features that develop below . Our analysis involves comparisons of the data of two representative underdoped cuprates with those of optimally doped ones and with results of our calculations employing approaches ranging from the Allen’s theory to the fully selfconsistent generalized Eliashberg theory. It provides evidence that the features are due to superconductivity, and the scale due to a form of superconductivity rather than to an ordered state competing with superconductivity.
The paper is organized as follows. First, we summarize the relevant aspects of the experimental infrared data. As examples we use the published data of underdoped (UD) HgBa2CuO4+δ (Hg-1201)Mirzaei:2013:PNAS and of underdoped Y-123Hwang:2006:PRB ; Dubroka:2011:PRL . Next we compare them with the published data of optimally doped (OPD) cuprates and, in particular, with the spectra calculated using the Eliashberg theory. We put emphasis on the similarity between the low temperature () data and the low- calculated spectra and on the similarity between the onset of the features below in UD cuprates and that below in the calculated spectra. In the next paragraph, the data are discussed in terms of the frequently used extended Allen’s theory (EAT) Sharapov:2005:PRB ; Hwang:2006:PRB ; Hwang:2008:PRL ; Hwang:2011:PRB . It will be highlighted that the assumption of a superconductivity unrelated gap in the density of states (DOS) in the temperature range leads to clear inconsistencies with the data. Finally, we present and discuss results of our calculations of the optical spectra, where the gap in the DOS is of superconducting origin, using as inputs recently published properties of the quasiparticle spectral function obtained from the photoemission data by means of the tomographic density of states methodReber:2012:NaturePhys .
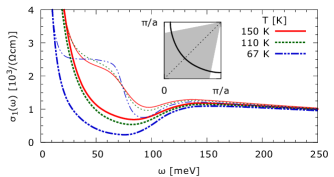
Relevant aspects of the experimental data. The gap feature in the spectra of the real part of the infrared conductivity and the related structures of the memory function defined by Gotze:1972:PRB ; Optselfenergy , will be illustrated with the recently published data of UD Hg-1201 with doping and Mirzaei:2013:PNAS . The data are similar to the earlier published ones of comparably UD Y-123Hwang:2006:PRB ; Dubroka:2011:PRL , but a much more detailed temperature dependence is reported and some spectral features are sharper than in Y-123. Figure 1 shows, in part (a), a selection of the spectra of of Hg-1201 from Fig. 1 of Ref. Mirzaei:2013:PNAS, , and, in parts (b) and (c), the corresponding spectra of and from Fig. 4 of Ref. Mirzaei:2013:PNAS, .
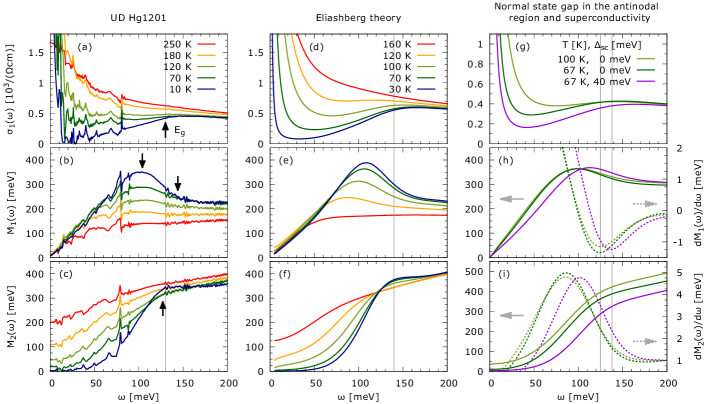
The low temperature spectra of exhibit a gap ranging from low energies to , where a maximum occurs and the slope of the spectra changes, see the arrow in Fig. 1 (a). The change of the slope will be called the gap edge in the following. It is accompanied by a characteristic peak in the spectra of with an onset (change of the slope) feature at the high energy side, and a kink in those of , see the arrows in Figs. 1 (b) and (c). All the three features are well known from earlier infrared studiesTimusk:1999:RPP ; Basov:2005:RMP ; Hwang:2006:PRB ; Hwang:2008:PRL ; Hwang:2011:PRB . What has, however,—to the best of our knowledge—not yet been recognized, is the fact that they appear close to the temperature of Ref. Dubroka:2011:PRL, . This will be discussed below. We focus on first. The and spectra in Fig. 1 (a) display a clear gap edge at an energy close to . The spectrum, on the other hand, does not display any such feature in the relevant spectral range. It can be seen in Fig. 1 of Ref. Mirzaei:2013:PNAS, , that the latter vanishes between and , close to the maximum of Ref. Dubroka:2011:PRL, . The temperature dependence of the characteristic peak in the spectra of is similar: at it is still very clear and almost at the same location as at low temperatures, at it is absent. Note that the onset feature at the high energy side of a similar peak occuring in the case of UD Y-123 has already been reported to vanish around , see the discussion of Fig. 7 of Ref. Hwang:2006:PRB, . Next we address the temperature dependence of the kink in the spectra of . At low temperatures the feature is very sharp (note that the spectrum overshoots the one). It gets smoother slightly above , persists, at approximately the same energy, up to much higher temperatures, and cannot be resolved for temperatures higher than ca .
Comparison with the data of OPD cuprates. In OPD materials, a gap feature in , a peak in and a kink in , similar to those discussed above, set on at (or very slightly above ), for representative examples, see Refs. Puchkov:1996:JPhysCM, ; Marel:2003:Nature, ; Boris:2004:Science, ; Hwang:2004:Nature, . These features of OPD materials are clearly caused by superconductivity, since they develop in parallel with the formation of the loss-free contribution to of the superconducting condensate. It appears, that the three features of OPD materials, that set on at and are due to superconductivity, continuously transform into those of the UD ones, setting on at . This is a strong phenomenological argument in favour of the superconductivity-based interpretation of the three features and the precursor-superconductivity based interpretation of the scale. Recall that the low- superconducting state spectra of of OPD materials are well understood in terms of the model, where charged planar quasiparticles are coupled to spin fluctuations, whose spectrum consists of the resonance mode and a continuumMunzar:1999:PhysicaC ; Carbotte:1999:Nature ; Abanov:2001:PRB ; Casek:2005:PRB ; Chaloupka:2007:PRB . In the following paragraph we demonstrate that the same model provides low- spectra in quantitative agreement with the low- data of the underdoped Hg-1201.
Comparison with the calculated (Eliashberg) spectra. Figures 1 (d), (e) and (f) show the spectra of , and , respectively, calculated using the model and a real axis version of the fully selfconsistent approach of Ref. Chaloupka:2007:PRB, . Computational details and the values of the input parameters, providing the values of and of and , respectively, are given in Sec. I of the supporting information, Ref. Supportinginformation, . The high value of is not surprising considering the observations of Ref. Dahm:2009:NaturePhys, . Note the striking agreement between the low- spectra and the low- data shown in Figs. 1 (a), (b) and (c). The structures of and can be interpreted along the lines of the earlier theoretical studiesCasek:2005:PRB ; Chaloupka:2007:PRB , for a summary, see Fig. 2.
The relation (see the caption of Fig. 2) allows for a quantitative consistency check. The value of of UD Hg-1201 of is indeed approximately consistent with that of of of UD Hg-1201 reported by Yuan Li et al.Li:2012:NaturePhys and the value of of estimated based on the energy of the pairing peak in the Raman spectra of UD Hg-1201 of Ref. Li:2012:PRL, . To conclude, the low temperature infrared spectra of UD Hg-1201 are fully consistent with our model of a d-wave superconductor.
Next we address the temperature dependence (TD) of the model spectra. It can be seen that the three important features—the gap feature in , the characteristic peak of , and the sharp kink of —develop below , in the same fashion as in the data of OPD materialsPuchkov:1996:JPhysCM ; Marel:2003:Nature ; Boris:2004:Science ; Hwang:2004:Nature . In particular, the gap edge forms already close to . What we would like to highlight here is that not only the TD of the data of OPD cuprates but also that of the UD is similar to the model spectra, compare Figs. 1 (a), (b), (c) with Figs. 1 (d), (e), and (f). Note that the development of the gap edge in the UD Hg-1201 below is analogous to that of the model spectra below : somewhat below / a characteristic change of slope appears in , with decreasing temperature its energy approaches and a real gap and the maximum form. The similarity between the TD of the data below and that of the model spectra below provides a further support for the interpretation of the scale in terms of a precursor superconductivity.
Analysis of the above data based on the EAT, problems of interpretations not involving superconductivity. The normal state (i.e., above ) spectra of and of UD Y-123 and Bi2Sr2CaCu2O8+δ (Bi-2212) have been previously successfully fitted and interpreted in terms of the phenomenological EATHwang:2008:PRL ; Hwang:2011:PRB . Note that the application of the EAT is based on two implicit assumptions: (i) The in-plane response is dominated by the contribution of near nodal quasiparticles; (ii) The dominant part of the nodal quasiparticle renormalization comes from a nodal-antinodal boson assisted scattering, the antinodal region being gapped. The essential inputs are the function describing bosonic excitations and the DOS displaying a gap at the Fermi energy, whose physical origin is not specified. Here we provide two indications that the gap captured by the EAT is likely related to superconductivity. (i) We have fitted the Hwang’s data of Ref. Hwang:2006:PRB, using the formulas of the EAT and achieved a degree of agreement comparable to that of Ref. Hwang:2011:PRB, . Details can be found in Sec. II of Ref. Supportinginformation, . The important points are: (a) While the presence of the DOS gap is needed to achieve a high quality fit for temperatures well below , it is not essential for higher temperatures. For the latter (and not for the former, see Sec. III of Ref. Supportinginformation, ), the simple Allen’s theoryAllen:1971:PRB ; Allen:2004:condmat , as used in Refs. VanHeumen:2009:NJP, ; VanHeumen:2009:PRB, , appears to be sufficient. The temperature scale of the gap of the EAT based fits is thus rather than ; (b) The opening of the gap in the DOS causes a spectral weight shift from the gap region to low frequencies, as expected for a precursor superconducting state. (ii) Assuming that the physics at is unrelated to superconductivity, we arrive at a contradiction with the experimental data, as outlined below. Starting from the above assumption, the opening of the superconducting gap in the near nodal region below can be expected to shift the structures established above to higher energies. This shift indeed occurs in the calculated spectra but not in the experimental data. Figure 1 (g) shows the normal ( and ) and the superconducting state () spectra of calculated using the hybrid approach, described, e.g., in Ref. Casek:2005:PRB, , Eschrig:2006:Advances, , employing the Nambu Green’s functions and involving the (bare) dispersion relation of the charged quasiparticles, the superconducting gap ( in the normal case) and the quasiparticle selfenergy. The latter is taken from our EAT based fits of the Y-123 data of Ref. Hwang:2006:PRB, . For details of the calculations, see Sec. IV of Ref. Supportinginformation, . The normal state, conductivity spectrum is very close to the experimental data and exhibits a gap edge around ca . In the superconducting state, the feature is clearly shifted to higher energies, and the same applies to the spectra of and shown in Fig. 1 (h) and Fig. 1 (i). There is no such shift present in the data.
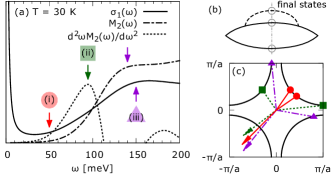
Comparison with the spectra calculated using results obtained by Reber and coworkers. Reber et al.Reber:2012:NaturePhys ; Reber:2013:PRB have recently analyzed their photoemission data of OPD and UD Bi-2212 in terms of the tomographic density of states. This has led them to the observation that the near-nodal gap evolves smoothly through and closes only at a temperature , that is for UD samples considerably higher than (see Ref. Reber:2013:PRB, ) and presumably close to . This is a photoemission data based evidence for the precursor superconductivity scenario. Here we demonstrate that the energy scales of the infrared data and those of the photoemission ones are consistent with each other. We further argue that the data, taken together, imply the presence of superconducting correlations in the temperature range from to . Figure 3 shows the temperature dependence of calculated using the hybrid approach but with the gap magnitude and the structure of the quasiparticle selfenergy from Ref. Reber:2012:NaturePhys, . Details can be found in Sec. IV of Ref. Supportinginformation, .
The thick (thin) lines represent the spectra calculated with the off-diagonal component of the Green’s function included, as in standard superconducting state calculations (not included, as in standard normal state calculations). First of all, it can be seen that the gap edge in occurs at an energy very close to that of the experimental infrared data of underdoped cuprates. Second, the thin lines display a pronounced structure in the middle of the gap, whose energy is determined by , here it is located at ca . It corresponds to transitions accross the superconducting gap, that are not allowed in the coherent superconducting state. The absence of the structure in the infrared data of UD Y-123 (compare, e.g., the line in Fig. 3 of Ref. Hwang:2006:PRB, with the one) rules out the possibility that the above- near nodal gap reported by Reber et al. and the related above gap edge in do not involve superconducting correlations.
In conclusion, the published experimental data of of underdoped high- cuprate superconductors (HTCS) display a clear gap feature below ca , setting on at . This is accompanied by the corresponding structures of the memory function. The features are similar to those of optimally doped HTCS setting on at , that are clearly due to superconductivity and well understood in terms of Eliashberg theory. This similarity and the one between the data and our calculated (Eliashberg) spectra strongly suggest that the gap feature of the underdoped HTCS is also due to superconductivity and its persistence at due to the presence of a precursor superconducting phase. In order to support this interpretation, we have demonstrated that (a) the temperature dependence of the feature cannot be simply accounted for in terms of a normal state gap independent of superconductivity and (b) the infrared data taken together with findings of recent photoemission studies employing the tomographic density of states method imply the presence of superconducting correlations in a broad range of temperatures above .
This work was supported by the project CEITEC—Central European Institute of Technology (CZ.1.05/1.1.00/02.0068) from European Regional Development Fund. B. S. was supported by the Program Nr. CZ.1.07/2.3.00/30.0009 and by the Metacentrum computing facilities(LM2010005). J. Ch. was supported by the AvH Foundation and by EC 7 Framework Programme (286154/SYLICA). Extensive discussions with A. Dubroka and C. Bernhard are gratefully acknowledged. We thank T. Timusk for providing us the data of underdoped Y-123 reported in Ref. Hwang:2006:PRB, and D. Geffroy and A. Dubroka for a critical reading of the manuscript.
References
- (1) Y. Wang, L. Li, and N. P. Ong, Phys. Rev. B 73, 024510 (2006).
- (2) L. Li, Y. Wang, S. Komiya, S. Ono, Y. Ando, G. D. Gu, and N. P. Ong, Phys. Rev. B 81, 054510 (2010).
- (3) L. Li, Y. Wang, and N. P. Ong, Phys. Rev. B 87, 056502 (2013).
- (4) K. K. Gomes, A. N. Pasupathy, A. Pushp, S. Ono, Y. Ando, and Ali Yazdani, Nature 447, 569 (2007).
- (5) A. Dubroka, M. Rössle, K. W. Kim, V. K. Malik, D. Munzar, D. N. Basov, A. A. Schafgans, S. J. Moon, C. T. Lin, D. Haug, V. Hinkov, B. Keimer, Th. Wolf, J. G. Storey, J. L. Tallon, and C. Bernhard, Phys. Rev. Lett. 106, 047006 (2011).
- (6) S. Kaiser, D. Nicoletti, C. R. Hunt, W. Hu, I. Gierz, H. Y. Liu, M. Le Tacon, T. Loew, D. Haug, B. Keimer, and A. Cavalleri, cond-mat/1205.4661.
- (7) T. Kondo, Y. Hamaya, A. D. Palczewski, T. Takeuchi, J. S. Wen, Z. J. Xu, G. Gu, J. Schmalian, and A. Kaminski, Nature Phys. 7, 21 (2011).
- (8) T. J. Reber, N. C. Plumb, Z. Sun, Y. Cao, Q. Wang, K. McElroy, H. Iwasawa, M. Arita, J. S. Wen, Z. J. Xu, G. Gu, Y. Yoshida, H. Eisaki, Y. Aiura, and D. S. Dessau, Nature Phys. 8, 606 (2012).
- (9) T. J. Reber, N. C. Plumb, Y. Cao, Z. Sun, Q. Wang, K. McElroy, H. Iwasawa, M. Arita, J. S. Wen, Z. J. Xu, G. Gu, Y. Yoshida, H. Eisaki, Y. Aiura, and D. S. Dessau, Phys. Rev. B 87, 060506(R) (2013).
- (10) J. L. Tallon, F. Barber, J. G. Storey, and J. W. Loram, Phys. Rev. B 87, 140508(R) (2013).
- (11) Z. L. Mahyari, A. Cannel, E. V. L. de Mello, M. Ishikado, H. Eisaki, Ruixing Liang, D. Bonn, and J. E. Sonnier, Phys. Rev. B 88, 144504 (2013).
- (12) G. Ghiringhelli, M. Le Tacon, M. Minola, S. Blanco-Canosa, C. Mazzoli, N. B. Brookes, G. M. De Luca, A. Frano, D. G. Hawthorn, F. He, T. Loew, M. Moretti Sala, D. C. Peets, M. Salluzzo, E. Schierle, R. Sutarto, G. A. Sawatzky, E. Weschke, B. Keimer, L. Braicovich, Science 337, 821 (2012).
- (13) J. Chang, E. Blackburn, A. T. Holmes, N. B. Christensen, J. Larsen, J. Mesot, R. X. Liang, D. A. Bonn, W. N. Hardy, A. Watenphul, M. von Zimmermann, E. M. Forgan, S. M. Hayden, Nature Phys. 8, 871 (2012).
- (14) S. I. Mirzaei, D. Stricker, J. N. Hancock, C. Berthod, A. Georges, E. van Heumen, M. K. Chan, X. Zhao, Y. Li, M. Greven, N. Barišić, and D. van der Marel, Proceedings of the National Academy of Sciences of the Unites States of America 110, 5774 (2013).
- (15) J. Hwang, J. Yang, T. Timusk, S. G. Sharapov, J. P. Carbotte, D. A. Bonn, Ruixing Liang, and W. N. Hardy, Phys. Rev. B 73, 014508 (2006).
- (16) S. G. Sharapov and J. P. Carbotte, Phys. Rev. B 72, 134506 (2005).
- (17) J. Hwang, J. P. Carbotte, and T. Timusk, Phys. Rev. Lett. 100, 177005 (2008).
- (18) J. Hwang, Phys. Rev. B 83, 014507 (2011).
- (19) W. Götze and P. Wölfle, Phys. Rev. B 6, 1226 (1972).
- (20) The so called optical selfenergy is defined by .
- (21) For a review, see T. Timusk and B. Statt, Rep. Prog. Phys. 62, 61 (1999).
- (22) For a review, see D. N. Basov and T. Timusk, Rev. Mod. Phys. 77, 721 (2005).
- (23) A. V. Puchkov, D. N. Basov, T. Timusk, J. Phys.: Condens. Matter 8, 10049 (1996).
- (24) D. van der Marel, H. J. A. Molegraaf, J. Zaanen, Z. Nussinov, F. Carbone, A. Damascelli, H. Eisaki, M. Greven, P. H. Kes, and M. Li, Nature 425, 271 (2003).
- (25) A. V. Boris, N. N. Kovaleva, O. V. Dolgov, T. Holden, C. T. Lin, B. Keimer, C. Bernhard, Science 304, 708 (2004).
- (26) J. Hwang, T. Timusk, and G. D. Gu, Nature 427, 714 (2004).
- (27) D. Munzar, C. Bernhard, and M. Cardona, Physica C 312, 121 (1999).
- (28) J. P. Carbotte, E. Schachinger, and D. N. Basov, Nature 401, 354 (1999).
- (29) A. Abanov, A. V. Chubukov, and J. Schmalian, Phys. Rev. B 63, 180510(R) (2001).
- (30) P. Cásek, C. Bernhard, J. Humlíček, and D. Munzar, Phys. Rev. B 72, 134526 (2005).
- (31) J. Chaloupka and D. Munzar, Phys. Rev. B 76, 214502 (2007).
- (32) F. Marsiglio, T. Startseva, and J. P. Carbotte, Physics Lett. A, 245, 172 (1998).
- (33) Supporting material.
- (34) T. Dahm, V. Hinkov, S. V. Borisenko, A. A. Kordyuk, V. B. Zabolotnyy, J. Fink, B. Büchner, D. J. Scalapino, W. Hanke and B. Keimer, Nature Phys. 5, 217 (2009).
- (35) Yuan Li, G. Yu, M. K. Chan, V. Balédent, Yangmu Li, N. Barišić, X. Zhao, K. Hradil, R. A. Mole, Y. Sidis, P. Steffens, P. Bourges and M. Greven, Nature Phys. 8, 404 (2012).
- (36) Yuan Li, M. Le Tacon, M. Bakr, D. Terrade, D. Manske, R. Hackl, L. Ji, M. K. Chan, N. Barišić, X. Zhao, M. Greven, and B. Keimer, Phys. Rev. Lett. 108, 227003 (2012).
- (37) P. B. Allen, Phys. Rev. B 3, 305 (1971).
- (38) P. B. Allen, cond-mat/0407777v1.
- (39) E. van Heumen, W. Meevasana, A. B. Kuzmenko, H. Eisaki, and D. van der Marel, New Journal of Physics 11, 055067 (2009).
- (40) E. van Heumen, E. Muhlethaler, A. B. Kuzmenko, H. Eisaki, W. Meevasana, M. Greven, and D. van der Marel, Phys. Rev. B 79, 184512 (2009).
- (41) For a related review, see M. Eschrig, Advances in Physics 55, 47 (2006).