GRB 120422A/SN 2012bz: Bridging the Gap between Low- And High-Luminosity GRBs
At low redshift, a handful of gamma-ray bursts (GRBs) have been discovered with peak luminosities () substantially lower than the average of the more distant ones (). The properties of several low-luminosity (low-) GRBs indicate that they can be due to shock break-out, as opposed to the emission from ultrarelativistic jets. Owing to this, it is highly debated how both populations are connected, and whether there is a continuum between them. The burst at redshift from 2012 April 22 is one of the very few examples of intermediate- GRBs with a -ray luminosity of that have been detected up to now. Together with the robust detection of its accompanying supernova SN 2012bz, it has the potential to answer important questions on the origin of low- and high- GRBs and the GRB-SN connection. We carried out a spectroscopy campaign using medium- and low-resolution spectrographs at 6–10-m class telescopes, covering the time span of 37.3 days, and a multi-wavelength imaging campaign from radio to X-ray energies over a duration of days. Furthermore, we used a tuneable filter centred at H to map star formation in the host galaxy and the surrounding galaxies. We used these data to extract and model the properties of different radiation components and incorporate spectral-energy-distribution fitting techniques to extract the properties of the host galaxy. Modelling the light curve and spectral energy distribution from the radio to the X-rays revealed the blast-wave to expand with an initial Lorentz factor of , low for a high- GRB, and that the afterglow had an exceptional low peak luminosity-density of in the sub-mm. Because of the weak afterglow component, we were for the first time able to recover the signature of a shock break-out that was not a genuine low- GRB. At 1.4 hours after the burst, the stellar envelope had a blackbody temperature of and a radius of . The accompanying SN 2012bz reached a peak luminosity of mag, 0.3 mag more luminous than SN 1998bw. The synthesised nickel mass of , ejecta mass of , and kinetic energy of were among the highest recorded values for GRB-SNe, making it the most luminous spectroscopically confirmed SN to data. Nebular emission lines at the GRB location were visible, extending from the galaxy nucleus to the explosion site. The host and the explosion site had close to solar metallicities. The burst occurred in an isolated star-forming region with a SFR that is 1/10th of that in the galaxy’s nucleus. While the prompt -ray emission points to a high- GRB, the weak afterglow and the low were very atypical for such a burst. Moreover the detection of the shock-break-out signature is a new quality for high- GRBs. So far, shock break-outs were exclusively detected for low- GRBs, while GRB 120422A had an intermediate of . Therefore, we conclude that GRB 120422A was a transition object between low- and high- GRBs, supporting the failed-jet model that connects shock-break-out driven low- and high- GRBs that are powered by ultra-relativistic jets.
Key Words.:
dust, extinction — gamma rays: bursts : individual: GRB 120422A - supernovae: individual: SN 2012bz1 Introduction
The discovery of SN 1998bw in the error-box of GRB 980425 by Galama et al. (1998) gave the study of the GRB-SN connection a flying start. This event remains unique in several ways among the many hundred GRBs that have been studied since. It is still the nearest GRB with a measured redshift and it is the least energetic GRB yet observed. Nevertheless, SN 1998bw seems to be representative of the type of SNe that accompany the more typical and brighter long-duration GRBs (for recent reviews see Woosley & Bloom 2006; Hjorth & Bloom 2012), i.e. a bright (), broad-lined (due to the expansion velocities of several ) type Ic SN (i.e. lacking of hydrogen and helium). Interestingly, in only two out of 16 cases of nearby long-duration GRBs () no SN was found to deep limits (Fynbo et al. 2006; Della Valle et al. 2006a; Gal-Yam et al. 2006; Ofek et al. 2007; Kann et al. 2011), though their classification is not free of ambiguity (e.g. Zhang et al. 2009; Kann et al. 2011).
So far, most GRBs with spectroscopically-confirmed SN associations have had a much lower apparent luminosity than the bulk of the long-duration GRBs. GRB 030329 was the first example of a high-luminosity GRB () that was accompanied by a SN (Hjorth et al. 2003; Matheson et al. 2003; Stanek et al. 2003). However, there is a growing number of high-luminosity bursts, defined by (Hjorth 2013), with a spectroscopically-confirmed SN, such as GRBs 050525A (Della Valle et al. 2006b), 081007 (Della Valle et al. 2008; Jin et al. 2013), 091127 (Cobb et al. 2010; Berger et al. 2011), 101219B (Sparre et al. 2011), 130215A (de Ugarte Postigo et al. 2013), 130427A (Xu et al. 2013; Levan et al. 2013), and 130831A (Klose et al. 2013).
Bromberg et al. (2011) suggested that low-luminosity GRBs (; Hjorth 2013) are driven by high-energy emission associated with the shock break-out of their progenitor stars rather than an emerging jet as in typical high-luminosity GRBs (Colgate & McKee 1969; Kulkarni et al. 1998; Campana et al. 2006; Soderberg et al. 2006a; Nakar & Sari 2012). A consequence of these different energy sources is that low- GRBs seem to be about 10-1000 times more common than high- GRBs (Pian et al. 2006; Guetta & Della Valle 2007; Virgili et al. 2009; Wanderman & Piran 2010), but because of their low luminosities they are primarily found at low redshifts as rare events (one every years). In contrast to high- GRBs, low- GRBs typically have single-peak high-energy prompt light curves and can have soft high-energy spectra with peak energies below keV (Campana et al. 2006; Starling et al. 2011, but see Kaneko et al. 2007). Their optical emission is dominated by the SN emission. Until now, radio and X-ray afterglows, but no optical afterglows have been detected for them. The recent GRB 120422A is a particularly interesting case. It has a -ray luminosity that is intermediate between low- and high-luminosity GRBs and has a robust detection of the associated SN (Malesani et al. 2012a; Sánchez-Ramírez et al. 2012; Wiersema et al. 2012; Melandri et al. 2012). A study of this event may thus answer important questions about the origin of both high- and low- GRBs.
The paper is structured as follows. We describe the data gathering and outline the data analysis in Sect. 2, and present the results on the transient following the GRB, from radio to X-ray wavelengths, and the accompanying GRB-SN, SN 2012bz, in Sect. 3, and the properties of the GRB environment and the host galaxy in 4. In Sect. 5 we compare our findings to other events and argue that GRB 120422A represents the missing link between low- and high- GRBs. Finally, we summarise our findings and present our conclusions in Sect. 6.
Throughout the paper we use the convention for the flux density , where is the temporal slope and is the spectral slope. We refer to the solar abundance compiled in Asplund et al. (2009) and adopt as the linear unit of column densities, . Magnitudes reported in the paper are given in the AB system and uncertainties are given at confidence level (c.l.). We assume a CDM cosmology with , , and (Larson et al. 2011).
2 Observations and data reduction
| MJD | Epoch | Telescope/Instrument | Arm/Grating | Spectral | Resolving | Exposure | Slit | Position |
|---|---|---|---|---|---|---|---|---|
| (days) | (days) | range (Å) | power | time (s) | width | angle | ||
| 56039.345 | 0.0443 | Gemini/GMOS-N | R400+OG515 | 5942–10000 | 960 | 10 | 1800 | |
| 56039.431 | 0.1301 | Gemini/GMOS-N | B600 | 3868–6632 | 844 | 10 | 1800 | |
| 56040.017 | 0.7160 | VLT/X-shooter | UVB | 3000–5500 | 4350 | 10 | 410 | |
| VIS | 5500–10000 | 8800 | 09 | |||||
| NIR | 10000–24800 | 5100 | 09 | |||||
| 56042.911 | 3.6112 | GTC/Osiris | R500R | 4800–10000 | 500 | 12 | 1000 | |
| 56044.014 | 4.7139 | VLT/X-shooter | UVB | 3000–5500 | 4350 | 10 | 410 | |
| VIS | 5500–10000 | 8800 | 09 | |||||
| NIR | 10000–24800 | 5100 | 09 | |||||
| 56044.257 | 4.9565 | Keck/LRIS | 400/3400 | 3000–5500 | 750 | 07 | 500 | |
| 400/8500 | 5500–10000 | 1700 | ||||||
| 56048.061 | 8.7604 | VLT/X-shooter | UVB | 3000–5500 | 4350 | 10 | 410 | |
| VIS | 5500–10000 | 8800 | 09 | |||||
| NIR | 10000–24800 | 5100 | 09 | |||||
| 56048.304 | 9.0036 | Gemini/GMOS-N | R400 | 4442–8608 | 960 | 10 | 1700 | |
| 56052.978 | 13.6772 | Gemini/GMOS-S | R400+GG455 | 4892–9008 | 960 | 10 | 1800 | |
| 56053.930 | 14.6301 | GTC/Osiris | R500R | 4800–10000 | 500 | 12 | 750 | |
| 56057.996 | 18.6962 | VLT/X-shootera | UVB | 3000–5500 | 4350 | 10 | 520 | |
| VIS | 5500–10000 | 8800 | 09 | |||||
| NIR | 10000–20700 | 5100 | 09 | |||||
| 56061.996 | 22.6953 | Gemini/GMOS-S | R400+GG455 | 4892–9108 | 960 | 10 | -300 | |
| 56063.999 | 24.6992 | VLT/X-shootera | UVB | 3000–5500 | 4350 | 10 | 520 | |
| VIS | 5500–10000 | 8800 | 09 | |||||
| NIR | 10000–20700 | 5100 | 09 | |||||
| 56066.068 | 26.7680 | Magellan/LDSS3 | VPH_ALL | 3700–9400 | 800 | 12 | 1410 | |
| 56076.025 | 36.7250 | VLT/X-shootera | UVB | 3000–5500 | 4350 | 10 | -1439 | |
| VIS | 5500–10000 | 8800 | 09 | |||||
| NIR | 10000–20700 | 5100 | 09 | |||||
| 56077.000 | 37.7001 | VLT/X-shootera | UVB | 3000–5500 | 4350 | 10 | 1511 | |
| VIS | 5500–10000 | 8800 | 09 | |||||
| NIR | 10000–20700 | 5100 | 09 |
On 2012 April 22 at 7:12:49 UTC (hereafter called ; MJD = 56039.30057), the Burst Alert Telescope (BAT, Barthelmy et al. 2005) aboard Swift detected and localised a faint burst (Troja et al. 2012). Its -ray light curve comprised a single peak with a duration of , followed by a fainter and lower-energetic emission beginning 45 s after the trigger and lasting for 20 s. Within 86 s, the Swift X-Ray Telescope XRT (Burrows et al. 2005) and the UV/Optical Telescope UVOT (Roming et al. 2005) started to observe the field and detected an uncatalogued and rapidly decaying source at (Beardmore et al. 2012; Kuin & Troja 2012; Zauderer et al. 2012). Only NE of the explosion site there is a SDSS galaxy (Cucchiara et al. 2012; Tanvir et al. 2012). Spectra of the explosion site revealed several absorption and emission lines at a common redshift of , and a large number of emission lines at the location of the SDSS galaxy at a redshift identical to that of the GRB (Schulze et al. 2012b; Tanvir et al. 2012).
Thanks to its low redshift and its -ray luminosity ( and ; Zhang et al. 2012) being in between that of high- and low- GRBs, it is an ideal target to search for the accompanying GRB-SN, or place stringent constraints on its absence, if it is another example of a SN-less long GRB. We therefore triggered an extensive imaging campaign with several telescopes from mm to optical wavelengths, as well as a large low- and medium-resolution spectroscopy campaign carried out at 6-m to 10-m class telescopes. These campaigns began min after the trigger and ended days later. Furthermore, we obtained an X-ray spectrum with XMM-Newton 12 days after the explosion. In addition to our own efforts, the GRB-dedicated satellite Swift observed the GRB at UV/optical and X-ray wavelengths for 54.3 days. We incorporated these data as well as radio data obtained with the Arcminute Microkelvin Imager Large Array (AMI-LA; Staley et al. 2013) to present a comprehensive study of this event. In the following, we briefly summarise the observations and describe how the data were analysed. A log of our observations is presented in Tables 1, 3, 26, and 27.
2.1 Optical and NIR spectroscopy
Our spectroscopic campaign began 51 min after the trigger and covered a time span of 37.7 days. The spectral sequence comprised seven medium-resolution spectra obtained with VLT/X-shooter (Vernet et al. 2011); the first three spectra were obtained covering the full spectral bandwidth from 3000 to 24800 Å, while for the remaining ones a -blocking filter (cutting the wavelength coverage at 20700 Å; Vernet et al. 2011) was adopted to increase the S/N in the band. These observations were complemented with ten low-resolution spectra acquired with the Gemini Multi-Object Spectrograph (GMOS, Hook et al. 2004), mounted on Gemini-North and -South, the Gran Telescopio Canarias (GTC) OSIRIS camera, the Keck Low Resolution Imaging Spectrometer (LRIS; Oke et al. 1995) and the Magellan Low Dispersion Survey Spectrograph 3 (LDSS3). Table 1 summarises these observations.
Observing conditions were not always photometric, and observations were performed irrespective of moon distance and phase. For each epoch, we centred the slit on the explosion site and in some cases varied the position angle to probe different parts of the host galaxy, as illustrated in Fig. 1.
VLT/X-shooter data were reduced with the X-shooter pipeline v2.0 (Goldoni et al. 2006).222http://www.eso.org/sci/software/pipelines/ To extract the one-dimensional spectra of the transient and the host galaxy, we used a customised tool that adopts the optimal extraction algorithm by Horne (1986). The Gemini, GTC, and Magellan spectra were reduced and calibrated using standard procedures in IRAF (Tody 1993). Keck data were reduced with a custom pipeline that makes use of standard techniques of long-slit spectroscopy. In all cases we chose a small aperture for studying the optical transient. For studying the emission lines, we extracted the spectral point spread function and extracted the spectrum of the nucleus and the afterglow within an aperture of of each trace, e.g. the FWHMs were 134 and 086 for the galaxy nucleus and the explosion site, respectively, for the UVB and VIS of the first X-shooter spectrum.
All spectra were flux-calibrated with corresponding spectrophotometric standard star observations and the absolute flux scale was adjusted by comparing to photometry. The data were corrected for the Galactic reddening of (Schlegel et al. 1998). All wavelengths were transformed to vacuum wavelengths. In addition, X-shooter data were corrected for heliocentric motion. No telluric correction was applied, as it has no implications for our analysis.
2.2 Imaging
| MJD | Epoch | Instrument | Frequency | Exposure | |
|---|---|---|---|---|---|
| (days) | (days) | time (s) | (mJy; ) | ||
| 56039.3291 | 0.0537 | SCUBA-2 | 350 GHz | 5639 | |
| 56039.3291 | 0.0537 | SCUBA-2 | 665 GHz | 5639 | |
| 56039.5676 | 0.2670 | AMI-LAa | 15 GHz | ||
| 56040.1923 | 0.8917 | SMA | 272 GHz | 3420 | |
| 56041.6806 | 2.3800 | AMI-LAa | 15 GHz | ||
| 56041.9422 | 2.6416 | PdBI | 86.7 GHz | 5040 | |
| 56041.9943 | 2.6937 | CARMA | 92.5 GHz | 3480 | |
| 56043.6806 | 4.3800 | AMI-LAa | 15 GHz | ||
| 56046.7206 | 7.4200 | AMI-LAa | 15 GHz | ||
| 56048.8054 | 9.5048 | PdBI | 86.7 GHz | 5040 | |
| 56052.7506 | 13.450 | AMI-LAa | 15 GHz | ||
| 56067.8906 | 28.590 | AMI-LAa | 15 GHz |
Following the BAT trigger, Swift slewed immediately to the burst and UVOT took a -band settling exposure 86 s after the BAT trigger. Science observations began at and cycled through all filters. Follow-up observations in the and bands continued until days, in the , and UV filters until days, and in the band until days, at which time a final set of observations of the host galaxy was taken in all filters.444Additional UVOT data were acquired in October 2012. These data are not discussed in this paper. This has no implications on our work.
Our ground-based imaging campaign began 31 min after the explosion and spanned a time interval of days. Due to the proximity of a star ( NW of the explosion site), we either moved the position of the optical transient to the NW corner of the chip, or (most of the time) obtained short dithered exposures to avoid excessive saturation.
Observations were carried out with the 2.56-m Nordic Optical Telescope (NOT) equipped with ALFOSC, MOSCA, and StanCAM in the bands (Malesani et al. 2012b; Schulze et al. 2012a). These observations began at 14.29 hr post-burst and were stopped at 44.5 days because of the small Sun distance. Further imaging data were acquired with GMOS-N and GMOS-S in the bands between 31 min and 40.7 days after the explosion (Cucchiara et al. 2012; Perley et al. 2012a). The Gamma-ray Optical/Near-infrared Detector (GROND, Greiner et al. 2007, 2008) mounted at the MPG/ESO 2.2 m telescope on La Silla imaged the field simultaneously in four optical () and three NIR () bands starting at (Nardini et al. 2012). Additional epochs were obtained at nights 2, 9, 11, 20, 29, before the visibility of the field was compromised by its small Sun distance on day 39. We monitored the optical transient in the bands with the 60-inch Palomar telescope for 37 days beginning at and in the bands with the Wide Field Camera (WFCAM) mounted at the United Kingdom Infrared Telescope (UKIRT) on Mauna Kea at seven epochs between and 25.98 day.
We complemented these optical observations with the 10.4-m GTC telescope equipped with OSIRIS in the bands, the multi-filter imager BUSCA mounted at the 2.2-m telescope of Calar Alto (CAHA) in and the bands,555http://www.caha.es/newsletter/news01a/busca/ the 3.5-m CAHA telescope equipped with the Omega2000 camera in the band,666http://www.mpia-hd.mpg.de/IRCAM/O2000/ the LDSS3 camera mounted at the 6-m Clay telescope telescope in the and bands, the Direct CCD Camera mounted on the Irenee du Pont 2.5-m telescope at Las Campanas in the and bands, the 2.4-m Gao-Mei-Gu (GMG) telescope in , and the 1.04-m and the 2-m optical-infrared Himalayan Chandra Telescope in and . Additional NIR data were acquired with the Omega2000 in the bands, the Near-Infrared Imager (NIRI) mounted on Gemini-North in the and bands, and the Wide-field Infrared Camera (WIRC) on the 200-inch Hale telescope at Palomar Observatory in the band (Perley et al. 2012b).
Very late-time observations were secured with the 2.0-m Liverpool telescope, with BUSCA mounted at the 2.2-m CAHA, and GMOS mounted at Gemini-North (Table 27). The observation with the Liverpool telescope comprises 185 images. To minimise the data heterogeneity an observational seeing constraint of was imposed for all epochs. The CAHA observation did unfortunately not go very deep. We will not discuss these data in the following.
In addition to these broad-band observations, we made use of the tuneable filters at the 10.4-m GTC to trace the H emission in the host galaxy on 2012 May 16, 25.5 days after the burst. Observations consisted of 5600 s exposures using a 15-Å wide filter tuned to the wavelength of H at the redshift of the burst ( Å), and a exposure with a 513-Å-wide order-sorter filter centred at 8020 Å to probe the continuum emission (filter f802/51). The seeing was , although the transparency was affected by extinction due to Saharan dust suspended in the atmosphere (Calima).
In general, observing conditions were not always photometric; in particular, part of the NOT observations suffered from poor transparency due to the Calima. Table 26 summarises all observations with good data quality.
We obtained the UVOT data from the Swift Data Archive.777http://www.swift.ac.uk/swift_portal/ These data had bad pixels identified, mod-8 noise corrected, and endowed with FK5 coordinates. We used the standard UVOT data analysis software distributed with HEASOFT 6.12 along with the standard calibration data.888http://heasarc.nasa.gov/lheasoft/ Optical and NIR data were processed through standard procedures (bias subtraction and flat field normalisation) using IRAF or instrument specific software packages, i.e. the GEMINI IRAF software package for GMOS and NIRI, for GROND data a customised pipeline (for details we refer to Yoldaş et al. 2008 and Krühler et al. 2008), a modified version of the WIRCSoft package for P200/WIRC data,999http://humu.ipac.caltech.edu/~jason/sci/wircsoft/index.html and for WFCAM data the UKIRT pipeline.101010http://casu.ast.cam.ac.uk/surveys-projects/wfcam Some observations suffered from variable conditions, and in those cases individual images were weighted according to their S/N. The - and the -band images suffer from fringing, which was corrected using a fringe pattern computed from the science data themselves, although in some cases the presence of the halo from the nearby bright star hampered the process. These data resulted in a lower S/N. Astrometric calibration was computed against the USNO-B1 catalog (Monet et al. 2003), yielding an of . All images were then registered together, yielding a relative RMS of less than . We measure the afterglow location to be .
2.2.1 Sub-mm/mm observations
Our sub-mm/mm observations comprised five epochs and cover a time interval of 9.48 days. First, Smith et al. (2012) simultaneously obtained an early epoch at and with the sub-millimetre continuum camera SCUBA-2 (Holland et al. 2013) on the James Clerk Maxwell Telescope (JCMT). The 1.6-hr observation began at and was performed under moderate weather conditions. The CSO 225 GHz tau, which measures the zenith atmospheric attenuation, was 0.089 initially, but generally degraded through the run. The elevation of GRB 120422A fell from 546 to 304. In the consecutive night, Martin et al. (2012) triggered a short 45-min snapshot observation at the Submillimeter Array (SMA) at . Receivers were tuned to the local oscillator (LO) centre frequency of 271.8 GHz (), with the correlator configured to cover two 4 GHz bands centred at GHz from the LO frequency. All 8 SMA antennas were used in its very extended configuration under excellent weather conditions, with an average zenith opacity of 0.03 (precipitable water vapour of mm) at 225 GHz. A further observation was carried out by Perley (2012) with the Combined Array for Research in Millimeter-Wave Astronomy (CARMA) in D-configuration at 92.5 GHz (). This observation was carried out between 23:13 UT on 24 April and 00:29 UT on April 25. The total on-source integration time was 58 min. We finally obtained two epochs with the Plateau de Bure Interferometer (PdBI) at a frequency of 86.7 GHz () in its 6 antenna compact D configuration. These observations began at and 9.5048 days and lasted for 84 min each. AMI-LA obtained six epochs between 0.27 and 28.59 days after the burst (Staley et al. 2013).
The SCUBA-2 data were reduced in the standard manner (Chapin et al. 2013) using SMURF
(Version 1.5.0) and KAPPA (Version 2.1-4) from the Starlink Project.111111http://starlink.jach.hawaii.edu/starlink
Observations of the SCUBA-2 calibrator Mars bracketed the GRB 120422A
observation, and observations of the calibrator CRL2688 were taken
several hours later. The calibration observations spanned a larger
range of weather conditions than during the GRB 120422A run, and were
in general agreement with the standard values of the flux conversion
factors (Dempsey et al. 2013), which were then used for the flux normalisation.
We reduced CARMA and SMA data with the MIRIAD and MIR-IDL software packages
(Sault et al. 1995).121212http://www.atnf.csiro.au/computing/software/miriad/
https://www.cfa.harvard.edu/~cqi/mircook.html
CARMA data were absolute flux calibrated with observations of 3C84 and Mars.
The calibration of the SMA data is twofold: first we used the nearby quasars J0854+201 and J0909+013
as atmospheric gain calibrators, and then J0854+201 for bandpass calibration.
Absolute flux calibration was bootstrapped from previous measurements of these quasars
resulting in an absolute flux uncertainty of .
PdBI data were reduced with the standard CLIC and MAPPING
software distributed by the Grenoble GILDAS group.131313http://www.iram.fr/IRAMFR/GILDAS
The flux calibration was secured with the Be binary star system MWC349 ( at 86.7 GHz).
2.2.2 X-ray observations
Swift/XRT started to observe the BAT GRB error circle roughly 90 s after the trigger, while it was still slewing. Observations were first carried out in windowed timing mode for 80 s. When the count rate was , XRT switched to photon counting mode. Observations continued until , when the visibility of the field was compromised by its small Sun distance. We obtained the temporal and spectroscopic data from the Swift/XRT Light Curve and Spectrum Repository (Evans et al. 2007, 2009). GRB 120422A was also observed by XMM-Newton with a DDT, starting at 2012 May 3, 15:13 UT. At this epoch, exposures of 56841, 58421 and 58426 s were obtained with the PN, MOS1 and MOS2 detectors, respectively.
To analyse the spectroscopic data we used Xspec, version 12.7.1, as part of HeaSoft 6.12, XMM-Newton specific calibration files and for the Swift/XRT pc mode data the respective Swift calibration files version 13. The X-ray emission up to was discussed in detail in Starling et al. (2012) and Zhang et al. (2012). Therefore, we focus on the analysis of the data after that epoch. In total, XRT registered 270 background-subtracted photons between 0.3 and 10 keV; data that were flagged as bad were excluded from analysis. We re-binned the spectrum to have at least 20 count per bin and applied statistics.
2.3 Photometry
Measuring the brightness of the transient is complicated due to blending with its extended, offset host galaxy. To limit the host contribution to the transient photometry, we used point-spread function (PSF) fitting techniques. Using bright field stars, a model of the PSF was constructed for each individual image and fitted to the optical transient. To provide reliable fit results, all images were registered astrometrically to a precision of better than 008, and the centroid of the fitted PSF was held fixed with a small margin of re-centering corresponding to the uncertainty of the astrometric alignment of the individual images. In addition, the PSF-fitting radius was adjusted to the specific conditions of the observations and instrument, in particular seeing and pixel scale. The fit radius is different for each observation, but typically in the range between 05 and 08. Generally, the radius was smaller under unfavourable sky conditions in an attempt to minimise the host’s effect on the fit. Naturally, this leads to a lower S/N for these measurements than one would expect for isolated point sources.
For images taken under adverse sky conditions (seeing ), with imagers with large pixel scales (e.g. the NIR channels of GROND with 06 per pixel), or in filters/epochs with low S/N (e.g. most of the late NIR data), the individual contributions of point-source and galaxy cannot be disentangled robustly. These measurements are ignored in the following analysis. For all observations the source was close to the centre of the field of view, and differences in the PSF between observations were, therefore, negligible.
To measure the brightness of the transient in the UVOT images, we measured the host galaxy flux at the position of the SN from the later UVOT observations, where there was no longer a contribution from the GRB or SN. This additional flux was then subtracted from our photometric measurements at the position of the GRB. In contrast, host-galaxy photometry was performed via aperture techniques. Here, we used our PSF-model to subtract the transient from the deepest images in each filter with the clearest separation between galaxy and point source, i.e. those images with the smallest FWHM of the stellar PSF. A circular aperture radius was chosen sufficiently large (25, e.g. 10.7 kpc at ), so that the missed emission from low surface brightness regions does not affect our photometry significantly. In addition, we also corroborated the galaxy photometry using elliptical Kron apertures (Kron 1980) via their implementation in Source Extractor (Bertin & Arnouts 1996).
Once a magnitude was established, it was calibrated photometrically against the brightness of a number of field stars measured in a similar manner. Photometry was tied to the SDSS DR8 (Aihara et al. 2011) in the optical filters () and 2MASS (Skrutskie et al. 2006) in the NIR (). For those filter bands not covered by our primary calibration systems (e.g. or ), we used the instrument-specific band passes to transform magnitudes into the respective filter system via synthetic photometry similar to the procedure outlined in Krühler et al. (2011b). UVOT images were calibrated using the method described in Poole et al. (2008).
The photometric error was then estimated based on the contributions from photon statistics and goodness of the PSF fit (typically between 0.5 to 15 %), the absolute accuracy of the primary calibration system (–3% ), the systematic scatter of different instrument/bandpasses with respect to the primary calibrators (–6%) or the uncertainty in the colour transformation (if applicable, –9%).
The photometry described in the earlier paragraph inevitably contains a seeing-dependent fraction of the host light directly at the position of the transient. This contribution is best removed via differential imaging with deep reference frames from the same instrument/filter combination taken after the transient has faded completely. Given the vast number of different observers taking part in our photometry campaign, however, this procedure was not feasible in our case for all images. We instead used reference frames from a single telescope (Gemini-N, obtained days after the explosion) in three filters. We measure: , , and , i.e. a host light contribution of 10%, 7% and 7% in at maximum SN light. To estimate the fraction in different filters, we scaled the above numbers to the respective filters using the SED of the host. We assume that this factor is similar for all data from various telescopes. We note that the values in Table 26 are not corrected for this host contribution.
3 The transient accompanying GRB 120422A
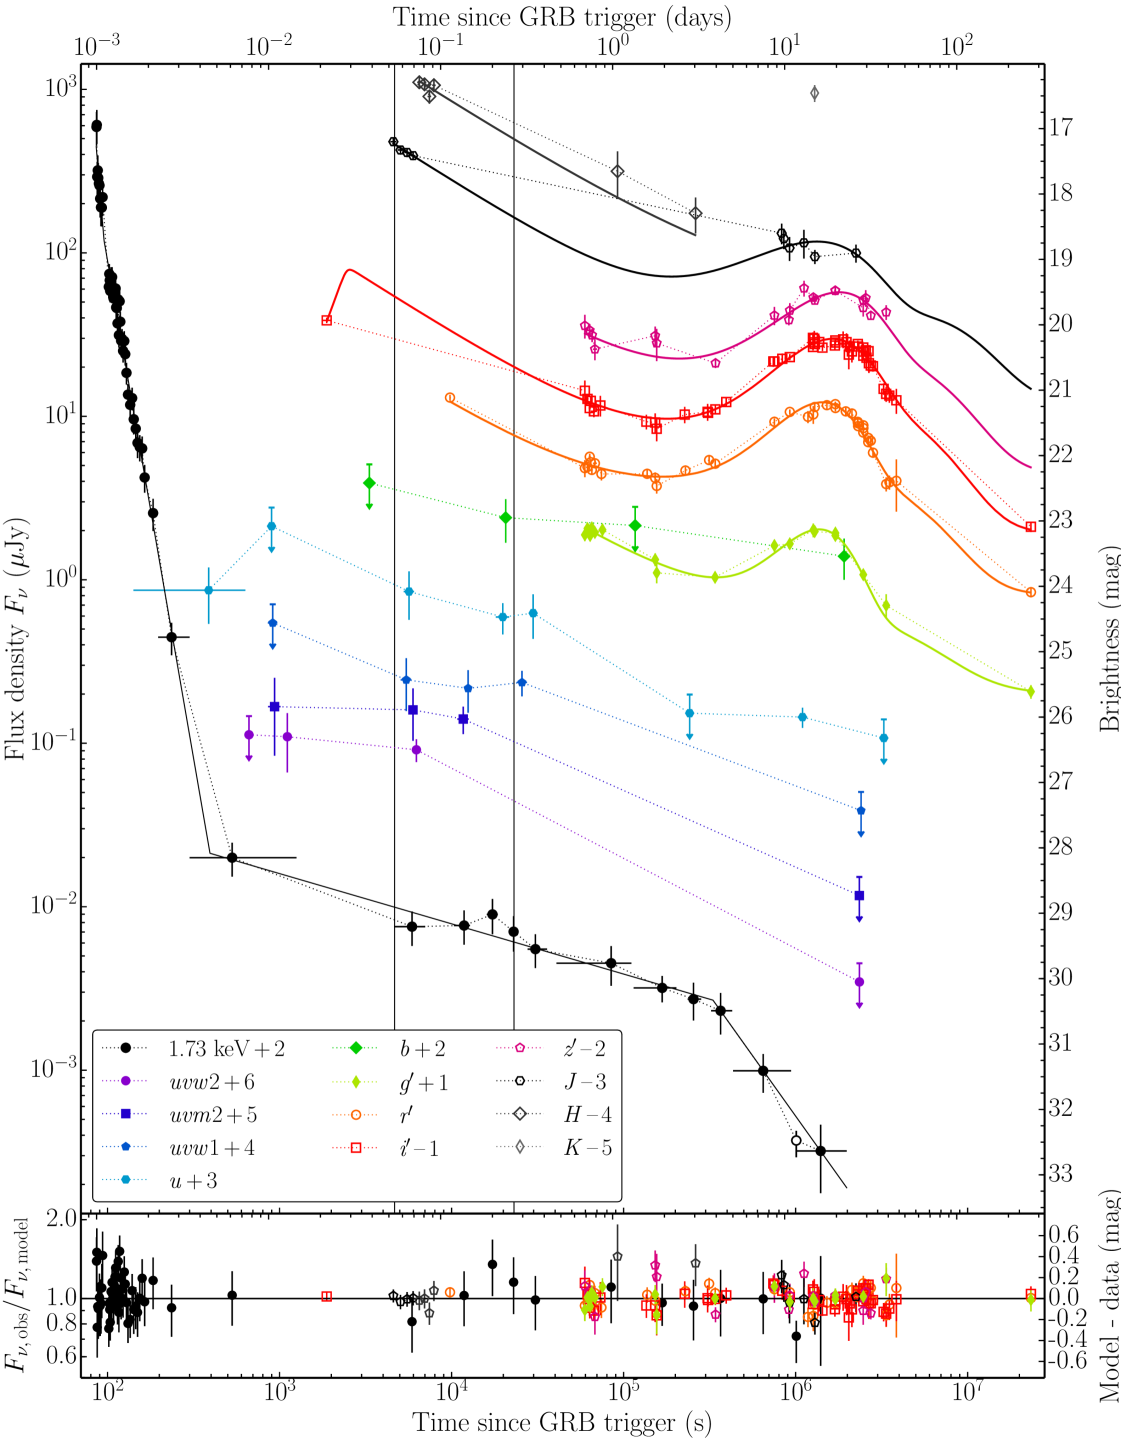
Figure 2 displays the brightness evolution of the transient accompanying GRB 120422A from X-rays to the NIR. During the first three days, its brightness in the UVOT filters gradually decreases with a decay slope of that is followed by a rebrightening peaking at days post-burst. The time scale and the colour evolution of the rebrightening are comparable to those of GRB-SNe (e.g. Zeh et al. 2004). The initially decaying transient could therefore be a superposition of the afterglow and the thermal emission of the cooling photosphere after the SN emerged. Key to understanding the evolution of the transient accompanying GRB 120422A is disentangling the different radiation components. In the following sections we will present our results on each component.
3.1 The stellar envelope cooling-phase
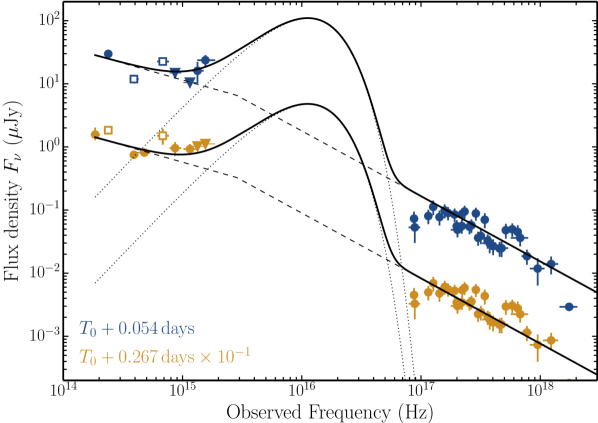
Figure 3 displays spectral energy distributions at 0.054 and 0.267 days after the GRB. While afterglows have spectra formed by piecewise-connected power laws from radio to X-rays (Sari et al. 1998), the cooling phase of the stellar envelope that was heated by the SN shock break-out is characterised by thermal emission peaking in the UV.
The early UV emission is indeed well fitted with a blackbody (for details see Sect. 3.2.3). We measure a blackbody temperature of and a blackbody radius of at . These values are consistent with expectation from the shock-break-out model (e.g. Ensman & Burrows 1992; Campana et al. 2006, and references therein) and lie in the ballpark of observed values of Ib/c SNe, such as 1993J (Richmond et al. 1994, 1996; Blinnikov et al. 1998), 1999ex (Stritzinger et al. 2002), 2008D (Soderberg et al. 2008; Malesani et al. 2009; Modjaz et al. 2009) and 2011dh (Arcavi et al. 2011; Soderberg et al. 2012; Ergon et al. 2013), and of the GRB-SNe 2006aj (Campana et al. 2006) and 2010bh (Cano et al. 2011a; Olivares E. et al. 2012).
The observed decline in the band between its first detection and and the local minimum in the light curve before the SN rise is mag. It is comparable to that observed in GRB 060218 (Campana et al. 2006). However, for this event, these authors also reported a rise in brightness up to 0.57 days after the burst (shifted to the observer frame of GRB 120422A). This initial rise is not present in our data, although the first observation was at 86.4 s after the onset of the -ray emission.
3.2 The afterglow emission
3.2.1 X-rays
Zhang et al. (2012) reported that the early X-ray emission () is consistent with high-latitude emission from the prompt emission phase (e.g. Fenimore & Sumner 1997; Kumar & Panaitescu 2000; Dermer 2004), with evidence for small-scale deviation from power-law models (Starling et al. 2012), possibly due to a thermal component as seen in other GRBs (e.g. Campana et al. 2006; Page et al. 2011; Starling et al. 2011, 2012; Sparre & Starling 2012; Friis & Watson 2013). Friis & Watson (2013) suggested that such a thermal component is not produced by the stellar photosphere but by the photosphere of the GRB jet. In the following, we will focus on the emission at after the burst.
At the time of our XMM-Newton observation the X-ray spectrum is adequately fit as an absorbed power-law with a spectral slope of , with absorption entirely consistent with the Galactic column (). The spectral slope is consistent with that derived from the late time XRT spectrum (), and suggests no late time spectral changes (). The spectral slope is typical for GRB afterglows at that phase.
The joint XRT and XMM-Newton light curve is shown in Fig. 2, where we converted the XRT observations to flux based on the mean spectral index of the system (following Evans et al. 2009), and then added the XMM-Newton observations assuming their measured spectral parameters. The X-ray light curve is adequately fit by a multiply broken power-law with indices of , , , , and break times of , and , the resulting /d.o.f. = 43.5/54. We note that an early break is needed to fit the WT settling mode exposures, which has a chance improvement probability of .
3.2.2 Optical/NIR
As mentioned before, the thermal emission of the cooling photosphere has an intrinsically blue spectrum and does not significantly contribute to the integrated emission in the optical and NIR. Therefore, the optical/NIR emission can be decomposed into three distinct emission components: i) the afterglow, which can be modelled with simple and broken power-law models; ii) the supernova; and iii) the host galaxy, which can be accounted for by a constant flux. To characterise the SN component, we follow the approach in Zeh et al. (2004). They used the multi-color light curves of the prototypical GRB-SN 1998bw (Galama et al. 1998; Patat et al. 2001) as templates. They derived the SN 1998bw light curves at the given GRB redshift, and in the given observed band (including the cosmological -correction), and additionally modified the template with two parameters. The luminosity factor determines the SN peak luminosity in a given band in units of the SN 1998bw peak luminosity in that band. The stretch factor determines if the light curve evolution is faster () or slower () than that of SN 1998bw, whereby the actual evolutionary shape remains the same, and the explosion time is always identical to the GRB trigger time. However, we limit the SN modelling to the bands. Model light curves in bluer or redder filters require extrapolating the spectral range of the SN1998bw template.
The results of our fits are given in Table 15. In this section we report on the afterglow properties and on those of the SN in Sect. 3.3.2. The light curve fits reveal that there is indeed a power-law component, and hence provide strong evidence for an optical/NIR afterglow accompanying GRB 120422A. The fit with a simple power law makes the assumption that the afterglow light curve does not steepen until . For a collimated outflow the observer sees the edge of the jet at a certain time, resulting in a significant steepening (Sari et al. 1999). A jet break after 270 days has been observed in GRB 060729 (Grupe et al. 2010, see also Perley et al. 2013a for a further example of a very late jet break), but a typical value is day (rest-frame; e.g. Zeh et al. 2006; Racusin et al. 2009). We refitted the light curve with a smoothly broken power law (Beuermann et al. 1999), where the post-break decay slope was fixed to 2. The pre-break slope is identical to the value from the simple power law fit. The jet-break time of days (observer frame) is still large and very uncertain, but its value is more consistent with the observed distribution in Racusin et al. (2009). A reason for this large uncertainty in the break time is the brightness of the SN.
Both afterglow models over-predict the -band brightness at by 0.9 mag. The required rise could be either due to the crossing of the injection frequency or due to the coasting phase before the afterglow blast-wave begun decelerating. In the former case the rise slope is -0.5 (with ; Sari et al. 1998), and in the latter between and for constant-density medium and for a free-stellar-wind density profile (Shen & Matzner 2012).
The crossing of the injection frequency is by definition a chromatic feature. It evolves (Sari et al. 1998). This means the ratio between break times in two different bands has to obey . The band has the earliest detection after the first observation and is not affected by the thermal emission from the cooling stellar photosphere. Since the -band light curve is only decaying, crossed this band at after the burst and hence the band at . Already in the limiting case, the expected band magnitude is 0.24 mag brighter than the observed value. Given the small photometric error of 0.04 mag makes the deviation statistically significant and hence this scenario unlikely. The blast-wave’s coasting into a free-stellar-wind ambient density profile is also in conflict with our data, since we detect a clear rise and not a shallow decay.
A steep rise of to is fully consistent with our data. In both cases, the break time is (observer frame). We hence identify the coasting phase into a constant-density circumburst medium as the most likely scenario. Since the break time determines the transition from the coasting to the deceleration phase, it can be used to measure the initial Lorentz factor of the decelerating blast-wave (Sari & Piran 1999; Panaitescu & Kumar 2000; Mészáros 2006). Following Molinari et al. (2007), we measure using the observed break time and the measurement of the energy released during the prompt -ray emission.
3.2.3 The SED from the radio to the X-rays
To characterise the afterglow properties in more detail, we model the joint NIR-to-X-ray spectral energy distribution (SED). We limit this analysis to , since SN 2012bz started contributing a non-negligible amount of flux to the integrated light at later times. We choose the epochs and to match the dates of the sub-mm/mm observations. The optical and NIR fluxes were obtained through interpolation between adjacent data points.141414 In the UV, there are cases where one of the adjacent data points is an upper limit but the epoch of the SED is very close to the time of the detection ( dex). In these cases we treated the interpolated data point as detection but not as upper limit. Errors were estimated by interpolation. The flux scales of the XRT and XMM (MOS1, MOS2, PN) data were adjusted to the brightness of the X-ray afterglow at the respective epochs.
The NIR-to-X-ray SEDs, shown in Fig. 3, have in common that the UV emission is dominated by radiation from the cooling stellar envelope after the shock break-out (Sect. 3.1). To account for this thermal emission, we fit the NIR-to-X-ray SED with absorbed simple and broken power-law models modified by a blackbody model using Xspec v12.8.0. The blackbody model is defined by:
where the numerical constant is defined as , where is the blackbody radius in km, the distance in units of 10 kpc, the Boltzmann constant, the temperature in units of keV, the energy and is the width of the energy bin.
Both SEDs are best fitted by a broken power law with and and a break energy of eV. The difference in the slopes is consistent with the expected value for synchrotron radiation, if the cooling break is between both bands (Sari et al. 1998). This is a further circumstantial evidence that the optical and X-ray emission are produced by the afterglow. Given the sparse sampling of the optical/NIR bands, we fit both epochs simultaneously and fix the difference in the spectral slopes to 0.5 and set the break energies to identical values. The joint fit gives a spectral slope of in the optical (i.e. ), a break energy of eV, no evidence for a significant host absorption at X-ray energies, and a blackbody temperature of eV and radius of at 1.4 hours after the burst. The blackbody component in the second epoch is barely constrained because of the limited amount of UV data. The combined fit statistics is 114.7/74 d.o.f.
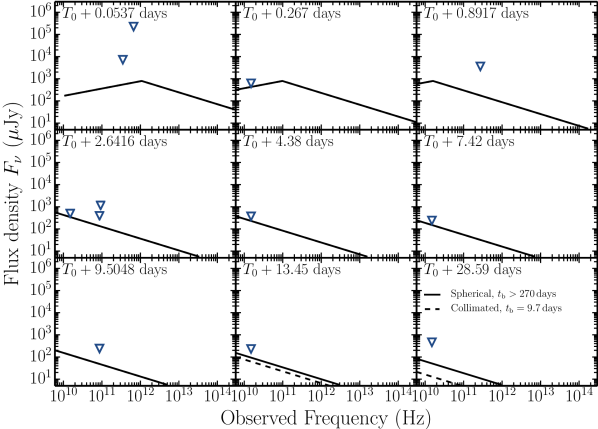
The peak of an afterglow spectrum is typically at cm/sub-mm wavelengths, and usually crosses this band within the first week. We therefore extrapolate the afterglow SED from to radio wavelengths (Fig. 3) and evolve the SED to all epochs of the radio and sub-mm observation listed in Table 3, using the scaling relations for the injection frequency and the peak flux density for a spherical expansion and a post-jet beak evolution from Sari et al. (1998, 1999). In both dynamical scenarios, the peak flux density is , corresponding to a specific luminosity of before the jet break occurred.
3.3 Supernova properties
3.3.1 Supernova spectrum
| Simple power law + free host magnitude | ||||
| Band | Host magnitude | Luminosity | Stretch | |
| (mag) | factor | factor | ||
| … | … | … | ||
| Smoothly broken power law + fixed host magnitude | ||||
| , (fixed), , | ||||
| (fixed) | ||||
| Band | Host magnitude | Luminosity | Stretch | |
| (mag) | factor | factor | ||
| 24.62 | ||||
| 24.09 | ||||
| 24.09 | ||||
| 24.15 | ||||
| 23.96 | ||||
| 23.84 | … | … | ||
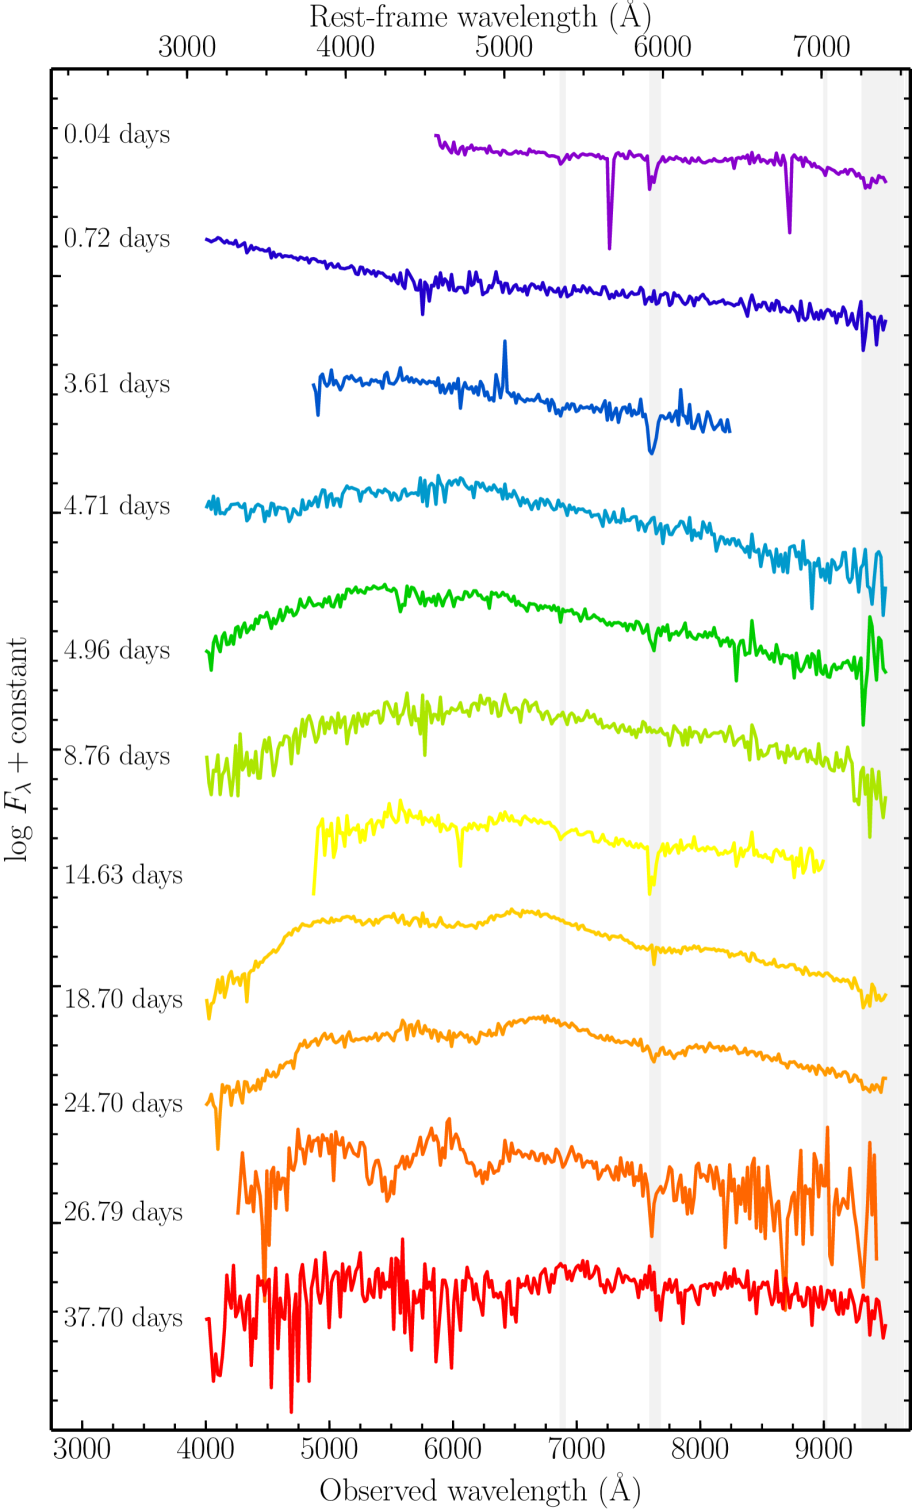
Our spectra of SN 2012bz are displayed in Fig. 4. The very early spectra are dominated by a smooth power-law continuum, characteristic of GRB afterglows. At around 4.7 days, after the transient started re-brightening (Fig. 2), the shape of the spectrum changes and it becomes redder. By May 1 (8.8 days after the GRB), the spectrum has clearly started to resemble that of a supernova with broad lines (Sect. 5.1.1; Malesani et al. 2012a; Sánchez-Ramírez et al. 2012; Wiersema et al. 2012). By May 10 (18.7 days after the GRB), the transformation is complete and our X-shooter spectra from 18.7 and 24.7 days are very similar to those of other broad-lined Type Ic SNe accompanying GRBs (Fig. 11). The Magellan spectrum obtained 26.8 days after the GRB has a low S/N despite showing absorption troughs at locations consistent with the previous data and should be interpreted with great caution. The modelling of the spectral evolution will be presented in a forthcoming paper.
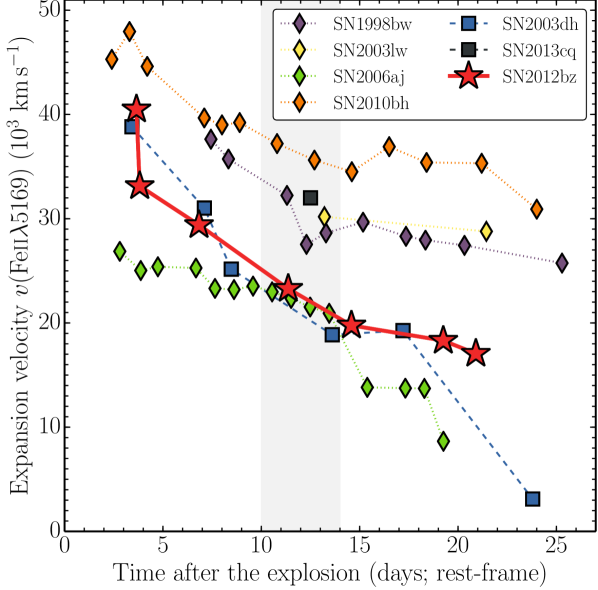
Usually, GRB-SN expansion velocities are reported using , with the Ca ii NIR triplet at 8600 Å reported sometimes as the only alternative (Patat et al. 2001; Hjorth et al. 2003; Chornock et al. 2010; Bufano et al. 2012). In the case of SN 2012bz, the Si ii line is contaminated by the telluric A-band, while the Ca IR triplet is redshifted outside the optical spectrum. For this reason, we chose to measure the expansion velocities based on the feature. In addition, this feature appears earlier than the Si ii feature and its minimum is easier to locate as it lies between two clearly visible maxima (Fig. 4, 11). This makes it a potentially better expansion velocity tracer for GRB-SNe than Si ii, which is super-imposed on a blue continuum and it is not always easy to locate and measure, especially at early times.
We have used the fiducial rest-wavelength of 5169 Å for Fe ii, as done e.g. in Hamuy & Pinto (2002) for the expansion velocities of Type IIP SNe. We stress that even if this identification is not correct for GRB-SNe, due to blending, these measurements are still valuable in order to monitor the expansion velocity evolution and for comparison between different objects as long as the measurements are done consistently. Based on these assumptions, we present the first, to our knowledge, diagram of GRB-SNe expansion velocities, based on (Fig. 5). The velocities (of the order of 5000–50000 km s-1) are in the range measured for other SNe associated with GRBs. SN 2010bh shows the fastest explosion velocities as seen from Si ii, while SN 2006aj the slowest (Chornock et al. 2010; Bufano et al. 2012). SN 2012bz shows large velocities at 3 days past explosion (the earliest spectrum where a measurement is possible) and slowing down to 17000 km s-1 days later. This behaviour is very similar to SN 2003dh associated with the high- GRB 030329 (Hjorth et al. 2003).
3.3.2 Absolute magnitude
The luminosities of SNe are usually reported in the rest-frame band. The bandpass (observer frame) partly overlaps with the rest-frame band, though it is not identical. We compute the -corrected -band magnitude from the -band maximum, following Hogg et al. (2002) and using the X-shooter spectrum from (i.e. after the maximum in -band) as a weighing function. The peak luminosity of is 0.3 mag brighter than SN 1998bw, using the face value of from Cano et al. (2011b).
Measuring the SN luminosity by using a -correction from the observed spectrum is the most direct and accurate approach. However, the number of spectroscopically confirmed GRB-SNe is still small. Moreover, optical spectroscopy is limited to mostly low redshifts (), because of the prohibitively long exposures required for a SN at higher redshifts. In addition, the useful wavelength range is reduced to the red part of the observed spectrum due to line blanketing by iron, as rest-frame UV moves into the optical band, (Filippenko 1997). An alternative approach is to look for “late red bumps” in afterglows light curves, which are due to the GRB-SNe. The best fit parameters of the SN bump with SN 1998bw templates in the bands, as detailed in Sect. 3.2.2, are displayed in Table 15. The fit reveals that SN 2012bz is 0.3 mag more luminous than SN 1998bw in the observed band and the evolution is slightly faster than that of SN 1998bw, and it is somewhat redder.
3.3.3 The explosion-physics parameters
The peak and width of a SN light curve are determined by the explosion-physics parameters, such as ejecta mass , 56Ni mass , and kinetic energy of the SN ejecta. These values are estimated from the bolometric light curve. An estimate of the bolometric light curve was constructed using photometric points, as coverage outside these bands is limited around the SN peak. The light curves in each filter were fitted with spline interpolations starting at 2 days past the GRB trigger, such that an estimated magnitude for all four bands was available at each epoch of observation. Magnitudes were converted into monochromatic fluxes at the effective (rest-frame) wavelengths of the filters for every epoch to produce an SED.161616Since we are evaluating the SED for every observation, nearby epochs (within of each other) were first calculated individually and then averaged when producing the final light curve for clarity. Each SED was then integrated over the limits of the filter wavelength range, i.e. the blue edge of and the red edge of (–8000 Å). The SED was tied to zero flux at these limits, which were defined as the wavelength at which the respective filter’s normalised transmission curve falls below 10%. The integrated fluxes were converted to luminosities using the redshift and cosmology adopted previously. The resulting light curve (Fig. 6) gives a luminosity of the SN over approximately the optical wavelength range.
Contributions to the flux outside this regime, however, are not insignificant, with the optical accounting for of the bolometric flux for stripped-envelope SNe (Lyman et al. 2013). Of particular importance is the contribution from the NIR, wherein the fraction of the total luminosity emitted increases with time, reaching a comparable contribution to the optical within 30 days (e.g. Valenti et al. 2008; Cano et al. 2011a). We estimate this missing NIR flux by using the fractional NIR flux of a similar event, as done in Cano et al. (2011a). A photometric study by Olivares E. et al. (2012) of the low redshift () XRF 100316D/SN 2010bh contains well sampled light curves in the bands, extending upon our rest-frame wavelength limits. The contribution of wavelengths Å to the flux was determined by first integrating SN 2010bh’s de-reddened SED over the same wavelength range used for SN 2012bz above, and then over the wavelength range redward of 8000 Å. Thus, for each epoch of observation, we obtain the NIR contribution as a fraction of the optical flux. The phase of the contributions were normalised so was the peak of the respective SNe, and stretched by a factor to match the light curve shape of the two SNe ( for SN 2012bz, 1.00 for SN 2010bh).171717Phillips (1993) introduced as the decline in the brightness between the maximum and 15 days post maximum in band. The fractional values were interpolated using a smooth spline, in order to sample it at the epochs of observations of SN 2012bz, and the appropriate amount was added to the optical flux. This gives a NIR corrected light curve covering 3000–17000 Å. No attempt was made to account for flux missed below 3000 Å due to the paucity of data constraining the UV in such objects. However, contributions from the UV account for only of the bolometric flux around peak (Lyman et al. 2013).
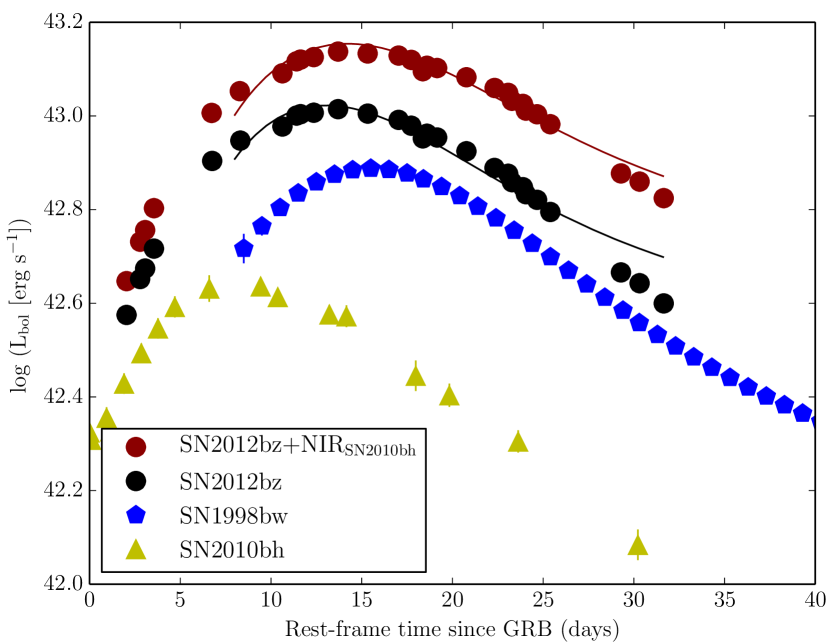
The bolometric light curve was modelled using the simplified analytical prescription of Arnett (1982), updated by Valenti et al. (2008), to obtain estimates of the and . Since obtaining a truly bolometric light curve is unfeasible, we use our optical and optical+NIR correction light curves as approximations. Our data cover the photospheric phase of SN evolution, when the ejecta are considered optically thick. The opacity is chosen to be (see Cano et al. 2011a). To constrain the / ratio, a scale velocity is required (see equation 54 in Arnett 1982), this is taken to be the photospheric velocity () at peak. Fe ii lines are a good tracer of (Valenti et al. 2011), and the peak of the pseudo-bolometric light curve occurs at 13.9 days (from fitting low-order polynomials around peak). Using data in Fig. 5 we take 20500 km s-1 as an estimate of at peak by linearly interpolating between the measurements taken from spectra at epochs 11.380 days and 14.575 days.
Fitting to the optical bolometric light curve reveals the following parameters: , and erg, and when including the NIR contribution from SN 2010bh, we obtain , and erg. The first 8 days were ignored in the fit as contributions from other sources (GRB afterglow and cooling phase following the shock break-out) would compromise the assumptions of the SN model.
It is crucial to note that the errors quoted here include only the statistical uncertainties relating to the construction of the pseudo-bolometric light curves. Systematic errors arise from both the simplifying assumptions in the model (spherical symmetry, centrally concentrated 56Ni mass etc.) and our choice of parameters for the fit, which typically dominate the statistical errors. For example taking an uncertainty in of 2000 km s-1 translates into an error in and of and , respectively. The two-component model for very energetic supernovae () by Maeda et al. (2003) would also suggest we are only observing the outer, lower density region of the ejecta during the photospheric phase ( days), and a fraction is hidden in a denser, inner component during this time. Although the afterglow component is not expected to contribute significantly around the SN peak, given that different afterglow models do not significantly affect the parameters (Sect 3.3.2), potential contamination by underlying host galaxy light is included in this bolometric light curve (Sect. 2.3).
Melandri et al. (2012) modelled SN 2012bz using a scaled spectral model for SN 2003dh to obtain estimates of the physical parameters. They obtained values of , and erg using a bolometric light curve covering 3300–7400 Å. Comparing these to our values for the optical (3000–8000 Å) bolometric light curve, the values are in good agreement, given our slightly extended wavelength range, values are consistent, however their derived ejected mass is larger than our measurement. Differences could be caused by the choice of photospheric velocity , asymmetries, or varying opacity , which spectral modelling can account for.
4 Environments
Absorption and emission lines are powerful diagnostics to characterise the gas and dust phase of interstellar media, such as the extinction, metallicity and star-formation rate (SFR). Since long GRBs are associated with massive stars, these diagnostics give the unique opportunity to study star-forming regions in distant galaxies. In the following, we present our findings on the explosion site, on the host galaxy and its large scale environment (for an independent analysis see Levesque et al. 2012).
4.1 The explosion site
| (Å) | Transition | redshift | (Å) | |
| Explosion site (, ) | ||||
| 3586.22 | 0.2824 | … | ||
| 3595.95 | 0.2827 | … | ||
| … | … | … | ||
| 4779.79 | 0.28245 | … | ||
| 4783.37 | 0.28245 | … | ||
| 5046.00 | 0.2825 | … | ||
| … | … | … | ||
| 6236.87 | H | … | … | |
| 6362.18 | 0.28262 | … | ||
| 6423.34 | 0.28255 | … | ||
| 8419.55 | H | 0.28257 | … | |
| 8447.92 | 0.28286 | … | ||
| 8616.96 | 0.28261 | … | ||
| Host site (; ) | ||||
| 4780.16 | 0.28254 | … | ||
| 4783.73 | 0.28254 | … | ||
| 4920.46 | H | 0.28255 | … | |
| 4963.37 | 0.28262 | … | ||
| 4979.74 | H | 0.28248 | … | |
| 5093.04 | H | 0.28250 | … | |
| 5262.10 | H | 0.28252 | … | |
| 5567.86 | H | 0.28242 | … | |
| 6236.89 | H | 0.28260 | … | |
| 6362.15 | 0.28261 | … | ||
| 6423.60 | 0.28261 | … | ||
| 8419.75 | H | 0.28260 | … | |
| 8446.38 | 0.28262 | … | ||
| 8616.90 | 0.28260 | … | ||
| 8635.40 | 0.28260 | … | ||
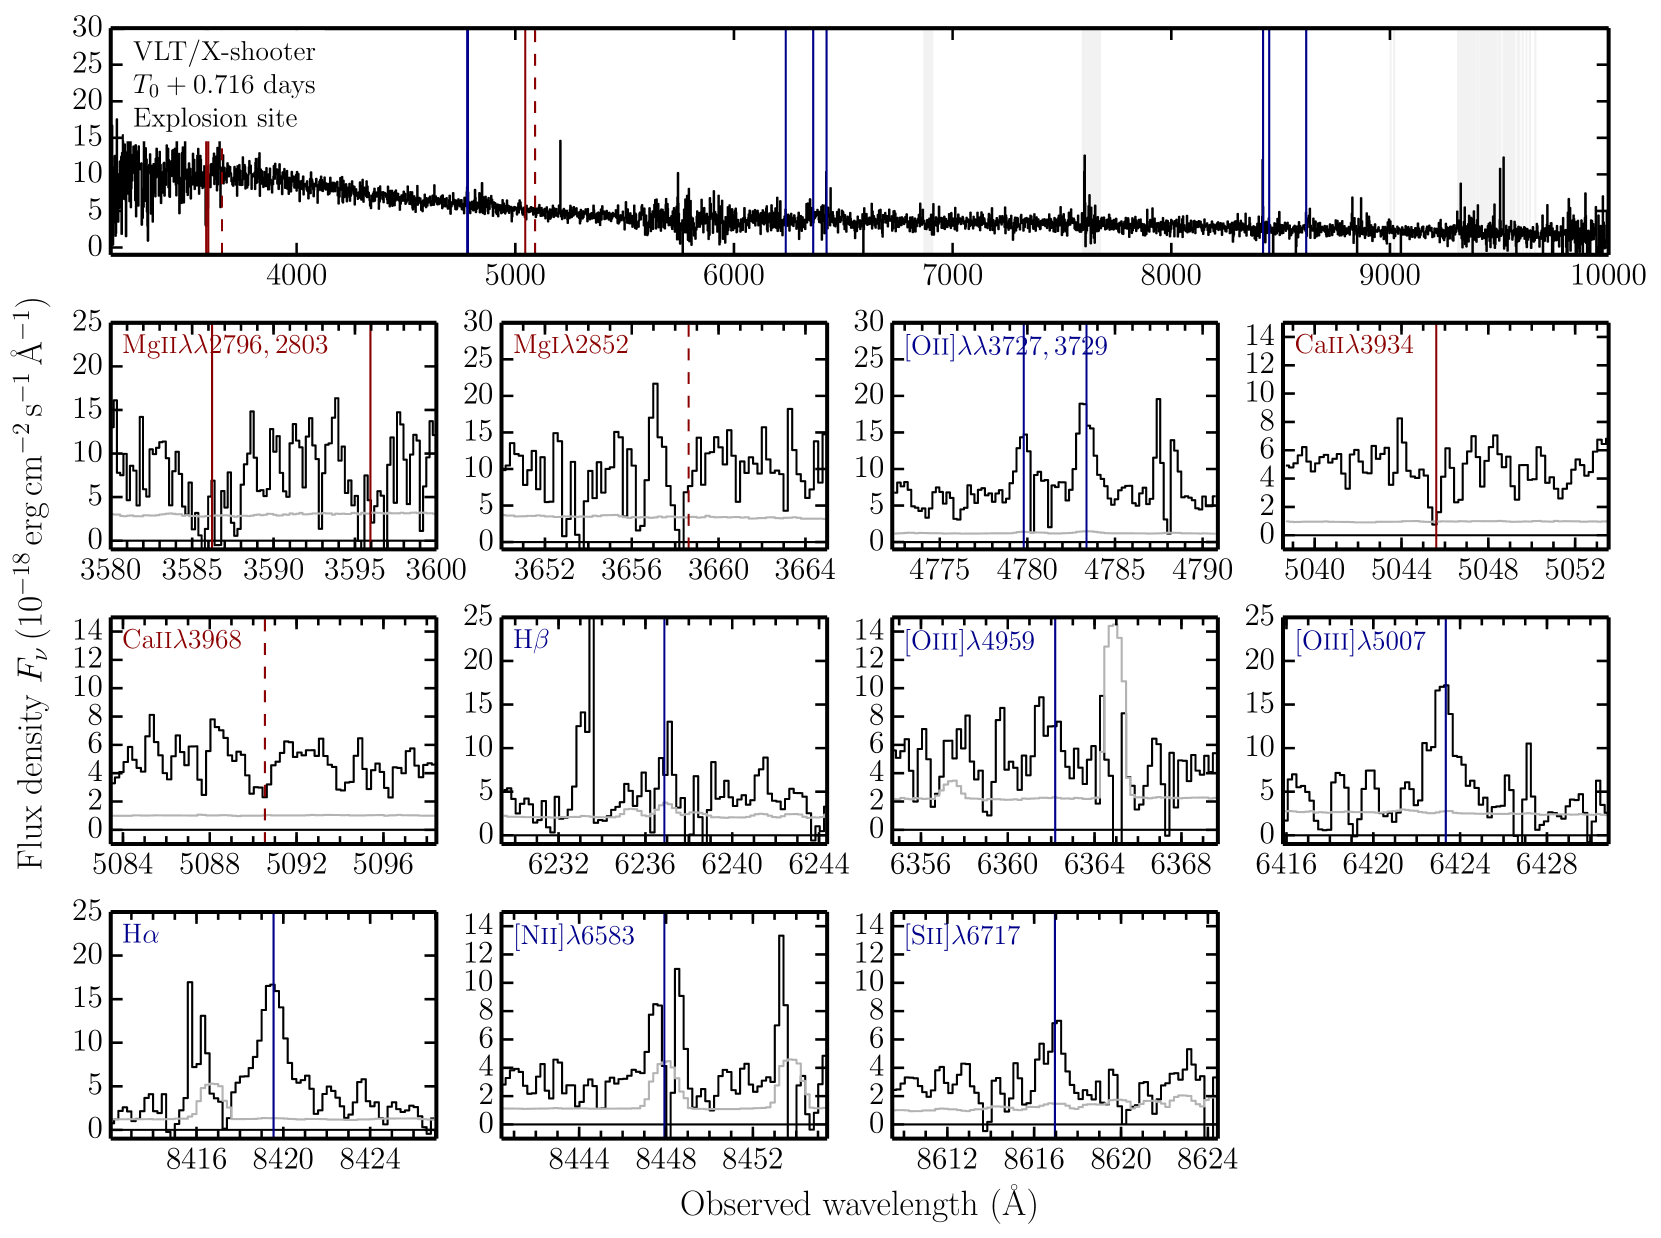
The X-shooter spectrum, obtained on 23 April (17.2 hours post burst; see Fig. 16), exhibits two absorption lines, which we identify as Mg ii2796,2803 (see Table 18). After applying the heliocentric correction, we measure a mean absorption-line redshift of (the error denotes the standard error of the mean), refining the redshift measurements of Schulze et al. (2012b) and Tanvir et al. (2012).
Both lines lie in a rather noisy part of the spectrum. To measure their equivalent widths, we rebinned the spectrum by a factor of two to increase the S/N (i.e. a wavelength binning of 0.4 Å), and fixed the aperture size for the weaker Mg ii line to (the FWHM of the Mg ii2796 absorption line). Their rest-frame EWs are listed in Table 18. The observed line ratio of is not well constrained. It is consistent with the theoretical expected line ratio for an optically thin line but also for a saturated line. Assuming the weak line regime, we can place a lower limit of on the Mg ii column density. When Mg ii is detected, three further absorption lines are usually detected at longer wavelengths, as well: Mg i2852 and Ca ii3934,3969. Only Ca ii3934 is detected at c.l. To place limits on their rest-frame EWs, we measure the noise within an aperture of at the wavelength of each line. Table 18 displays their derived upper limits. We caution that Mg ii absorption lines can be broader than other absorption lines, hence our upper limits might not be very stringent.
We also detect several emission lines summarised in Table 18 and shown in Fig. 16 at a common redshift of , consistent with the absorption line redshift within errors. Their fluxes were measured through direct integration. From these measurements we derive key diagnostics of H ii regions, such as extinction, SFR, and metallicity. Balmer lines are a good diagnostic for determining the level of extinction in H ii regions. Their line ratio is purely determined by atomic constants. The observed limit the H/H flux ratio of is consistent with the expected value of 2.76 for negligible extinction, assuming case B recombination. Since we have no indication otherwise, we use as a working hypothesis. Knowing that, the SFR is as measured from H using the relation in Kennicutt (1998) and correcting for a Chabrier initial mass function (IMF; Chabrier et al. 2000; Förster Schreiber et al. 2009). Since H is only marginally detected, we use the N2 diagnostic by Pettini & Pagel (2004) to measure the metallicity. This oxygen abundance of corresponds to a very high metallicity of . The systematic error of this indicator is 0.18 dex Pettini & Pagel (2004).
4.2 Host Galaxy
4.2.1 Emission line diagnostics
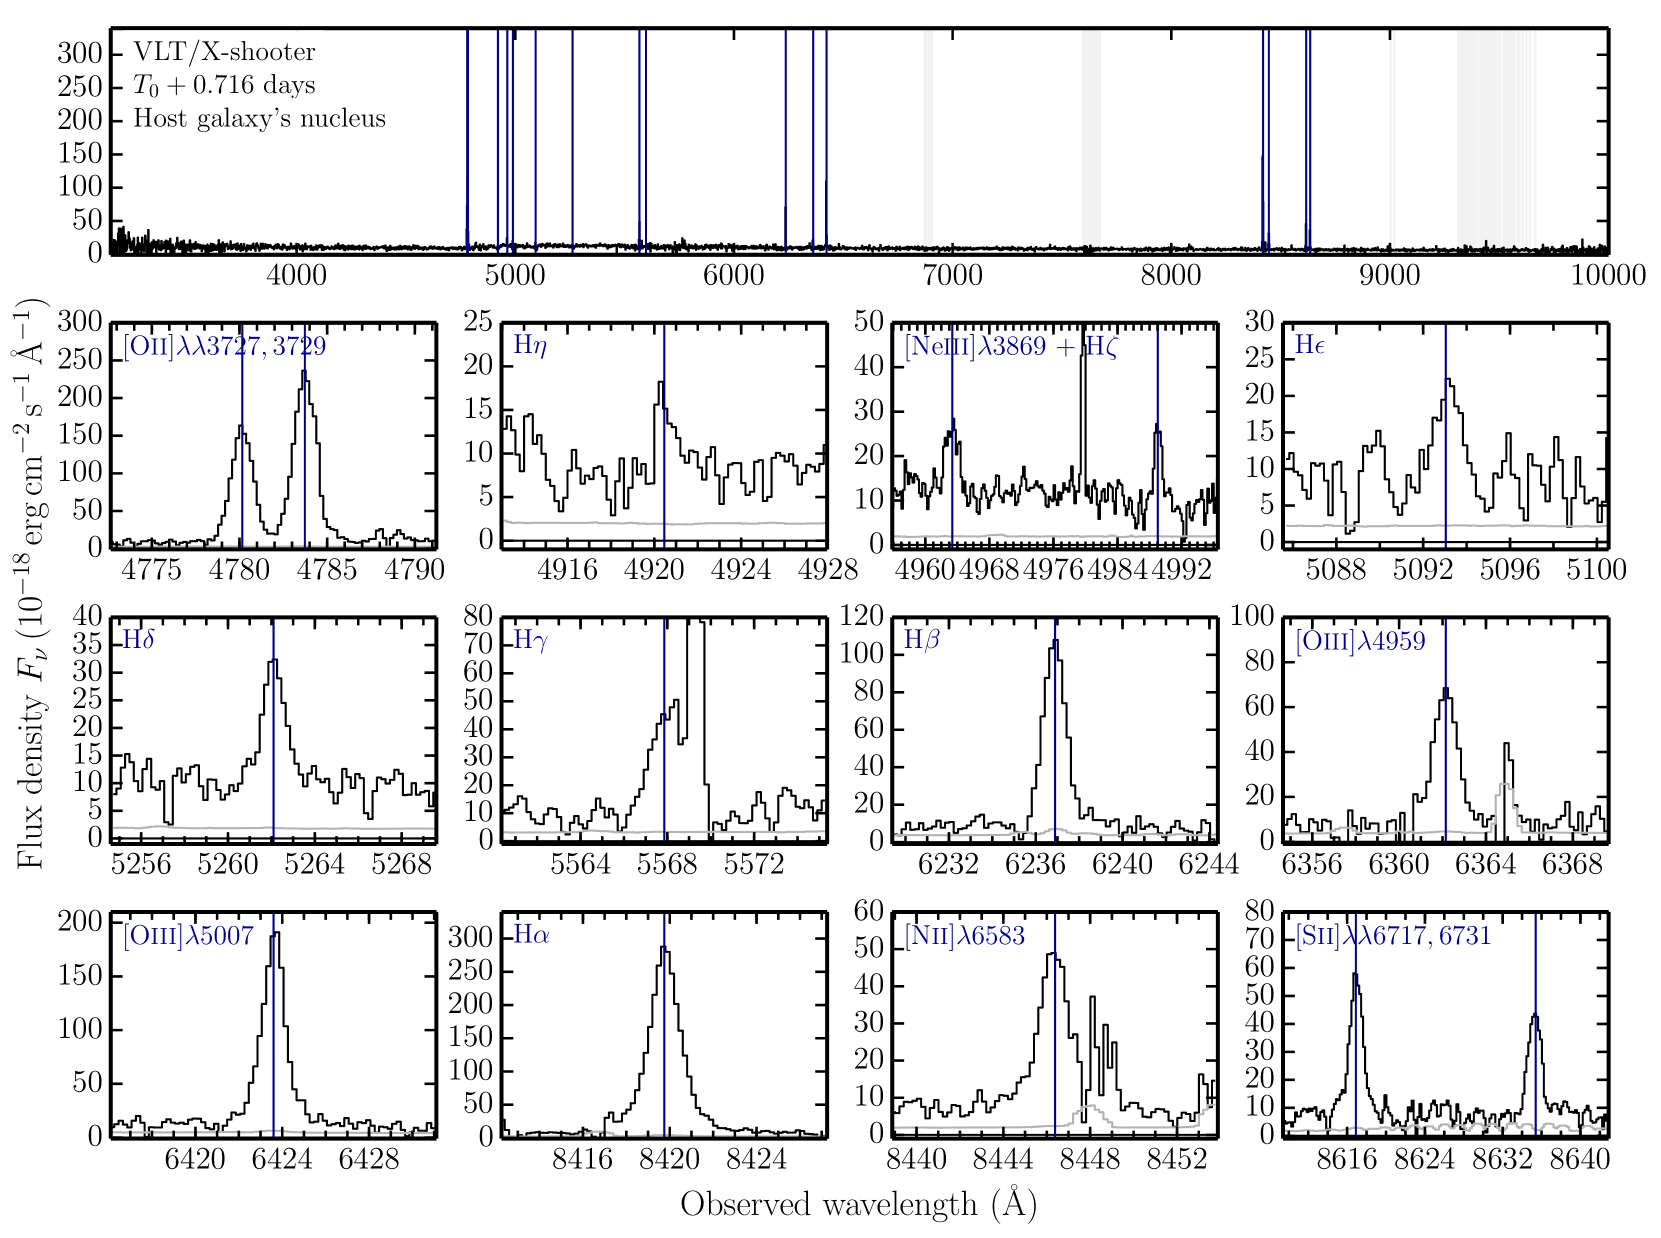
The X-shooter spectrum of the host galaxy’s nucleus (obtained 0.7 days after the GRB; see Fig. 17) shows no absorption but a large number of emission lines at a common redshift of , listed in Table 18. Their fluxes were measured in the same fashion as at the explosion site.
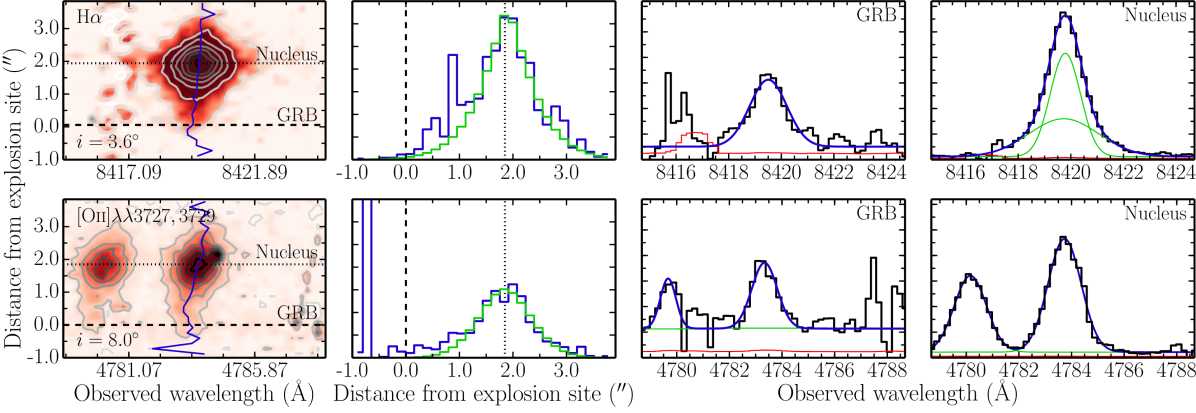
Interestingly, the H emission line is significantly broader than any other emission line in the spectrum, i.e. Å but Å. To elucidate the origin of the broadening, we followed Chatzopoulos et al. (2011, and references therein) and assumed three distinct models: a) thermal broadening, b) single Thompson scattering of free electrons, and c) multiple scattering of hot free electrons. In the first scenario the proper motion of atoms leads to broadening that results in a Gaussian-shaped line profile. Since the flux of an emission line stems from the total flux of all star-forming regions, we additionally assume that there are two velocity components. The second is typical for a broad-lined region in an AGN, producing exponential line profiles (, where is the Doppler shift from the line centre and is the velocity dispersion). The third describes dense media and produces Lorentzian line profiles. The top right panel in Fig. 7 shows the H emission line together with the best fit model. The best fit model consists of two Gaussians centred at identical wavelengths ( and Å), whose FWHMs are () and Å (), and amplitudes of and , respectively. The width of the narrow component is consistent with the width of the other lines.
To check for AGN contribution, we put the integrated line measurements of H H, N ii6584, and O iii5007 in the BTP diagnostic plot (Fig. 15; Baldwin et al. 1981). The emission lines ratios are fully consistent with being due to star-formation. Knowing that, we use the Balmer decrements to to measure the extinction. The Balmer decrements of the narrow component between H, H, H, and H are all consistent with negligible dust extinction. However, we detect no significant flux from the broader component at the position of H to constrain its extinction. The inferred SFRs (computed in the same way as for the explosion site) are: and for the narrow and broad component, respectively. The N2 metallicity indicator is calibrated on integrated measurements. Therefore, we measure an integrated oxygen abundance of . The metallicity of is a bit lower than of the explosion site but they are consistent with each other within .
Levesque et al. (2012) carried out an independent study of the emission-line properties of the explosion site, the curved bridge connecting the galaxy’s nucleus with the explosion site (Fig. 1), and the host’s nucleus using Magellan’s low-resolution LDSS3 spectrograph with two different position angles ( and ). Their line measurements fundamentally deviate from our measurements. Specifically, their values of the radially extended emission lines H and the [O ii] doublet are larger by 47% and , respectively,191919The spectral resolution in Levesque et al. (2012) is not sufficient to resolve the [O ii] doublet. Their reported [O ii]3727 should rather refer to the flux of the doublet. of H and of [O iii] by 118–184%, but that of [N iii] agrees with our measurement. At the explosion site their measurements for the [O ii] doublet are by a factor of 15.8 larger, for H by a factor of 5.2, and [O iii] by a factor of 6 but that of [N iii] by a factor of . The differences might be partly instrumental, because LDSS3 does not have an atmospheric dispersion corrector. Another reason is how they extracted the 1-D spectra. They used a fixed aperture of (the plate scale being 019/px). We, in contrast, based the aperture size on the FWHM of the spectral PSF of the galaxy nucleus and the explosion site, i.e. FWHM(nucleus)=134 and FWHM(GRB)=086 with the plate scale being 015/px. As described in 2.1, we also ensured absolute flux-calibration and checked for differential flux losses by scaling the explosion site spectrum to the brightness of the optical transient at that epoch and that of the galaxy nucleus to the brightness of the host galaxy. Levesque et al. (2012) only applied a relative flux calibration, which can be affected by (differential) flux losses. Furthermore, comparing the emission-line profiles from their spectra with their actual line measurements and uncertainties, e.g. for H, casts doubts on their reported values and on their inferences.
We would like to point out that two of their results are in conflict with ours, which are based on higher S/N and higher spectral-resolution data. Firstly, the fact that their spectral resolution was not sufficient lead them conclude the presence of a non-negligible amount of reddening at the galaxy’s nucleus of . Our data revealed that there are two dominant populations of star-forming regions at the nucleus. After accounting for that, there are no indications for dust reddening. They also argue for a dust reddening at the explosion site (), which we can rule out. This in return significantly overestimates their SFR measurements: Levesque et al. (2012) , our total measurement . As we will show in the following section, the SED fit of the host galaxy is in full agreement with our spectroscopy results, but in conflict with Levesque et al. (2012). Secondly, our data does not show any evidence for asymmetries in the emission line profiles (see Fig. 7, 16 and 17), in contrast to Levesque et al. (2012). The nominal values for the skewness parameter are: 0.06–0.21 with a significance of at the explosion site and –0.1 with a significance of at the galaxy’s nucleus.
4.2.2 Morphology and SED
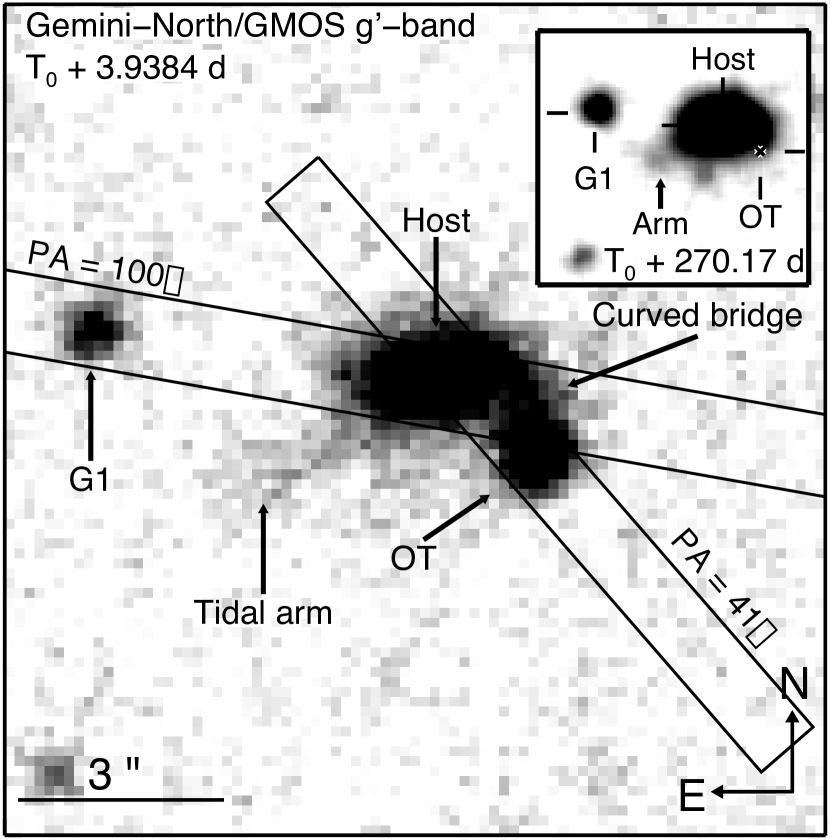
The X-shooter spectrum from 2012 April 23 (; Fig. 1) reveals that the most prominent nebular lines, i.e. the [O ii] doublet and H, extend from the galaxy’s nucleus to the explosion site and slightly beyond (see Fig. 7). To obtain a better understanding of the peculiarity of the explosion site and the host morphology, we extracted their cross-dispersion profiles by fitting each row with a Gaussian (i.e. slicing the galaxy in chunks of , which is equivalent to an area of at ). The largest fluxes are recorded at the galaxy’s nucleus (second column in Fig. 7), while the flux at GRB site is very low. Since both lines of sights are not affected by reddening in the host galaxy, the difference in H flux directly translates into a SFR difference, i.e the explosion site does not show an enhanced SFR with respect to its surroundings and the nucleus. A fit of the cross-dispersion profiles with a Sersic function (column 2 in Fig. 7) reveals an excess from the nucleus towards the GRB site. The excess in [O ii] is more diffuse and extends to larger galactocentric radii. A possible explanation could be that this nebular line is in general less tightly correlated with star-formation and affected by differences in ionisation, metallicity, and dust content (for a detailed discussion see e.g. Kewley et al. 2004). We also note that the 2-D profiles are slightly slanted. We measure a velocity difference between the galaxy’s nucleus and the explosion site of 7 and at H and [O ii], respectively. Strictly speaking these are lower limits because this X-shooter spectrum does not fully cover the nucleus.
An image of the host galaxy obtained 3.6 days after the explosion, shown in Fig. 1, reveals a curved bridge of emission connecting the transient with the host. The curved bridge was also covered by the slit of the X-shooter afterglow spectrum from 2013 April 23 (Fig. 7). Even there stars are formed at a rate that is in between that of the galaxy nucleus and the explosion site. The GRB could therefore have occurred either in a morphologically disturbed/irregular galaxy, within an interacting companion, or a spiral arm (however no counter arm is visible on the far side of the galaxy).
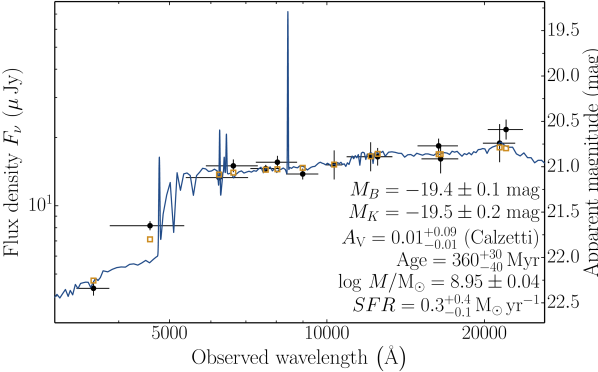
Table 21 lists the brightness of the GRB host galaxy from 360 to 2140 nm. We modelled the SED with Le Phare (Arnouts et al. 1999; Ilbert et al. 2006),202020http://www.cfht.hawaii.edu/~arnouts/LEPHARE using a grid of galaxy templates based on Bruzual & Charlot (2003) stellar population-synthesis models with the Chabrier IMF and a Calzetti dust attenuation curve (Calzetti et al. 2000). For a description of the galaxy templates, physical parameters of the galaxy fitting and their error estimation, we refer to Krühler et al. (2011a). To account for zeropoint offsets in the cross calibration and absolute flux scale, a systematic error contribution of 0.05 mag was added in quadrature to the uncertainty introduced by photon noise. Figure 8 displays the observed host SED and its best fit. The observed SED is best described by a low-mass, barely-extinguished star-forming galaxy with a very young starburst (see Table 25). The extracted attenuation and SFR are consistent with results from emission-line diagnostics.
| Filter | Brightness (mag) | |
|---|---|---|
| 357.88 | ||
| 458.98 | ||
| 621.96 | ||
| 662.30 | ||
| 764.01 | ||
| 804.08 | ||
| 898.93 | ||
| 1032.28 | ||
| 1212.41 | ||
| 1250.24 | ||
| 1635.35 | ||
| 1649.59 | ||
| 2138.97 | ||
| 2200.45 |
4.3 GRB host galaxy environment
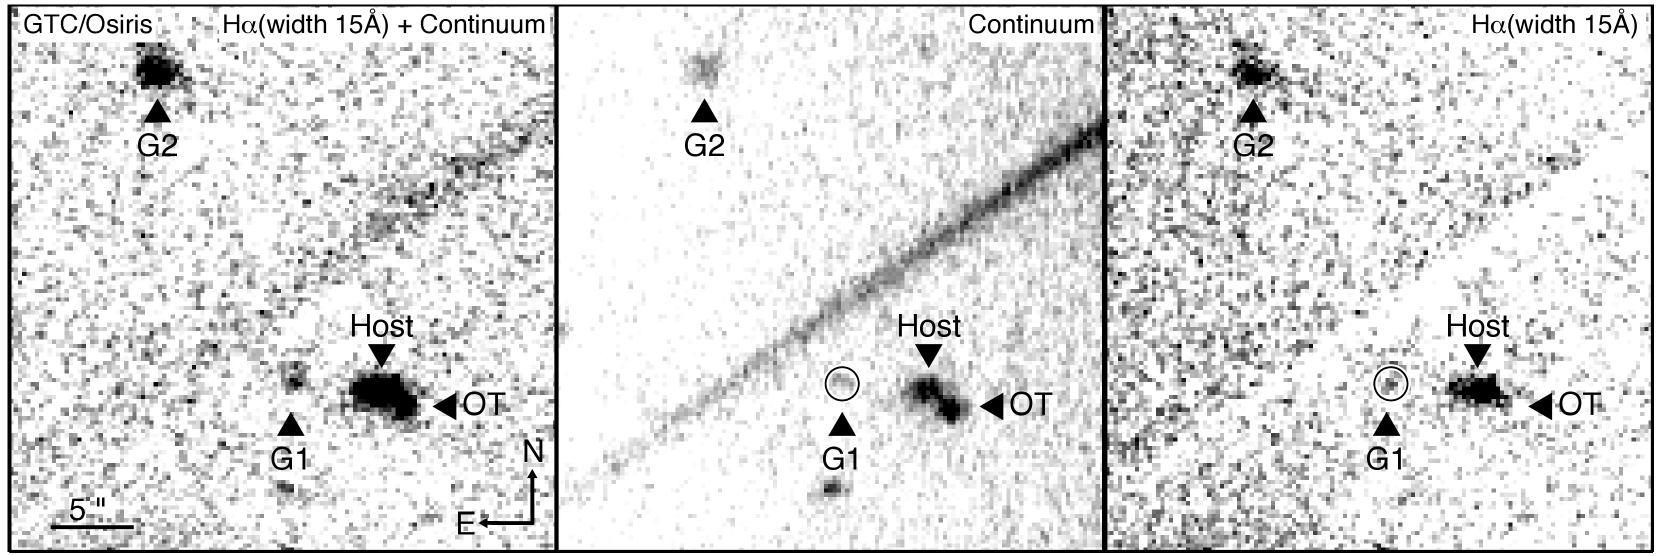
In the previous section we briefly mentioned the possibility that the true host could be a smaller galaxy interacting/merging with the galaxy. To explore this scenario further, we studied the nature of other objects in the vicinity of the GRB to find evidence for a galaxy over-density or galaxy interaction. Our GTC spectrum from 2012 April 25 elucidated that object G1 is at the same redshift as the GRB (; Fig. 1, 10, Table 6). The angular distance of 71 corresponds to a projected distance of 28.7 kpc at from the host galaxy’s nucleus. Intriguingly, we detect a curved arm of emission, though not fully recovered, that connects G1 with the GRB host in our deep Gemini and Liverpool Telescope images (Fig. 1). The blue colour of the tidal arm points to recent star formation. Together with G1’s blue colour, we have compelling evidence that both galaxies are interacting. This could be an indication that the arm connecting the host’s nucleus with the GRB site is not a spiral arm but another tidal arm due to interaction of the galaxy with another galaxy. Deep HST observations are needed to answer this question.
| Galaxy | R.A. (J2000) | Dec. (J2000) | projected Distance (kpc) |
|---|---|---|---|
| Host | 09:07:38.5 | +14:01:08.46 | 7.3 |
| G1 | 09:07:38.9 | +14:01:09.12 | 28.7 |
| G2 | 09:07:39.4 | +14:01:27.83 | 107.8 |
| G3 | 09:07:42.9 | +14:00:15.40 | 355.8 |
To map the star-formation activity inside the host galaxy and identify more galaxies at the GRB’s redshift up to distances of hundreds of kpc, we acquired a deep image with the tuneable filters ( Å) centred at H at with the GTC 25.5 days after the GRB. Figure 9 shows a -wide post stamp. The left panel was obtained with the 15 Å wide tuneable filter, i.e. it contains the emission from the H line and the continuum emission. The continuum, displayed in the middle panel, was imaged with a broad-band filter centred at 8020 Å (width 513 Å) that does not cover H. The SN continuum is not highly variable, neither in the spectral range of the broadband filter nor at H (Fig. 4); the same is true for the host galaxy (Fig. 8). Hence, the difference image of both observations shows the pure H emission (right panel).
We detect four galaxy candidates that have emission consistent with H at (Fig. 9, Table 6). We identify the closest one, located at 7.8 kpc of the GRB, as the host. The galaxy G1 (23 kpc from the centre of the host galaxy), already identified with the GTC spectrum from 25 April, is a satellite galaxy. The galaxies G2 and G3 (not shown in Fig. 9) could be members of the same galaxy group, however a spectrum or an additional observation tuned to the wavelength of another emission line are needed for confirmation.
5 Discussion
5.1 SN 2012bz
In Sect. 3.1 and 3.3, we presented the properties of the GRB-SN. The initial UV/optical emission until 10 ks is dominated by the thermal emission of the cooling stellar envelope after the shock break-out. About 1.4 hours after the GRB, the stellar envelope had a temperature of 16 eV and a radius of . By modelling the radioactively powered light curve we obtained: , and , and when the NIR emission is included, the nickel and ejecta masses to increased by 45 and 25%, respectively, and the kinetic energy by 25%. These values are among the highest recorded values for GRB-SNe (Cano 2013). We computed the intrinsic -band luminosity through direct integration over the SN spectrum. SN 2012bz has a absolute -band magnitude of mag, making it 0.3 mag more luminous than SN 1998bw. The phenomenological modelling of the SN light curve gave a similar value. In the band that overlaps with the rest-frame band we inferred the SN to be 0.3 mag brighter than SN 1998bw but a slightly faster evolution. In the following we will discuss the SN properties in the context of other GRB-SNe.
5.1.1 SN 2012bz in the context of other GRB-SNe
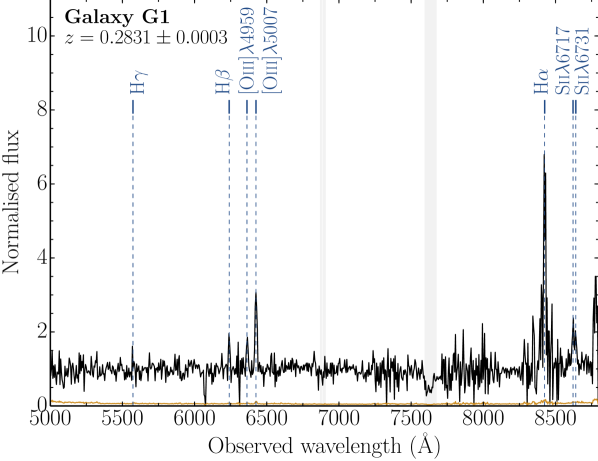
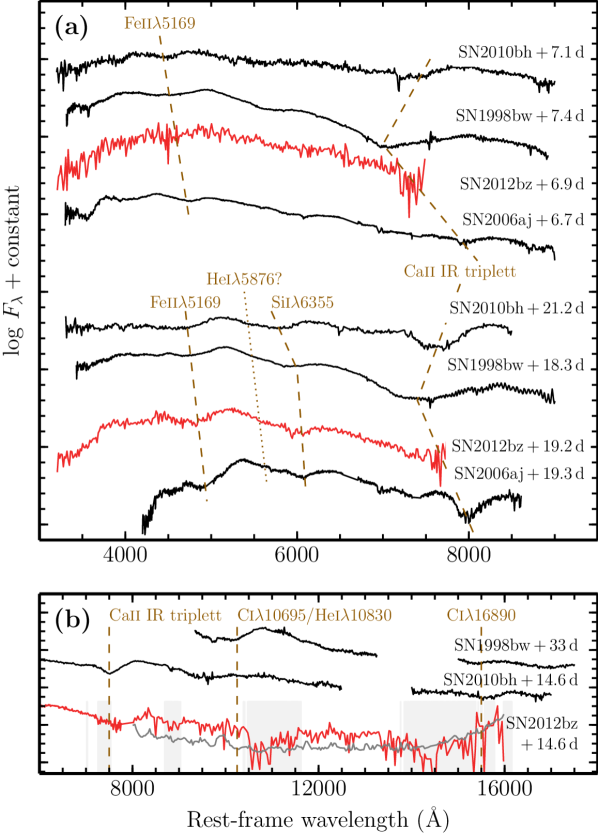
Figure 11 shows the comparison of SN 2012bz at two different phases for which simultaneous spectra of SNe 1998bw, 2006aj and 2010bh are available, all of which accompanied low- GRBs (Patat et al. 2001; Pian et al. 2006; Bufano et al. 2012). Overall, the spectra are very similar and show the same features, although line strengths and expansion velocities vary from object to object. We have illustrated this by annotating the main features as they have been identified in the past (e.g. Patat et al. 2001): Fe ii, usually visible between 4500–5000 Å; Si ii, around 5600–6100 Å; the Ca ii IR triplet (that for SN 2012bz is in a noisy part of the spectrum between the VIS and the NIR arms; see lower panel); and possibly He i, at around 5500 Å (e.g. Bufano et al. 2012). We stress that these SNe have very large explosion velocities and that their broad lines are likely the result of blending, hampering the identification of the dominating line species producing the absorption feature.
Nevertheless, spectra of different GRB-SNe displayed in Fig. 11 are remarkably similar, reinforcing the idea that the nature of these blends, whatever it is, is the same for all GRB-SNe, pointing towards similar explosions. Differences do however exist in the expansion velocities (see Fig. 5). The spectra are displayed in an ‘expansion velocity sequence’ going from the ‘fastest’ (SN 2010bh; see also the discussion in Chornock et al. 2010; Bufano et al. 2012) to the ‘slowest’ (SN 2006aj). This is at least true for the Fe ii and Si ii lines and, in that respect, SN 2012bz seems intermediate and more similar to SN 1998bw. The Ca IR triplet shows a different velocity behaviour, not correlated with the one determined by the other elements, and SN 1998bw is clearly faster at all phases.
It is interesting to point out that the notch that has been possibly identified as He i by Bufano et al. (2012) (Fig. 11 panel a) is also visible in SN 2012bz, and as a matter of fact in most optical GRB-SNe spectra with sufficient S/N to the left of the main Si ii trough. A powerful diagnostic to test the presence of He i is NIR spectroscopy (Patat et al. 2001; Bufano et al. 2012). Our X-shooter NIR spectra are unfortunately of low S/N and for this reason we focus our analysis only on the one obtained at maximum light (Fig. 11 lower panel). Still, however, this spectrum is dominated by a weak continuum, while most prominent features are located in unfavourable regions (the error spectrum is displayed). For comparison, we have also plotted an X-shooter spectrum of SN 2010bh obtained at a similar phase (Bufano et al. 2012). SN 1998bw does not have a contemporaneous spectrum but we show the one obtained at , where the identified features are more clearly visible (Patat et al. 2001). Both the locations where one would expect to see or are located in very noisy atmospheric regions of our spectra, at the redshift of SN 2012bz, preventing us from drawing any meaningful conclusion.
5.1.2 A Philips-type relation for GRB-SNe?
GRB-SN spectroscopy is in most cases limited to , the redshift
domain that is observationally dominated by low- GRBs. At higher redshifts, the
detection of a GRB-SNe mostly depends on the detection of late red bumps,
that are modelled with a SN1998bw template. In the past years, the sample of GRBs
with detected late red bumps has been substantially increased
(Ferrero et al. 2006; Thöne et al. 2011; Cano 2013). We will use these samples to
compare the luminosity factor and the stretch factor of low- and high-
GRBs. Among these, we only select those with meaningful values, i.e. GRB-SN that
were ranked better than ”C” in Hjorth & Bloom (2012).222222For an updated list see:
http://www.dark-cosmology.dk/GRBSN/GRB-SN_Table.html .
Furthermore, most values were only obtained in one band, mostly in the observed
band. Since GRB-SNe have up to now been identified between and , the observed band probes different regions in the rest-frame. GRB-SNe
emit most of its energy in the rest-frame band. Therefore, we only use those values
where the observed bandpass partly overlaps with the rest-frame band (in the
following called quasi band).
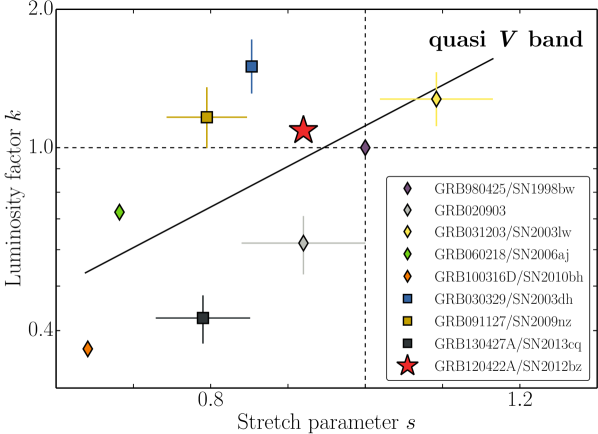
Figure 12 displays the parameter space of the nine GRB-SNe that fulfilled both criteria. Supernovae of low- and high- GRBs occupy the same parameter space. Intriguingly, there is a trend between the luminosity and the stretch factor.232323Such a correlation was searched for GRB-SNe in Ferrero et al. (2006) and Cano et al. (2011a), but not found because all data were used disregarding which rest-frame waveband they probed, or on much less data that also did not probe the same rest-frame waveband (Stanek et al. 2005). This is in line with recent findings by Hjorth (2013), who independently reported on a correlation between the peak magnitude and the width of the peak. To estimate the correlation degree and significance we applied a Monte Carlo technique. In this method, every data point is represented by a 2-D Gaussian, where the centre of peaks in each dimension are the parameter estimates, and the corresponding errors are the width of the distributions. From these, we construct 30000 resamples of the observed data sets, each of which is obtained by a random sampling with replacement from the original data set. Note, SN 1998bw was excluded since it is the reference value. For each of these data sets we do a linear regression fit, using the model , and determine the correlation coefficients. The best fit values and their uncertainties are given by the centre and the width of the distribution functions. The best fit values are: , . The Pearson’s correlation coefficient, Spearman’s rank, and Kendal’s give significances of . Despite the correlation being statistically not significant, the trend is similar to the Phillips relation (Phillips 1993) that builds the foundation for using Type Ia SNe as standard candles in cosmology.
The degree of correlation is affected by several systematics. First of all, none of the displayed values represent the true rest-frame band. To obtain the rest-frame band values a more sophisticated approach is needed, which is beyond the scope of this paper. Systematic differences can arise from the fact that all GRB-SNe are broad-lined Type Ic SNe, but the evolution and the strength of absorption features depend on the specific GRB-SN (see Fig. 5, 11), which we think could be responsible for of the observed scatter. Uncertainties in the line-of-sight extinction are the second largest source of error affecting but not . For instance, the afterglow data of GRB 020903 are not good enough to build a SED for estimating the line-of-sight extinction. The extinction towards GRB 060218/SN 2006aj and GRB 100316D/SN 2010dh are very high and uncertain (Cano et al. 2011a; Bufano et al. 2012; Olivares E. et al. 2012). Furthermore, there are different approaches how a 1998bw-template light curve for specific band is constructed. Specifically, for GRB120422A we measure a difference of 0.10 mag in the observed -band peak magnitude between the methods by Zeh et al. (2004) and Cano (2013). The host contribution was taken into account either by image subtraction, subtraction of the nominal host flux, or by adding the host magnitude as a free parameter to the light curve fit for all GRB-SNe, except for GRB 130427A. Last but not least, the SN fit depends on how well the afterglow component is modelled. This affects as well as .
5.2 The afterglow of GRB 120422A
Our analysis in Sect. 3.2 reveals: i) the optical (redward of band) and the NIR emission of the transient accompanying GRB 120422A to be afterglow-dominated between and , ii) the X-ray emission to be consistent with synchrotron radiation at all times (except for some small deviations within the first 200 s after the burst; Starling et al. 2012), iii) an initial Lorentz factor of , iv) an afterglow peak luminosity-density of , and v) a constant-density circumburst medium. Like in the SN discussion, we will put the afterglow in context with low and high- GRBs.
Finding a constant-density medium around a massive star is not so surprising. Schulze et al. (2011) showed that most GRBs are found in constant-density-medium environments. Simulations by van Marle et al. (2006) showed that a complex mass-loss history or differences in the ram pressure can stall a free-stellar-wind density profile closer to the progenitor star and make the disturbed density profile look like a constant density medium.
Measurements of the initial Lorentz factor are limited to a small number of bursts with rapid follow-up. Typical values are about few hundred for high- GRBs (Molinari et al. 2007; Ferrero et al. 2009; Greiner et al. 2009; Perley et al. 2011). For low- GRBs, measurements exists for 060218 (Soderberg et al. 2006a) and 100316D (Margutti et al. 2013). For both bursts, the inferred Lorentz factor were –2.3 at 1 (GRB 100316D) and 5 days (GRB 060218) after the burst. These measurements were obtained when the blast-wave had already decelerated. According to Zhang & Mészáros (2004, and references therein), a blast-wave’s Lorentz factor evolves as and for a constant-density and a free-stellar-wind ambient density profile during the deceleration phase, respectively. Given the time when the Lorentz factors were obtained, the initial Lorentz factors were at most one order of magnitude larger, still smaller than that of GRB 120422A. This re-assures us in the identification of this phase transition and also illustrates the decrease in the blast-wave’s velocity from high- to low- GRBs.
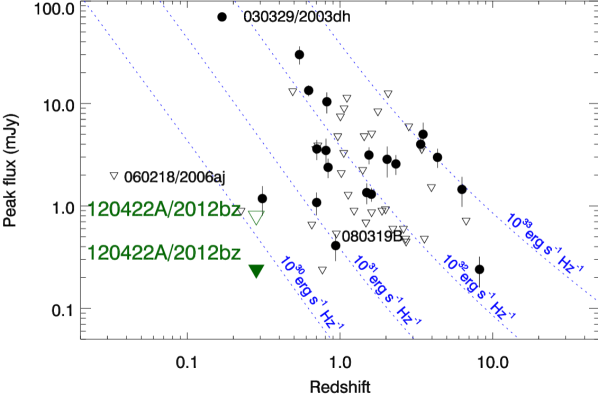
As mentioned in Sect. 3.2.3, the peak of an afterglow synchrotron spectrum crosses the cm to sub-mm range within the first week. During the first week an afterglow can also exhibit variability that can affect the peak flux and value of the injection frequency. Several sub-mm observations during the first week after the burst can be used as proxy for the peak luminosity without the need for modelling the broad-band afterglow (de Ugarte Postigo et al. 2012b). Figure 13 displays the inferred sub-mm peak fluxes as a function of redshift. The observed limit on GRB 120422A’s peak flux-density from the sub-mm/mm observations and the limit from the SED modelling point to faint afterglow. The limit of is exceptionally deep for high- GRBs. For example, the afterglow of GRB 030329, a burst with spectroscopically confirmed SN and , had a -times larger peak luminosity density and the afterglow of GRB 080319B, a burst with photometric evidence for a SN (Tanvir et al. 2010), was about -times more luminous than 120422A. Intriguingly, the peak luminosity density is in the expected range of low- GRBs, such as GRB 060218.
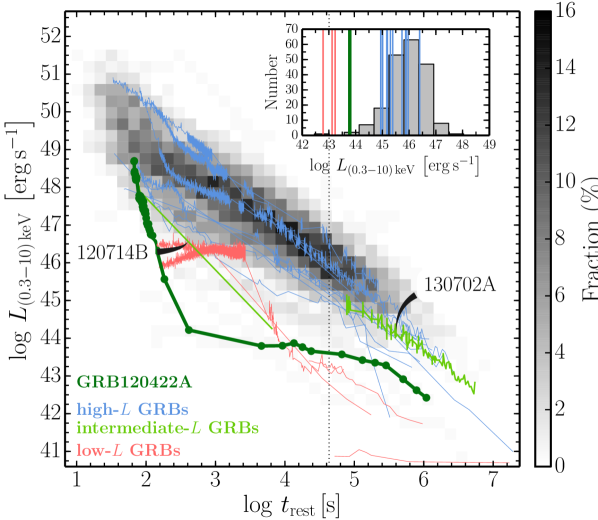
Current sub-mm observations are limited to a small number of GRBs ( of all GRBs) and have only been successful in detecting bright afterglows. The number of Swift GRBs with measured redshift is , i.e. -times larger than the sub-mm/radio recovery rate and almost all GRBs with redshift information have a detected X-ray afterglow. de Ugarte Postigo et al. (2012b) reported on the presence of a correlation between the sub-mm flux density and the X-ray flux density at 0.5 days, as expected if they are co-spatial. Hence, we can re-address the question on the faintness of GRB 120422A’s afterglow by exploring the X-ray luminosity distribution.
We download the 0.3–10-keV light curves of long Swift GRBs (i.e. ) with detected X-ray afterglow (requiring at least two X-ray detections) and known redshift that were discovered between December 2004 and June 2013 from the Swift Burst Analyser (Evans et al. 2010). Because of the small number of low- GRBs in the Swift sample, we include all pre-Swift-era GRBs with detected supernova, which are mostly low- GRBs. We retrieve their light curves from the BeppoSAX GRB Afterglow Database (de Pasquale et al. 2006; Gendre et al. 2006).242424http://www.asdc.asi.it/GRBase/ The differences in the observed bandpasses were taken into account to compute the X-ray luminosity in the 0.3–10-keV bandpass. In total, GRBs fulfil both criteria. Following Hogg et al. (2002) and assuming a top-hat response function, the luminosity between 0.3 and 10 keV is given by
where is the luminosity distance and is the spectral slope. The Burst Analyser provides information on the spectral slope for each data point, inferred from hardness ratio (Evans et al. 2010). Sometimes the given slope is highly variable or has unphysical values (for limitations of the Burst Analyser see Evans et al. 2010), especially at late times () when statistics are poor. To minimise the impact of such deviations, we set the spectral slope to the median late-time spectral slope (i.e. ) if deviations are and if the slope is larger than . For pre-Swift GRBs only the time-average spectral slope is available. Next we resampled the rest-frame X-ray light-curves to a grid defined by the observed luminosities of and the time interval spanned by all X-ray afterglows, and interpolated between adjacent data points in case of orbit gaps. The resulting luminosity distribution as a function of rest-frame time is shown in Fig. 14 (the grey shaded area). Highlighted in this plot are GRBs with detected SNe, colour-coded according to their time-averaged -ray luminosity.
The inset in Fig. 14 shows the luminosity distribution of 196 X-ray afterglows at 0.5 days after the burst. High- GRBs with detected SNe occupy the same parameter space like all high- for which no SN search was feasible. This supports the discovery made by Xu et al. (2013) that even bursts with the largest energy releases during the prompt emission are accompanied by SNe (see also Tanvir et al. 2010). Low- and intermediate- GRBs lie at the very faint end of the luminosity distribution. Specifically, GRB 120422A is 2.1 dex fainter than the mean value, while the afterglows of the brightest low- GRBs are by a factor of only a few less luminous than that of GRB 120422A.
5.3 The host galaxy and galaxy environment
Our analysis in Sect. 4 revealed that i) the extinction at the explosion site as well as the galaxy nucleus is negligible, ii) there are two populations of H ii regions in the nucleus, iii) the GRB appears to have not occurred in a region of enhanced SFR, iv) the metallicities of the nucleus and the explosion site are high and identical to within errors, v) the host galaxy is interacting with a galaxy at a projected distance of 23 kpc, and vi) the host is possibly embedded in a galaxy group. First we will discuss the GRB environment in the context of all GRBs, then the host galaxy and finally the host environment.
The GRB environment appears to be rather average. The lower limit on the Mg ii column density of is dex lower than that of an average GRB environment (Christensen et al. 2011), but such a low column density was reported for other GRBs before: 050922C (Piranomonte et al. 2008), 121019B (Sparre et al. 2011), and even lower GRBs 070125: (De Cia et al. 2011) and 071003: (Perley et al. 2008). To quantify the integrated absorption-line strength of the interstellar medium in GRB host galaxies, de Ugarte Postigo et al. (2012a) introduced the line-strength parameter () that is derived from detected absorption lines. The observed of is small, but considering the large error, the value is consistent with the mean for GRB environments. In contrast to that, the high metallicity is exceptional (see Christensen et al. 2008; Thöne et al. 2008; Levesque et al. 2011), though the dark GRB 020819A occurred in an even higher-metallicity environment (Levesque et al. 2010b). Moreover, the negligible reddening in conjunction with the very high metallicity is remarkable. A possible reason for this high metallicity could be the limited spatial resolution. For example, based on HST observations Fynbo et al. (2000) showed that the stellar cluster, of which GRB 980425A’s progenitor was part, was very compact (the radius being 2.25 pc) and faint, and at lower spatial resolution it would merge with a much brighter Wolf-Rayet star hosting complex 800 pc away. In contrast, the extracted X-shooter spectrum averages over an area of . We also note that emission-line metallicities average over all star-forming regions along the line-of-sight, not exclusively the GRB explosion site. On the other hand, if the explosion site has indeed such a high metallicity, this might challenge current GRB progenitor models that predict a low- cut-off (Woosley 2012, and references therein).
| Parameter | Host | GHostS | TOUGH |
|---|---|---|---|
| Sample size | 74 | 20 | |
| Redshift | 0.28256 | ||
| … | |||
| … | |||
| … | |||
| … | |||
| Age (Myr) | … | ||
| SFR | … | ||
| 0.6 | … | ||
| Offset (kpc) | 7.3 | … |
To address this peculiarity further, we compare the [O iii]/H vs [N ii]/H line ratios with those of other GRB hosts (see Fig. 15). In addition, we distinguish between spatially-resolved and integrated line measurements. The emission-line ratio of the host’s nucleus is not different from other GRB hosts. All hosts are located in the region that is dominated by H ii regions. Compared to models by Dopita et al. (2006), the observed line ratios always point stellar populations with an age of a few million years and metallicities between 0.05 and , in contrast to the bulk of emission-line galaxies in the SDSS DR9 (Ahn et al. 2012). GRB 120422A’s host is among the most metal-rich GRB hosts. The large uncertainties in the line measurements of the explosion site do not allow to draw a firm conclusion on its peculiarity.
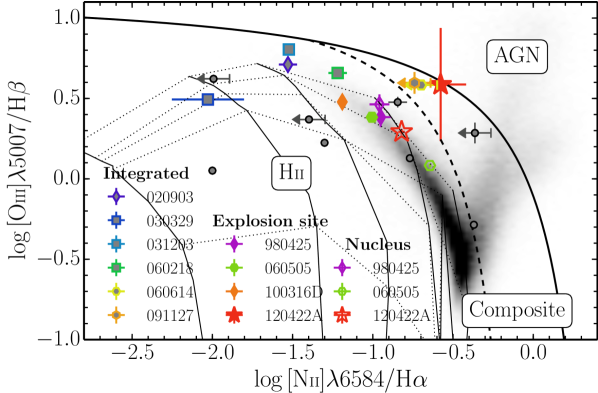
Della Valle et al. (2006a): the SN-less GRB 060614; Hammer et al. (2006): 980425, Han et al. (2010): 990712, 020903, and 030329; Levesque et al. (2010a): 991208, 010921, 050826, and 070612; Levesque et al. (2010b): 020819B; Thöne et al. (2008): the SN-less GRB 060505; Wiersema et al. (2007): 060218; Krühler et al. (2012): 080605A; Vergani et al. (2011): 091127; Levesque et al. (2011): 100316D
Comparing the integrated host properties with GRB samples is not straightforward. Most samples are heterogeneous and biased towards a particular GRB population, e.g. GRBs with negligible reddening or bright afterglows. On the other hand, optically unbiased samples are limited to observations in a few bands, from which only a few host properties can be extracted. Keeping these limitations in mind, we compare 120422A’s host with the GHostS database, built by Savaglio et al. (2009), that contains well-sampled multi-band SEDs and host spectra for a larger number of hosts, and the optically-unbiased, homogeneous GRB host (TOUGH) sample by Hjorth et al. (2012), which is in most cases limited to observations in and bands. Based on recent findings by Perley et al. (2013b) that GRB hosts at are bluer and significantly less massive than higher redshifts, we limit the comparison to hosts at .
Table 25 lists the host properties of 120422A and the median values for both comparison samples. In context of the GHostS sample, GRB 120422A’s host is in the lower half of the luminosity, mass and SFR distribution. Only its very low extinction (0.5 mag less than the GHostS median) in combination with high metallicity are peculiar. We caution that the completeness of both properties is very low. Another peculiarity is the exceptional large distance between the explosion site and the galaxy’s nucleus. The offset of 7.3 kpc is among the largest values reported in Bloom et al. (2002). Based on the optically-unbiased TOUGH sample, a slightly different picture can be drawn. Since only observations in two filters are available for most hosts, we assume that the rest-frame NIR and UV can be approximated by power laws, similar to the approaches in Laskar et al. (2011) and in Schulze et al. (in prep.). We measure a UV luminosity at 1700 Å of and a -band luminosity of (see Table 25). These values are consistent with the ensemble median values.
Observations with the tuneable filters revealed that host is interacting with another galaxy that is at a projected distance of 23 kpc from GRB 120422A host galaxy’s nucleus and that there are possibly two further star-forming galaxies at the same redshift within . In general, little is known about the galaxy environments of GRB host galaxies. Several GRB fields show an increased galaxy density, e.g. GRBs 000301C, 000926 (Fynbo et al. 2002), 011211 (Fynbo et al. 2003), 021004 and 030226 (Jakobsson et al. 2005), 030115 (Levan et al. 2006), and GRB 050820A (Chen 2012), but nearest burst, GRB 980425, does not (Foley et al. 2006). The comparison is also limited due to the lack of information for SN fields.
5.4 The missing link between low- and high- GRBs
The division between low- and high- GRBs is not entirely operational. Both populations have very distinct properties. Low- GRBs are thought to be driven by shock break-outs, producing (quasi-)spherical explosions whose -ray light curves are smooth and single-peaked (Campana et al. 2006; Starling et al. 2011), spectra that can have peak energies of only a few keV (e.g. Campana et al. 2006; Starling et al. 2011, but see Kaneko2007a), and mildly relativistic outflows (; e.g. Soderberg et al. 2006a Margutti et al. 2013). In contrast, high- GRBs are powered by ultra-relativistic collimated outflows with Lorentz factors of a few hundred (Molinari et al. 2007; Ferrero et al. 2009; Greiner et al. 2009; Perley et al. 2011), and -ray light curves that can exhibit variability on the milli-second domain (Bhat et al. 2012). The rate of low- GRBs in the nearby Universe exceeds that of high- GRBs by a factor of 10–1000 (Pian et al. 2006; Guetta & Della Valle 2007; Virgili et al. 2009; Wanderman & Piran 2010). However, a recent work by Lazzati et al. (2012) based on relativistic jet simulations proposed a non-uniform distribution of the central engine’s on-time to account for the differences.
GRB 120422A is one of the very few examples of intermediate-luminosity GRBs. Its -ray light curve exhibits an initial spike (starting at and ending at ; Barthelmy et al. 2012) followed by a weaker and softer extended component (starting at and ending at to ; Barthelmy et al. 2012), as observed in other high- GRBs before (Bostancı et al. 2013). In addition, the X-ray emission is not dominated by thermal emission from the cooling photosphere after the shock break-out, like the low- GRBs 060218 and 100316D (Campana et al. 2006; Nakar & Sari 2012). In contrast, the properties of the longer-lasting transient accompanying the GRB point in a different direction. The blast-wave had a very low initial Lorentz factor of and the produced afterglow had an unprecedentedly low peak luminosity of for a high- GRB. Thanks to the weak afterglow, the signature of the shock break-out was for the first time detected for a non-low- GRB.
The failed-jet model predicts high- GRBs to transition into low- bursts as the jet produced by the central engine gets weaker, e.g. because of a lower kinetic energy in the outflow, a central engine that is active of a shorter period, or a less collimated outflow (Bromberg et al. 2011; Lazzati et al. 2012). According to this model, the weaker a jet, the more it gets decelerated in the stellar envelope until it is choked. Examples for choked jets are the Type Ib/c SNe 2002ap, 2012au (Soderberg et al. 2006b; Milisavljevic et al. 2013; Margutti et al. 2013) and GRB 100316D whose jet barely broke through the stellar cocoon (Margutti et al. 2013). The fact that we do detect the thermal emission from the cooling photosphere after the shock break-out raises the questions of how much energy GRB 120422A’s jet already transferred into the stellar envelope and how much more energy it could lose before getting choked. As coined by Hjorth (2013), GRB 120422A is indeed a transition object between shock-break-out driven low- and high- GRBs that are powered by ultra-relativistic jets.
To fully connect GRBs of low and high luminosities, it has to be shown that even the most luminous bursts () are accompanied by SNe. These very energetic bursts have however been found at redshifts where SN searches are getting unfeasible, i.e. . Serendipitously, one of the most energetic bursts, GRB 130427A, occurred at (Perley et al. 2013b; Xu et al. 2013). During its prompt -ray emission that had a duration of , this burst released ; Maselli et al. 2013). This translates into a time-averaged -ray luminosity of . Thanks to its low redshift, an accompanying broad-lined Type Ic SN was spectroscopically detected with properties similar to those of low- GRBs (Xu et al. 2013, see also Tanvir et al. 2010, who reported on the photometric SN discovery for an almost 1 dex more luminous GRB). In addition, Maselli et al. (2013) showed that its afterglow properties are similar to those of very energetic, high-redshift GRBs, making it a genuine very high- GRB.
Combining the findings on GRBs 120422A and 130427A lets us conclude that low- and high- GRBs are not distinct populations of stellar explosions. They are due to the gravitational collapses of very massive stars and are accompanied by SNe. Their central engines are the same. Only the properties of their prompt emissions and of their afterglows (shock break-out vs. jet dominated) differ, depending on whether the jet can successfully drill through the stellar cocoon. This does not make them disjunct phenomena.
6 Summary and conclusions
We carried out extensive imaging and spectroscopy campaigns to study the intermediate luminosity GRB 120422A that shares properties of low- and high- GRBs. Our detailed analysis focussed on the GRB-SN 2012bz, the GRB afterglow, the host galaxy, and its environment.
We showed that SN 2012bz is the most luminous spectroscopically-confirmed GRB-SN to date, the peak luminosity being . The explosion physics parameters of , , and are among the largest values known to date. However, the exact values highly depend on the NIR contribution. Cano et al. (2011a) showed that the nickel and the ejecta masses and the kinetic energy can be underestimated by 25–45% if the NIR is not included in the modelling of the bolometric light curve. For future GRB-SN studies it is imperative to secure NIR data to place more stringent constraints on GRB progenitor models. As an alternative to a campaign with long wavelength coverage, the method presented in Lyman et al. (2013) would allow to construct the bolometric light curve from two optical light curves with well-determined -corrections.
The spectral sequence of SN covers a time span of days. All spectra are similar to that of other GRB-SNe. Differences exist in the strength of the absorption features and expansion velocities. For the first time, Fe ii5169 was used to trace the evolution of the GRB-SN expansion velocity. The velocities and their evolution are not very different from Si ii measurements. Fe ii5169 has the advantage of being easier to identify and is detectable at earlier times We find an intriguing trend between the peak luminosity and SN stretch factor , similar to the Philips relation. Its significance is poor but several systematics affect the result.
GRB120422A was accompanied by one of the least luminous afterglows detected to date. Its blast-wave expanded with a low initial Lorentz factor of into a constant density medium and produced an very weak afterglow . Thanks to the weak afterglow, we recovered emission from the cooling photosphere after the shock break-out, which was only observed for the low- GRBs 060218 and 100316D. GRB 120422A’s photosphere had a temperature of and a radius of at 1.4 hours after the GRB, typical values of SNe with detected shock break-out signatures. This fundamentally new quality for a non-low- GRB questions whether 120422A is a genuine high- GRB. Considering the properties of the prompt emission and the afterglow makes us conclude that GRB 120422A is the missing link between shock-break-out driven low- and high- GRBs that are powered by an ultra-relativistic jet, hence providing evidence for the failed-jet model for low- GRBs.
The GRB occurred in an almost typical host galaxy. Its close to solar metallicity along with its negligible extinction makes it peculiar. Thanks to the large offset of 7.3 kpc from the nucleus, we perform spatially resolved spectroscopy. Surprisingly, even at the explosion site the metallicity is close to solar, while the SFR is not enhanced with respect to its immediate environment and only 1/10th of that of the galaxy’s nucleus. Based on the N2 indicator we measure at the explosion site. This does not necessarily mean that the GRB-hosting star-forming region had these properties. The X-shooter spectrum was only sensitive to a region of . What needs to be stressed is that emission-line measurements from low-resolution spectra should be taken with caution. Our medium resolution data revealed that the H line resolved in two components. This can lead in low-resolution data to an overestimation of the extinction and SFR.
Our narrowband imaging (width 15 Å) showed that the host is possibly interacting with a galaxy that lies at a projected distance of 23 kpc away. We identified two additional putative galaxy group members. In contrast to previous studies of GRB galaxy environments, tuneable filters allow us to more efficiently identify star-forming galaxies at a GRB’s redshift. In particular, this approach is complementary to SED fitting techniques, which are limited to bright galaxies but not necessarily highly star-forming galaxies. Both approaches are needed to address the long-standing question on the peculiarity of GRB host galaxies and how galaxy interaction affects the production of GRB progenitors at low and high metallicities.
Acknowledgements.
We thank Shri Kulkarni (Caltech) for obtaining the Keck spectrum. SS thanks Tsvi Piran (The Hebrew University, Israel), Nir Sapir, Eli Waxman (Weizmann Institute of Science, Israel), Milena Bufano (Universidad Andrés Bello, Chile) for many productive and valuable discussions. SS acknowledges support by a Grant of Excellence from the Icelandic Research Fund, from the University of Iceland Research Fund, from the Dark Cosmology Centre, where part of this study was performed, and from CONICYT through FONDECYT grant 3140534. We acknowledge support from Basal-CATA PFB-06/2007 (FEB, SS), Iniciativa Cientifica Milenio grant P10-064-F (Millennium Center for Supernova Science), by Project IC120009 ”Millennium Institute of Astrophysics (MAS)” of Iniciativa Científica Milenio del Ministerio de Economía, Fomento y Turismo de Chile, with input from ”Fondo de Innovación para la Competitividad, del Ministerio de Economía, Fomento y Turismo de Chile” (FEB, GP, JAP, SS), CONICYT-Chile FONDECYT 1101024 (FEB). JAP acknowledges support by CONICYT through FONDECYT grant 3110142. TK and HK acknowledge support by the European Commission under the Marie Curie Intra-European Fellowship Programme in FP7. JPUF and BMJ acknowledges support from the ERC-StG grant EGGS-278202. KLP acknowledges financial support by the UK Space Agency for the Swift project. GL is supported by the Swedish Research Council through grant No. 623-2011-7117. JL acknowledges the UK Science and Technology Facilities Council for research studentship support. The research activity of AdUP, CT, and JG is supported by Spanish research project AYA2012-39362-C02-02. AdUP acknowledges support by the European Commission under the Marie Curie Career Integration Grant programme (FP7-PEOPLE-2012-CIG 322307). AJCT acknowledges support from the Spanish research project AYA2009-14000-C03-01 and AYA2012-39727-C03-01 DAK acknowledges support by the DFG cluster of excellence ”Origin and Structure of the Universe” and funding by the Thüringer Landessternwarte Tautenburg. AR acknowledges support by the Thüringer Landessternwarte Tautenburg. PS acknowledges support through the Sofja Kovalevskaja Award from the Alexander von Humboldt Foundation of Germany. ANG and SK acknowledge support by DFG KL 766/16-1. S. Schmidl acknowledges support by the Thüringer Ministerium für Bildung, Wissenschaft und Kultur under FKZ 12010-514. The Dark Cosmology Centre is funded by the Danish National Research Foundation. This work made use of data supplied by the UK Swift Science Data Centre at the University of Leicester. This research has made use of the GHostS database (www.grbhosts.org), which is partly funded by Spitzer/NASA grant RSA Agreement No. 1287913. Based in part on observations collected at the European Organisation for Astronomical Research in the Southern Hemisphere, Chile, as part of the program 089.A-0067, the Gemini Observatory, which is operated by the Association of Universities for Research in Astronomy, Inc., under a co-operative agreement with the NSF on behalf of the Gemini partnership, as part of the programs GN-2012A-Q-9, GN-2012A-Q-39, GN-2012B-Q-5, GS-2012A-Q-30, GS-2012A-Q-38, GS-2012A-Q-30, and GN-2012B-Q-5, the Nordic Optical Telescope (NOT), operated by the Nordic Optical Telescope Scientific Association at the Observatorio del Roque de los Muchachos, La Palma, Spain, of the Instituto de Astrofisica de Canarias, as part of the program P45-002 (PI: P. Jakobsson) and ITP10-04 (PI: R. Kotak, QUB), the Gran Telescopio Canarias (GTC), installed in the Spanish Observatorio del Roque de los Muchachos of the Instituto de Astrofísica de Canarias, in the island of La Palma, with Magellan as part of CN2012A-059, with the IRAM Plateau de Bure Interferometer, the James Clerk Maxwell Telescope, as part of the program M12AI12, with XMM-Newton, an ESA science mission with instruments and contributions directly funded by ESA Member States and NASA. Some of the data presented herein were obtained at the W.M. Keck Observatory, which is operated as a scientific partnership among the California Institute of Technology, the University of California and the National Aeronautics and Space Administration. The observatory was made possible by the generous financial support of the W.M. Keck Foundation. The United Kingdom Infrared Telescope is operated by the Joint Astronomy Centre on behalf of the Science and Technology Facilities Council of the U.K. The James Clerk Maxwell Telescope is operated by the Joint Astronomy Centre on behalf of the Science and Technology Facilities Council of the United Kingdom, the National Research Council of Canada, and the Netherlands Organisation for Scientific Research. Additional funds for the construction of SCUBA-2 were provided by the Canada Foundation for Innovation. The Submillimeter Array is a joint project between the Smithsonian Astrophysical Observatory and the Academia Sinica Institute of Astronomy and Astrophysics and is funded by the Smithsonian Institution and the Academia Sinica. IRAM is supported by INSU/CNRS (France), MPG (Germany) and IGN (Spain). Support for CARMA construction was derived from the Gordon and Betty Moore Foundation, the Kenneth T. and Eileen L. Norris Foundation, the James S. McDonnell Foundation, the Associates of the California Institute of Technology, the University of Chicago, the states of California, Illinois, and Maryland, and the National Science Foundation. Ongoing CARMA development and operations are supported by the National Science Foundation under a cooperative agreement, and by the CARMA partner universities. Part of the funding for GROND (both hardware as well as personnel) was generously granted from the Leibniz-Prize to Prof. G. Hasinger (DFG grant HA 1850/28-1). Funding for SDSS-III has been provided by the Alfred P. Sloan Foundation, the Participating Institutions, the National Science Foundation, and the U.S. Department of Energy Office of Science. The SDSS-III web site is http://www.sdss3.org/. SDSS-III is managed by the Astrophysical Research Consortium for the Participating Institutions of the SDSS-III Collaboration including the University of Arizona, the Brazilian Participation Group, Brookhaven National Laboratory, Carnegie Mellon University, University of Florida, the French Participation Group, the German Participation Group, Harvard University, the Instituto de Astrofisica de Canarias, the Michigan State/Notre Dame/JINA Participation Group, Johns Hopkins University, Lawrence Berkeley National Laboratory, Max Planck Institute for Astrophysics, Max Planck Institute for Extraterrestrial Physics, New Mexico State University, New York University, Ohio State University, Pennsylvania State University, University of Portsmouth, Princeton University, the Spanish Participation Group, University of Tokyo, University of Utah, Vanderbilt University, University of Virginia, University of Washington, and Yale University.References
- Ahn et al. (2012) Ahn, C. P., Alexandroff, R., Allende Prieto, C., et al. 2012, ApJS, 203, 21
- Aihara et al. (2011) Aihara, H., Allende Prieto, C., An, D., et al. 2011, ApJS, 193, 29
- Arcavi et al. (2011) Arcavi, I., Gal-Yam, A., Yaron, O., et al. 2011, ApJ, 742, L18
- Arnett (1982) Arnett, W. D. 1982, ApJ, 253, 785
- Arnouts et al. (1999) Arnouts, S., Cristiani, S., Moscardini, L., et al. 1999, MNRAS, 310, 540
- Asplund et al. (2009) Asplund, M., Grevesse, N., Sauval, A. J., & Scott, P. 2009, ARA&A, 47, 481
- Baldwin et al. (1981) Baldwin, J. A., Phillips, M. M., & Terlevich, R. 1981, PASP, 93, 5
- Barthelmy et al. (2005) Barthelmy, S. D., Barbier, L. M., Cummings, J. R., et al. 2005, Space Sci. Rev., 120, 143
- Barthelmy et al. (2012) Barthelmy, S. D., Baumgartner, W. H., Cummings, J. R., et al. 2012, GCN Circ., 13246
- Beardmore et al. (2012) Beardmore, A. P., Evans, P. A., Goad, M. R., & Osborne, J. P. 2012, GCN Circ., 13247
- Berger et al. (2011) Berger, E., Chornock, R., Holmes, T. R., et al. 2011, ApJ, 743, 204
- Bertin & Arnouts (1996) Bertin, E. & Arnouts, S. 1996, A&AS, 117, 393
- Beuermann et al. (1999) Beuermann, K., Hessman, F. V., Reinsch, K., et al. 1999, A&A, 352, L26
- Bhat et al. (2012) Bhat, P. N., Briggs, M. S., Connaughton, V., et al. 2012, ApJ, 744, 141
- Blinnikov et al. (1998) Blinnikov, S. I., Eastman, R., Bartunov, O. S., Popolitov, V. A., & Woosley, S. E. 1998, ApJ, 496, 454
- Bloom et al. (2002) Bloom, J. S., Kulkarni, S. R., & Djorgovski, S. G. 2002, AJ, 123, 1111
- Bostancı et al. (2013) Bostancı, Z. F., Kaneko, Y., & Göğüş, E. 2013, MNRAS, 428, 1623
- Bromberg et al. (2011) Bromberg, O., Nakar, E., & Piran, T. 2011, ApJ, 739, L55
- Bruzual & Charlot (2003) Bruzual, G. & Charlot, S. 2003, MNRAS, 344, 1000
- Bufano et al. (2012) Bufano, F., Pian, E., Sollerman, J., et al. 2012, ApJ, 753, 67
- Burrows et al. (2005) Burrows, D. N., Hill, J. E., Nousek, J. A., et al. 2005, Space Sci. Rev., 120, 165
- Calzetti et al. (2000) Calzetti, D., Armus, L., Bohlin, R. C., et al. 2000, ApJ, 533, 682
- Campana et al. (2006) Campana, S., Mangano, V., Blustin, A. J., et al. 2006, Nature, 442, 1008
- Cano (2013) Cano, Z. 2013, MNRAS, 434, 1098
- Cano et al. (2011a) Cano, Z., Bersier, D., Guidorzi, C., et al. 2011a, ApJ, 740, 41
- Cano et al. (2011b) Cano, Z., Bersier, D., Guidorzi, C., et al. 2011b, MNRAS, 413, 669
- Chabrier et al. (2000) Chabrier, G., Baraffe, I., Allard, F., & Hauschildt, P. 2000, ApJ, 542, 464
- Chapin et al. (2013) Chapin, E. L., Berry, D. S., Gibb, A. G., et al. 2013, MNRAS, 430, 2545
- Chatzopoulos et al. (2011) Chatzopoulos, E., Wheeler, J. C., Vinko, J., et al. 2011, ApJ, 729, 143
- Chen (2012) Chen, H.-W. 2012, MNRAS, 419, 3039
- Chornock et al. (2010) Chornock, R., Berger, E., Levesque, E. M., et al. 2010, arXiv:1004.2262
- Christensen et al. (2011) Christensen, L., Fynbo, J. P. U., Prochaska, J. X., et al. 2011, ApJ, 727, 73
- Christensen et al. (2008) Christensen, L., Vreeswijk, P. M., Sollerman, J., et al. 2008, A&A, 490, 45
- Clocchiatti et al. (2011) Clocchiatti, A., Suntzeff, N. B., Covarrubias, R., & Candia, P. 2011, AJ, 141, 163
- Cobb et al. (2010) Cobb, B. E., Bloom, J. S., Perley, D. A., et al. 2010, ApJ, 718, L150
- Colgate & McKee (1969) Colgate, S. A. & McKee, C. 1969, ApJ, 157, 623
- Cucchiara et al. (2012) Cucchiara, A., Levan, A., Fox, D. B., & Tanvir, N. R. 2012, GCN Circ., 13245
- De Cia et al. (2011) De Cia, A., Starling, R. L. C., Wiersema, K., et al. 2011, MNRAS, 418, 129
- de Pasquale et al. (2006) de Pasquale, M., Piro, L., Gendre, B., et al. 2006, A&A, 455, 813
- de Ugarte Postigo et al. (2013) de Ugarte Postigo, A., Cano, Z., Thoene, C. C., et al. 2013, Central Bureau Electronic Telegrams, 3637
- de Ugarte Postigo et al. (2012a) de Ugarte Postigo, A., Fynbo, J. P. U., Thöne, C. C., et al. 2012a, A&A, 548, A11
- de Ugarte Postigo et al. (2012b) de Ugarte Postigo, A., Lundgren, A., Martín, S., et al. 2012b, A&A, 538, A44
- Della Valle et al. (2008) Della Valle, M., Benetti, S., Mazzali, P., et al. 2008, Central Bureau Electronic Telegrams, 1602
- Della Valle et al. (2006a) Della Valle, M., Chincarini, G., Panagia, N., et al. 2006a, Nature, 444, 1050
- Della Valle et al. (2006b) Della Valle, M., Malesani, D., Bloom, J. S., et al. 2006b, ApJ, 642, L103
- Dempsey et al. (2013) Dempsey, J. T., Friberg, P., Jenness, T., et al. 2013, MNRAS, 430, 2534
- Dermer (2004) Dermer, C. D. 2004, ApJ, 614, 284
- Dopita et al. (2006) Dopita, M. A., Fischera, J., Sutherland, R. S., et al. 2006, ApJS, 167, 177
- Ensman & Burrows (1992) Ensman, L. & Burrows, A. 1992, ApJ, 393, 742
- Ergon et al. (2013) Ergon, M., Sollerman, J., Fraser, M., et al. 2013, A&A, submitted, arXiv:1305.1851
- Evans et al. (2009) Evans, P. A., Beardmore, A. P., Page, K. L., et al. 2009, MNRAS, 397, 1177
- Evans et al. (2007) Evans, P. A., Beardmore, A. P., Page, K. L., et al. 2007, A&A, 469, 379
- Evans et al. (2010) Evans, P. A., Willingale, R., Osborne, J. P., et al. 2010, A&A, 519, A102
- Fenimore & Sumner (1997) Fenimore, E. & Sumner, M. C. 1997, in All-Sky X-Ray Observations in the Next Decade, ed. M. Matsuoka & N. Kawai, 167
- Ferrero et al. (2006) Ferrero, P., Kann, D. A., Zeh, A., et al. 2006, A&A, 457, 857
- Ferrero et al. (2009) Ferrero, P., Klose, S., Kann, D. A., et al. 2009, A&A, 497, 729
- Filippenko (1997) Filippenko, A. V. 1997, ARA&A, 35, 309
- Foley et al. (2006) Foley, S., Watson, D., Gorosabel, J., et al. 2006, A&A, 447, 891
- Förster Schreiber et al. (2009) Förster Schreiber, N. M., Genzel, R., Bouché, N., et al. 2009, ApJ, 706, 1364
- Friis & Watson (2013) Friis, M. & Watson, D. 2013, ApJ, 771, 15
- Fynbo et al. (2003) Fynbo, J. P. U., Jakobsson, P., Möller, P., et al. 2003, A&A, 406, L63
- Fynbo et al. (2002) Fynbo, J. P. U., Möller, P., Thomsen, B., et al. 2002, A&A, 388, 425
- Fynbo et al. (2006) Fynbo, J. P. U., Watson, D., Thöne, C. C., et al. 2006, Nature, 444, 1047
- Fynbo et al. (2000) Fynbo, J. U., Holland, S., Andersen, M. I., et al. 2000, ApJ, 542, L89
- Gal-Yam et al. (2006) Gal-Yam, A., Fox, D. B., Price, P. A., et al. 2006, Nature, 444, 1053
- Galama et al. (1998) Galama, T. J., Vreeswijk, P. M., van Paradijs, J., et al. 1998, Nature, 395, 670
- Gendre et al. (2006) Gendre, B., Corsi, A., & Piro, L. 2006, A&A, 455, 803
- Goldoni et al. (2006) Goldoni, P., Royer, F., François, P., et al. 2006, in Society of Photo-Optical Instrumentation Engineers (SPIE) Conference Series, Vol. 6269, Society of Photo-Optical Instrumentation Engineers (SPIE) Conference Series
- Greiner et al. (2008) Greiner, J., Bornemann, W., Clemens, C., et al. 2008, PASP, 120, 405
- Greiner et al. (2007) Greiner, J., Bornemann, W., Clemens, C., et al. 2007, The Messenger, 130, 12
- Greiner et al. (2009) Greiner, J., Krühler, T., McBreen, S., et al. 2009, ApJ, 693, 1912
- Grupe et al. (2010) Grupe, D., Burrows, D. N., Wu, X.-F., et al. 2010, ApJ, 711, 1008
- Guetta & Della Valle (2007) Guetta, D. & Della Valle, M. 2007, ApJ, 657, L73
- Hammer et al. (2006) Hammer, F., Flores, H., Schaerer, D., et al. 2006, A&A, 454, 103
- Hamuy & Pinto (2002) Hamuy, M. & Pinto, P. A. 2002, ApJ, 566, L63
- Han et al. (2010) Han, X. H., Hammer, F., Liang, Y. C., et al. 2010, A&A, 514, A24
- Hjorth (2013) Hjorth, J. 2013, Royal Society of London Philosophical Transactions Series A, 371, 20275
- Hjorth & Bloom (2012) Hjorth, J. & Bloom, J. S. 2012, in Gamma-Ray Bursts, ed. C. Kouveliotou, R. A. M. J. Wijers, & S. Woosley (Cambridge University Press), 169–190
- Hjorth et al. (2012) Hjorth, J., Malesani, D., Jakobsson, P., et al. 2012, ApJ, 756, 187
- Hjorth et al. (2003) Hjorth, J., Sollerman, J., Møller, P., et al. 2003, Nature, 423, 847
- Hogg et al. (2002) Hogg, D. W., Baldry, I. K., Blanton, M. R., & Eisenstein, D. J. 2002, arXiv:astro-ph/0210394
- Holland et al. (2013) Holland, W. S., Bintley, D., Chapin, E. L., et al. 2013, MNRAS, 430, 2513
- Hook et al. (2004) Hook, I. M., Jørgensen, I., Allington-Smith, J. R., et al. 2004, PASP, 116, 425
- Horne (1986) Horne, K. 1986, PASP, 98, 609
- Ilbert et al. (2006) Ilbert, O., Arnouts, S., McCracken, H. J., et al. 2006, A&A, 457, 841
- Jakobsson et al. (2005) Jakobsson, P., Björnsson, G., Fynbo, J. P. U., et al. 2005, MNRAS, 362, 245
- Jin et al. (2013) Jin, Z.-P., Covino, S., Della Valle, M., et al. 2013, ApJ, 774, 114
- Kaneko et al. (2007) Kaneko, Y., Ramirez-Ruiz, E., Granot, J., et al. 2007, ApJ, 654, 385
- Kann et al. (2011) Kann, D. A., Klose, S., Zhang, B., et al. 2011, ApJ, 734, 96
- Kauffmann et al. (2003) Kauffmann, G., Heckman, T. M., Tremonti, C., et al. 2003, MNRAS, 346, 1055
- Kennicutt (1998) Kennicutt, Jr., R. C. 1998, ARA&A, 36, 189
- Kewley et al. (2001) Kewley, L. J., Dopita, M. A., Sutherland, R. S., Heisler, C. A., & Trevena, J. 2001, ApJ, 556, 121
- Kewley et al. (2004) Kewley, L. J., Geller, M. J., & Jansen, R. A. 2004, AJ, 127, 2002
- Klose et al. (2013) Klose, S., Nicuesa Guelbenzu, A., Kruehler, T., et al. 2013, Central Bureau Electronic Telegrams, 3677
- Kron (1980) Kron, R. G. 1980, ApJS, 43, 305
- Krühler et al. (2012) Krühler, T., Fynbo, J. P. U., Geier, S., et al. 2012, A&A, 546, A8
- Krühler et al. (2011a) Krühler, T., Greiner, J., Schady, P., et al. 2011a, A&A, 534, A108
- Krühler et al. (2008) Krühler, T., Küpcü Yoldaş, A., Greiner, J., et al. 2008, ApJ, 685, 376
- Krühler et al. (2011b) Krühler, T., Schady, P., Greiner, J., et al. 2011b, A&A, 526, A153
- Kuin & Troja (2012) Kuin, N. P. M. & Troja, E. 2012, GCN Circ., 13248
- Kulkarni et al. (1998) Kulkarni, S. R., Frail, D. A., Wieringa, M. H., et al. 1998, Nature, 395, 663
- Kumar & Panaitescu (2000) Kumar, P. & Panaitescu, A. 2000, ApJ, 541, L51
- Larson et al. (2011) Larson, D., Dunkley, J., Hinshaw, G., et al. 2011, ApJS, 192, 16
- Laskar et al. (2011) Laskar, T., Berger, E., & Chary, R.-R. 2011, ApJ, 739, 1
- Lazzati et al. (2012) Lazzati, D., Morsony, B. J., Blackwell, C. H., & Begelman, M. C. 2012, ApJ, 750, 68
- Levan et al. (2006) Levan, A., Fruchter, A., Rhoads, J., et al. 2006, ApJ, 647, 471
- Levan et al. (2013) Levan, A. J., Tanvir, N. R., Fruchter, A. S., et al. 2013, ApJ, submitted, arXiv:1307.5338
- Levesque et al. (2011) Levesque, E. M., Berger, E., Soderberg, A. M., & Chornock, R. 2011, ApJ, 739, 23
- Levesque et al. (2012) Levesque, E. M., Chornock, R., Soderberg, A. M., Berger, E., & Lunnan, R. 2012, ApJ, 758, 92
- Levesque et al. (2010a) Levesque, E. M., Kewley, L. J., Berger, E., & Zahid, H. J. 2010a, AJ, 140, 1557
- Levesque et al. (2010b) Levesque, E. M., Kewley, L. J., Graham, J. F., & Fruchter, A. S. 2010b, ApJ, 712, L26
- Lyman et al. (2013) Lyman, J. D., Bersier, D., & James, P. A. 2013, MNRAS, in press, arXiv:1311.1946
- Maeda et al. (2003) Maeda, K., Mazzali, P. A., Deng, J., et al. 2003, ApJ, 593, 931
- Malesani et al. (2009) Malesani, D., Fynbo, J. P. U., Hjorth, J., et al. 2009, ApJ, 692, L84
- Malesani et al. (2012a) Malesani, D., Schulze, S., Krühler, T., et al. 2012a, Central Bureau Electronic Telegrams, 3100
- Malesani et al. (2012b) Malesani, D., Schulze, S., Krühler, T., et al. 2012b, GCN Circ., 13275
- Malesani et al. (2004) Malesani, D., Tagliaferri, G., Chincarini, G., et al. 2004, ApJ, 609, L5
- Margutti et al. (2013) Margutti, R., Soderberg, A. M., Wieringa, M. H., et al. 2013, ApJ, 778, 18
- Martin et al. (2012) Martin, S., Petitpas, G., & de Ugarte Postigo, A. 2012, GCN Circ., 13260
- Maselli et al. (2013) Maselli, A., Melandri, A., Nava, L., et al. 2013, Science, in press, arXiv:1311.5254
- Matheson et al. (2003) Matheson, T., Garnavich, P. M., Stanek, K. Z., et al. 2003, ApJ, 599, 394
- Melandri et al. (2012) Melandri, A., Pian, E., Ferrero, P., et al. 2012, A&A, 547, A82
- Mészáros (2006) Mészáros, P. 2006, Reports on Progress in Physics, 69, 2259
- Milisavljevic et al. (2013) Milisavljevic, D., Soderberg, A. M., Margutti, R., et al. 2013, ApJ, 770, L38
- Modjaz et al. (2009) Modjaz, M., Li, W., Butler, N., et al. 2009, ApJ, 702, 226
- Molinari et al. (2007) Molinari, E., Vergani, S. D., Malesani, D., et al. 2007, A&A, 469, L13
- Monet et al. (2003) Monet, D. G., Levine, S. E., Canzian, B., et al. 2003, AJ, 125, 984
- Nakar & Sari (2012) Nakar, E. & Sari, R. 2012, ApJ, 747, 88
- Nardini et al. (2012) Nardini, M., Schmidl, S., Greiner, J., & Kann, D. A. 2012, GCN Circ., 13256
- Nousek et al. (2006) Nousek, J. A., Kouveliotou, C., Grupe, D., et al. 2006, ApJ, 642, 389
- Ofek et al. (2007) Ofek, E. O., Cenko, S. B., Gal-Yam, A., et al. 2007, ApJ, 662, 1129
- Oke et al. (1995) Oke, J. B., Cohen, J. G., Carr, M., et al. 1995, PASP, 107, 375
- Olivares E. et al. (2012) Olivares E., F., Greiner, J., Schady, P., et al. 2012, A&A, 539, A76
- Page et al. (2011) Page, K. L., Starling, R. L. C., Fitzpatrick, G., et al. 2011, MNRAS, 416, 2078
- Panaitescu & Kumar (2000) Panaitescu, A. & Kumar, P. 2000, ApJ, 543, 66
- Patat et al. (2001) Patat, F., Cappellaro, E., Danziger, J., et al. 2001, ApJ, 555, 900
- Perley (2012) Perley, D. A. 2012, GCN Circ., 13278
- Perley et al. (2013a) Perley, D. A., Cenko, S. B., Corsi, A., et al. 2013a, ApJ, submitted, arXiv:1307.4401
- Perley et al. (2012a) Perley, D. A., Cucchiara, A., Cenko, S. B., et al. 2012a, GCN Circ., 13267
- Perley et al. (2012b) Perley, D. A., Jones, T., & Ellis, R. 2012b, GCN Circ., 13279
- Perley et al. (2013b) Perley, D. A., Levan, A. J., Tanvir, N. R., et al. 2013b, ApJ, 778, 128
- Perley et al. (2008) Perley, D. A., Li, W., Chornock, R., et al. 2008, ApJ, 688, 470
- Perley et al. (2011) Perley, D. A., Morgan, A. N., Updike, A., et al. 2011, AJ, 141, 36
- Pettini & Pagel (2004) Pettini, M. & Pagel, B. E. J. 2004, MNRAS, 348, L59
- Phillips (1993) Phillips, M. M. 1993, ApJ, 413, L105
- Pian et al. (2006) Pian, E., Mazzali, P. A., Masetti, N., et al. 2006, Nature, 442, 1011
- Piranomonte et al. (2008) Piranomonte, S., Ward, P. A., Fiore, F., et al. 2008, A&A, 492, 775
- Poole et al. (2008) Poole, T. S., Breeveld, A. A., Page, M. J., et al. 2008, MNRAS, 383, 627
- Racusin et al. (2009) Racusin, J. L., Liang, E. W., Burrows, D. N., et al. 2009, ApJ, 698, 43
- Richmond et al. (1994) Richmond, M. W., Treffers, R. R., Filippenko, A. V., et al. 1994, AJ, 107, 1022
- Richmond et al. (1996) Richmond, M. W., van Dyk, S. D., Ho, W., et al. 1996, AJ, 111, 327
- Roming et al. (2005) Roming, P. W. A., Kennedy, T. E., Mason, K. O., et al. 2005, Space Sci. Rev., 120, 95
- Sánchez-Ramírez et al. (2012) Sánchez-Ramírez, R., Leloudas, G., Postigo, A. d. U., et al. 2012, GCN Circ., 13281
- Sari & Piran (1999) Sari, R. & Piran, T. 1999, ApJ, 520, 641
- Sari et al. (1999) Sari, R., Piran, T., & Halpern, J. P. 1999, ApJ, 519, L17
- Sari et al. (1998) Sari, R., Piran, T., & Narayan, R. 1998, ApJ, 497, L17
- Sault et al. (1995) Sault, R. J., Teuben, P. J., & Wright, M. C. H. 1995, in Astronomical Society of the Pacific Conference Series, Vol. 77, Astronomical Data Analysis Software and Systems IV, ed. R. A. Shaw, H. E. Payne, & J. J. E. Hayes, 433
- Savaglio et al. (2009) Savaglio, S., Glazebrook, K., & Le Borgne, D. 2009, ApJ, 691, 182
- Schlegel et al. (1998) Schlegel, D. J., Finkbeiner, D. P., & Davis, M. 1998, ApJ, 500, 525
- Schulze et al. (2011) Schulze, S., Klose, S., Björnsson, G., et al. 2011, A&A, 526, A23
- Schulze et al. (2012a) Schulze, S., Levan, A. J., Malesani, D., et al. 2012a, GCN Circ., 13257
- Schulze et al. (2012b) Schulze, S., Malesani, D., de Ugarte Postigo, A., et al. 2012b, GCN Circ., 13252
- Shen & Matzner (2012) Shen, R. & Matzner, C. D. 2012, ApJ, 744, 36
- Skrutskie et al. (2006) Skrutskie, M. F., Cutri, R. M., Stiening, R., et al. 2006, AJ, 131, 1163
- Smith et al. (2012) Smith, I. A., Tilanus, R. P. J., Tanvir, N. R., & Frail, D. A. 2012, GCN Circ., 13259
- Soderberg et al. (2008) Soderberg, A. M., Berger, E., Page, K. L., et al. 2008, Nature, 453, 469
- Soderberg et al. (2006a) Soderberg, A. M., Kulkarni, S. R., Nakar, E., et al. 2006a, Nature, 442, 1014
- Soderberg et al. (2012) Soderberg, A. M., Margutti, R., Zauderer, B. A., et al. 2012, ApJ, 752, 78
- Soderberg et al. (2006b) Soderberg, A. M., Nakar, E., Berger, E., & Kulkarni, S. R. 2006b, ApJ, 638, 930
- Sparre et al. (2011) Sparre, M., Sollerman, J., Fynbo, J. P. U., et al. 2011, ApJ, 735, L24
- Sparre & Starling (2012) Sparre, M. & Starling, R. L. C. 2012, MNRAS, 427, 2965
- Staley et al. (2013) Staley, T. D., Titterington, D. J., Fender, R. P., et al. 2013, MNRAS, 428, 3114
- Stanek et al. (2005) Stanek, K. Z., Garnavich, P. M., Nutzman, P. A., et al. 2005, ApJ, 626, L5
- Stanek et al. (2003) Stanek, K. Z., Matheson, T., Garnavich, P. M., et al. 2003, ApJ, 591, L17
- Starling et al. (2012) Starling, R. L. C., Page, K. L., Pe’Er, A., Beardmore, A. P., & Osborne, J. P. 2012, MNRAS, 427, 2950
- Starling et al. (2011) Starling, R. L. C., Wiersema, K., Levan, A. J., et al. 2011, MNRAS, 411, 2792
- Stritzinger et al. (2002) Stritzinger, M., Hamuy, M., Suntzeff, N. B., et al. 2002, AJ, 124, 2100
- Tanvir et al. (2012) Tanvir, N. R., Levan, A. J., Cucchiara, A., & Fox, D. B. 2012, GCN Circ., 13251
- Tanvir et al. (2010) Tanvir, N. R., Rol, E., Levan, A. J., et al. 2010, ApJ, 725, 625
- Thöne et al. (2011) Thöne, C. C., de Ugarte Postigo, A., Fryer, C. L., et al. 2011, Nature, 480, 72
- Thöne et al. (2008) Thöne, C. C., Fynbo, J. P. U., Östlin, G., et al. 2008, ApJ, 676, 1151
- Tody (1993) Tody, D. 1993, in Astronomical Society of the Pacific Conference Series, Vol. 52, Astronomical Data Analysis Software and Systems II, ed. R. J. Hanisch, R. J. V. Brissenden, & J. Barnes, 173
- Troja et al. (2012) Troja, E., D’Elia, V., Guidorzi, C., et al. 2012, GCN Circ., 13243
- Valenti et al. (2008) Valenti, S., Benetti, S., Cappellaro, E., et al. 2008, MNRAS, 383, 1485
- Valenti et al. (2011) Valenti, S., Fraser, M., Benetti, S., et al. 2011, MNRAS, 416, 3138
- van Marle et al. (2006) van Marle, A. J., Langer, N., Achterberg, A., & García-Segura, G. 2006, A&A, 460, 105
- Vergani et al. (2011) Vergani, S. D., Flores, H., Covino, S., et al. 2011, A&A, 535, A127
- Vernet et al. (2011) Vernet, J., Dekker, H., D’Odorico, S., et al. 2011, A&A, 536, A105
- Virgili et al. (2009) Virgili, F. J., Liang, E.-W., & Zhang, B. 2009, MNRAS, 392, 91
- Wanderman & Piran (2010) Wanderman, D. & Piran, T. 2010, MNRAS, 406, 1944
- Wiersema et al. (2012) Wiersema, K., Cucchiara, A., Levan, A. J., et al. 2012, GCN Circ., 13276
- Wiersema et al. (2007) Wiersema, K., Savaglio, S., Vreeswijk, P. M., et al. 2007, A&A, 464, 529
- Woosley (2012) Woosley, S. E. 2012, in Gamma-Ray Bursts, ed. C. Kouveliotou, R. A. M. J. Wijers, & S. Woosley (Cambridge University Press), 191–214
- Woosley & Bloom (2006) Woosley, S. E. & Bloom, J. S. 2006, ARA&A, 44, 507
- Xu et al. (2013) Xu, D., de Ugarte Postigo, A., Leloudas, G., et al. 2013, ApJ, 776, 98
- Yoldaş et al. (2008) Yoldaş, A. K., Krühler, T., Greiner, J., et al. 2008, in American Institute of Physics Conference Series, Vol. 1000, American Institute of Physics Conference Series, ed. M. Galassi, D. Palmer, & E. Fenimore, 227
- Zauderer et al. (2012) Zauderer, A., Berger, E., & Laskar, T. 2012, GCN Circ., 13254
- Zeh et al. (2004) Zeh, A., Klose, S., & Hartmann, D. H. 2004, ApJ, 609, 952
- Zeh et al. (2006) Zeh, A., Klose, S., & Kann, D. A. 2006, ApJ, 637, 889
- Zhang & Mészáros (2004) Zhang, B. & Mészáros, P. 2004, International Journal of Modern Physics A, 19, 2385
- Zhang et al. (2009) Zhang, B., Zhang, B.-B., Virgili, F. J., et al. 2009, ApJ, 703, 1696
- Zhang et al. (2012) Zhang, B.-B., Fan, Y.-Z., Shen, R.-F., et al. 2012, ApJ, 756, 190
Appendix A Photometry of the optical transient
| MJD | Epoch | Instrument | Filter | Exposure | Brightness |
|---|---|---|---|---|---|
| (days) | (s) | time (s) | (magAB) | ||
| 56039.308 | 664.2 | Swift/UVOT | 38.9 | ||
| 56039.313 | 1110.2 | Swift/UVOT | 38.9 | ||
| 56039.373 | 6244.8 | Swift/UVOT | 332.2 | ||
| 56066.505 | 2350484 | Swift/UVOT | 16823.3 | ||
| 56039.311 | 935.9 | Swift/UVOT | 77.8 | ||
| 56039.370 | 5967.3 | Swift/UVOT | 196.6 | ||
| 56039.436 | 11694.8 | Swift/UVOT | 885.6 | ||
| 56066.471 | 2347530 | Swift/UVOT | 16365 | ||
| 56039.311 | 912.7 | Swift/UVOT | 58.3 | ||
| 56039.364 | 5454.6 | Swift/UVOT | 393.2 | ||
| 56039.445 | 12479.4 | Swift/UVOT | 645.3 | ||
| 56039.598 | 25671.6 | Swift/UVOT | 1771.2 | ||
| 56067.110 | 2402743 | Swift/UVOT | 11529.3 | ||
| 56039.305 | 387.2 | Swift/UVOT | 245.8 | ||
| 56039.311 | 898.9 | Swift/UVOT | 52.9 | ||
| 56039.366 | 5659.9 | Swift/UVOT | 393.2 | ||
| 56039.530 | 19853.4 | Swift/UVOT | 1770.3 | ||
| 56039.645 | 29800.8 | Swift/UVOT | 651.6 | ||
| 56042.104 | 242229.9 | Swift/UVOT | 11277.9 | ||
| 56051.997 | 1096947 | Swift/UVOT | 69897.4 | ||
| 56077.011 | 3258148 | Swift/UVOT | 27766.2 | ||
| 56039.339 | 3328.3 | Swift/UVOT | 451.6 | ||
| 56039.539 | 20641.6 | Swift/UVOT | 1523.7 | ||
| 56040.652 | 116790.9 | Swift/UVOT | 1444 | ||
| 56061.463 | 1914851 | Swift/UVOT | 7250.3 | ||
| 56093.296 | 4665241 | Swift/UVOT | 449.7 | ||
| 56039.302 | 90.4 | Swift/UVOT | 9 | ||
| 56039.311 | 912 | Swift/UVOT | 77.7 | ||
| 56039.541 | 20785.9 | Swift/UVOT | 1607.4 | ||
| 56041.111 | 156431 | Swift/UVOT | 1282.9 | ||
| 56093.300 | 4665526 | Swift/UVOT | 449.8 | ||
| 56039.990 | 59563 | GROND | |||
| 56040.015 | 61702 | GROND | |||
| 56040.036 | 63556 | GROND | |||
| 56040.040 | 63883 | Gemini/GMOS | |||
| 56040.057 | 65383 | GROND | |||
| 56040.089 | 68118 | GROND | |||
| 56040.173 | 75361 | P60 | |||
| 56041.067 | 152661 | GROND | |||
| 56041.104 | 155811 | GROND | |||
| 56043.239 | 340286 | Gemini/GMOS | |||
| 56048.018 | 753173 | GROND | |||
| 56050.011 | 925358 | GROND | |||
| 56053.969 | 1267371 | GTC/Osiris | |||
| 56054.249 | 1291574 | Gemini/GMOS | |||
| 56059.005 | 1702443 | GROND | |||
| 56059.020 | 1703734 | Gemini/GMOS | |||
| 56067.938 | 2474262 | GROND | |||
| 56078.217 | 3362396 | GROND |
| MJD | Epoch | Instrument | Filter | Exposure | Brightness |
|---|---|---|---|---|---|
| (days) | (s) | time (s) | (magAB) | ||
| 56039.414 | 9793 | Gemini/GMOS | |||
| 56039.990 | 59563 | GROND | |||
| 56040.015 | 61702 | GROND | |||
| 56040.036 | 63556 | GROND | |||
| 56040.047 | 64459 | Gemini/GMOS | |||
| 56040.057 | 65383 | GROND | |||
| 56040.089 | 68118 | GROND | |||
| 56040.161 | 74357 | P60 | |||
| 56040.888 | 137134 | NOT/MOSCA | |||
| 56041.068 | 152661 | GROND | |||
| 56041.104 | 155811 | GROND | |||
| 56041.949 | 228856 | NOT/MOSCA | |||
| 56042.938 | 314237 | NOT/ALFOSC | |||
| 56043.247 | 340990 | Gemini/GMOS | |||
| 56048.018 | 753173 | GROND | |||
| 56048.967 | 835203 | NOT/StanCAM | |||
| 56050.011 | 925358 | GROND | |||
| 56052.958 | 1179975 | Gemini/GMOS | |||
| 56053.886 | 1260196 | NOT/StanCAM | |||
| 56053.972 | 1267581 | GTC/Osiris | |||
| 56054.258 | 1292332 | Gemini/GMOS | |||
| 56056.895 | 1520199 | NOT/ALFOSC | |||
| 56059.032 | 1704797 | Gemini/GMOS | |||
| 56059.005 | 1702443 | GROND | |||
| 56061.962 | 1957915 | Gemini/GMOS | |||
| 56063.912 | 2126451 | NOT/ALFOSC | |||
| 56065.897 | 2297894 | NOT/MOSCA | |||
| 56065.968 | 2304100 | Gemini/GMOS | |||
| 56066.028 | 2309230 | Magellan/LDSS3 | |||
| 56067.938 | 2474262 | GROND | |||
| 56067.957 | 2475887 | NOT/MOSCA | |||
| 56067.979 | 2477779 | DuPont/CCD | |||
| 56069.966 | 2649489 | Gemini/GMOS | |||
| 56069.902 | 2643961 | NOT/MOSCA | |||
| 56070.957 | 2735091 | Gemini/GMOS | |||
| 56071.907 | 2817199 | NOT/ALFOSC | |||
| 56078.217 | 3362396 | GROND | |||
| 56079.955 | 3512502 | Gemini/GMOS | |||
| 56083.915 | 3854715 | NOT/ALFOSC | |||
| 56039.322 | 1880 | Gemini/GMOS | |||
| 56039.896 | 51451 | NOT/MOSCA | |||
| 56039.990 | 59563 | GROND | |||
| 56040.015 | 61702 | GROND | |||
| 56040.036 | 63556 | GROND | |||
| 56040.047 | 64459 | Gemini/GMOS | |||
| 56040.078 | 67209 | GROND | |||
| 56040.149 | 73289 | P60 | |||
| 56040.871 | 135683 | NOT/MOSCA | |||
| 56041.067 | 152661 | GROND | |||
| 56041.104 | 155811 | GROND | |||
| 56041.924 | 226705 | NOT/MOSCA | |||
| 56042.866 | 308045 | GTC/Osiris | |||
| 56042.885 | 309735 | NOT/ALFOSC | |||
| 56043.255 | 341689 | Gemini/GMOS | |||
| 56043.874 | 395133 | NOT/ALFOSC | |||
| 56047.890 | 742159 | NOT/ALFOSC | a𝑎aa𝑎aThe -band blocking filter was used to increase the S/N in band.Data taken from Staley et al. (2013).Blended line. | ||
| 56048.018 | 753173 | GROND | |||
| 56048.987 | 836905 | NOT/StanCam | |||
| 56050.011 | 925358 | GROND | |||
| 56053.916 | 1262736 | NOT/StanCAM | |||
| 56053.903 | 1261613 | GTC/Osiris | |||
| 56063.974 | 1267805 | GTC/Osiris | |||
| 56054.163 | 1284132 | P60 | |||
| 56054.264 | 1292809 | Gemini/GMOS | |||
| 56055.175 | 1371560 | P60 | |||
| 56055.884 | 1432840 | NOT/StanCAM | |||
| 56058.889 | 1692472 | NOT/ALFOSC | |||
| 56059.005 | 1702443 | GROND | |||
| 56059.005 | 1702494 | Gemini/GMOS | |||
| 56061.176 | 1890072 | P60 | |||
| 56062.181 | 1976858 | P60 | |||
| 56062.886 | 2037796 | NOT/ALFOSC | |||
| 56063.180 | 2063213 | P60 | |||
| 56063.891 | 2124602 | NOT/ALFOSC | |||
| 56065.921 | 2300003 | NOT/MOSCA |
Tab. 26 — continued
| MJD | Epoch | Instrument | Filter | Exposure | Brightness |
|---|---|---|---|---|---|
| (days) | (s) | time (s) | (magAB) | ||
| 56066.040 | 2310267 | Magellan/LDSS3 | |||
| 56067.934 | 2473900 | NOT/MOSCA | |||
| 56067.938 | 2474262 | GROND | |||
| 56068.014 | 2480838 | DuPont/CCD | |||
| 56068.923 | 2559358 | NOT/MOSCA | |||
| 56069.1911 | 2582542 | P60 | |||
| 56070.0313 | 2655131 | Magellan/LDSS3 | |||
| 56070.1766 | 2667689 | P60 | |||
| 56070.9694 | 2736187 | Gemini/GMOS | |||
| 56071.8946 | 2816120 | NOT/ALFOSC | |||
| 56076.8994 | 3248536 | NOT/ALFOSC | |||
| 56078.2172 | 3362396 | GROND | |||
| 56079.8939 | 3507261 | NOT/ALFOSC | |||
| 56083.8841 | 3852020 | NOT/ALFOSC | |||
| 56039.9900 | 59563 | GROND | |||
| 56040.0360 | 63541 | GROND | |||
| 56040.0599 | 65605 | Gemini/GMOS | |||
| 56040.0890 | 68118 | GROND | |||
| 56041.0675 | 152661 | GROND | |||
| 56041.1039 | 155811 | GROND | |||
| 56043.2633 | 342383 | Gemini/GMOS | |||
| 56048.0179 | 753173 | GROND | |||
| 56049.8781 | 913895 | CAHA/Omega2000 | |||
| 56050.0107 | 925358 | GROND | |||
| 56052.2596 | 1119664 | UKIRT/WFCAM | |||
| 56053.9770 | 1268047 | GTC/Osiris | |||
| 56054.2708 | 1293429 | Gemini/GMOS | |||
| 56058.9733 | 1699722 | Gemini/GMOS | |||
| 56059.0048 | 1702443 | GROND | |||
| 56067.9101 | 2471861 | NOT/MOSCA | |||
| 56067.9379 | 2474262 | GROND | |||
| 56068.8970 | 2557129 | NOT/MOSCA | |||
| 56070.9776 | 2736894 | Gemini/GMOS | |||
| 56078.2172 | 3362396 | GROND | |||
| 56049.9204 | 917552 | CAHA/Omega2000 | |||
| 56039.3537 | 4589 | UKIRT/WFCAM | |||
| 56039.3590 | 5048 | UKIRT/WFCAM | |||
| 56039.3644 | 5514 | UKIRT/WFCAM | |||
| 56039.3698 | 5979 | UKIRT/WFCAM | |||
| 56048.9026 | 829616 | CAHA/Omega2000 | |||
| 56049.9727 | 922069 | CAHA/Omega2000 | |||
| 56052.2354 | 1117569 | UKIRT/WFCAM | |||
| 56054.2834 | 1294514 | Gemini-N/NIRI | |||
| 56065.2816 | 2244761 | UKIRT/WFCAM | |||
| 56049.1898 | 854426 | P200/WIRC | |||
| 56039.3757 | 6493 | UKIRT/WFCAM | |||
| 56039.3812 | 6963 | UKIRT/WFCAM | |||
| 56039.3866 | 7432 | UKIRT/WFCAM | |||
| 56039.3919 | 7894 | UKIRT/WFCAM | |||
| 56040.3685 | 92266 | UKIRT/WFCAM | |||
| 56042.3348 | 262155 | UKIRT/WFCAM | |||
| 56054.2376 | 1290555 | Gemini-N/NIRI |
Tab. 26 — continued
Appendix B Late time observations
| MJD | Epoch | Instrument | Filter | Exposure |
|---|---|---|---|---|
| (days) | (s) | time (s) | ||
| 56205.1849 | 14332405 | CAHA/BUSCA | ||
| 56206.1974 | 14419882 | CAHA/BUSCA | ||
| 56208.1930 | 14592304 | CAHA/BUSCA | ||
| 56209.1754 | 14677188 | CAHA/BUSCA | ||
| 56205.1849 | 14332405 | CAHA/BUSCA | ||
| 56206.1974 | 14419882 | CAHA/BUSCA | ||
| 56208.1930 | 14592304 | CAHA/BUSCA | ||
| 56209.1754 | 14677188 | CAHA/BUSCA | ||
| 56205.1849 | 14332405 | CAHA/BUSCA | ||
| 56206.1974 | 14419882 | CAHA/BUSCA | ||
| 56208.1930 | 14592304 | CAHA/BUSCA | ||
| 56209.1754 | 14677188 | CAHA/BUSCA | ||
| 56205.1849 | 14332405 | CAHA/BUSCA | ||
| 56206.1974 | 14419882 | CAHA/BUSCA | ||
| 56208.1930 | 14592304 | CAHA/BUSCA | ||
| 56209.1754 | 14677188 | CAHA/BUSCA | ||
| 56245.1818 | 17788140 | LT/IO:O | ||
| 56254.1677 | 18564517 | LT/IO:O | ||
| 56270.1558 | 19945888 | LT/IO:O | ||
| 56275.1809 | 20380060 | LT/IO:O | ||
| 56277.2116 | 20555512 | LT/IO:O | ||
| 56279.0852 | 20717394 | LT/IO:O | ||
| 56282.2041 | 20986865 | LT/IO:O | ||
| 56283.0932 | 21063685 | LT/IO:O | ||
| 56284.1360 | 21153781 | LT/IO:O | ||
| 56296.0438 | 22182616 | LT/IO:O | ||
| 56300.9702 | 22608259 | LT/IO:O | ||
| 56302.1352 | 22708908 | LT/IO:O | ||
| 56303.1084 | 22792994 | LT/IO:O | ||
| 56303.9884 | 22869026 | LT/IO:O | ||
| 56305.0037 | 22956752 | LT/IO:O | ||
| 56306.0300 | 23045418 | LT/IO:O | ||
| 56310.0862 | 23395876 | LT/IO:O | ||
| 56310.9812 | 23473205 | LT/IO:O | ||
| 56312.1042 | 23570230 | LT/IO:O | ||
| 56360.9795 | 27793059 | LT/IO:O | ||
| 56364.8835 | 28130364 | LT/IO:O | ||
| 56365.9379 | 28221466 | LT/IO:O | ||
| 56370.9299 | 28652774 | LT/IO:O | ||
| 56309.4711 | 23342731 | Gemini-N/GMOS | ||
| 56309.4704 | 23342671 | Gemini-N/GMOS | ||
| 56309.4624 | 23341981 | Gemini-N/GMOS |
Appendix C X-shooter spectra of the afterglow and host galaxy’s nucleus