Low-Mass X-ray Binaries and Globular Clusters
Streamers and Arcs in NGC4278.
Abstract
We report significant inhomogeneities in the projected two-dimensional (2D) spatial distributions of Low-Mass X-ray Binaries (LMXBs) and Globular Clusters (GCs) of the intermediate mass elliptical galaxy NGC4278. In the inner region of NGC4278, a significant arc-like excess of LMXBs extending south of the center at in the western side of the galaxy can be associated to a similar over-density of the spatial distribution of red GCs from Brassington et al. (2009). Using a recent catalog of GCs produced by Usher et al. (2013) and covering the whole field of the NGC4278 galaxy, we have discovered two other significant density structures outside the isophote to the W and E of the center of NGC4278, associated to an over-density and an under-density respectively. We discuss the nature of these structures in the context of the similar spatial inhomogeneities discovered in the LMXBs and GCs populations of NGC4649 and NGC4261, respectively. These features suggest streamers from disrupted and accreted dwarf companions.
1. Introduction
This is the third paper in a series analyzing the two-dimensional (2D) distribution of GC systems in elliptical galaxies. We first reported the discovery of spiral-like features in the 2D distribution of the GCs of NGC4261 with a K-Nearest-Neighbor (KNN) technique supplemented by Monte Carlo simulations (D’Abrusco et al., 2013a). We then investigated the GC system of NGC4649 (D’Abrusco et al., 2013b), detecting highly significant spatial inhomogeneities. These results are qualitatively in agreement with the discovery of complex GC systems in M87 (Strader et al., 2011) and NGC4365 (Blom et al., 2012) and reinforce the notion that merging and accretion of satellites are important in the evolution of galaxies, as predicted by the CDM theory (e.g., Di Matteo et al., 2005).
As is the case for GCs, low-mass X-ray binaries (LMXBs) can also be detected individually in elliptical galaxies, with Chandra (see review, Fabbiano, 2006), providing another potential marker of galaxy evolution. These LMXBs may originate both from the evolution of native stellar binary systems, or be formed by dynamical interactions in GCs (Grindlay et al., 1984; Verbunt & van den Heuvel, 1995). In NGC4649, in addition to the inhomogeneities of the GC system, we have also seen a non-uniform distribution in the LMXBs (D’Abrusco et al., 2013b). Some LMXBs are associated with GCs, and therefore, not surprisingly, follow the same spatial distribution, but uncorrelated inhomogeneities are also observed in LMXBs in the stellar field of NGC4649. These results have potential implications for our understanding of both LMXB formation and the general evolution of the parent galaxy. It is therefore important to establish how frequent their occurrence may be.
Here we report the case of a third galaxy, NGC4278, where we have been able to detect significant inhomogeneity in both the LMXB and the GC 2D distributions. NGC4278 is an elliptical galaxy at a distance of Mpc (Tonry et al., 2001), which was the subject of deep Chandra observations, resulting in a well-characterized catalog of LMXBs (Brassington et al., 2009, hereinafter B09). This galaxy is an intermediate-size elliptical, with stellar mass smaller than the giant elliptical NGC4261 and NGC4649 (see Boroson et al., 2011, for a compilation of properties), which were the subjects of companion studies (D’Abrusco et al., 2013a, b). The spatial 2D distribution of LMXBs in NGC4278 (see Figure 1 in B09) suggests an arc-like feature and possible “streamers”, motivating the present investigation.
While the entire galaxy was covered with Chandra, only the central region had been observed with HST at the time (Kundu & Whitmore, 2001), resulting in LMXB-GC identifications for the joint Chandra-HST coverage region. New HST observations of a field covering the entire NGC4278 and the nearby NGC4283 have recently become available (Usher et al., 2013) (hereinafter U13), complementing the GC coverage at larger radii. The positions of the U13 GCs suggest the presence of large-scale density structures. In order to get a comprehensive picture of the properties of the GCs population in NGC4278, in this paper we investigate the projected spatial distribution of both candidate U13 GCs and the GC catalog from B09.
We discuss the datasets in Section 2; we present the results of our analysis of the spatial distribution of LMXBs and GCs in the central region of the galaxy NGC4278 and at larger radii in Section 3, and examine their astrophysical implications in Section 4. We draw our conclusions in Section 5.
| LMXBs111In square brackets, the number of LMXBs located inside the isophote of NGC4278. In curly brackets, the number of GC-LMXBs associated to blue and red GCs respectively. In parenthesis, the number of LMXBs located outside the HST footprint. | 236[171] | 80{34/46} | 42(114) |
|---|---|---|---|
| GCs222Catalog of GCs from B09, covering the central region of NGC4278. | 266 | 121 | 145 |
| GCs333Catalog of GCs from U13, covering the whole field of the galaxy NGC4278. | 716 | 360 | 356 |
| Residuals | |||
|---|---|---|---|
| All GCs (redblue)444GC dataset from B09 | 3.3%(0.2%) | 0%(0%) | 0%(0%) |
| Red GCs | 0.2%(0.3%) | 0%(0%) | 0%(0%) |
| Blue GCs | 1.2%(0%) | 0%(0%) | 0%(0%) |
| All LMXBs | 12.3%(5.6%) | 2.5%(0%) | 1.2%(0%) |
| LMXBs in GCs | 9.8%(2.1%) | 1.8%(0.3%) | 0.2%(0%) |
| Field LMXBs | 19.5%(4.2%) | 1.4%(0.1%) | 0%(0%) |
| All GCs (redblue)555GC dataset from U13 | 1.9%(0.1%) | 0%(0%) | 0%(0%) |
| Red GCs | 7.8%(4.3%) | 2.5%(1.2%) | 0.4%(0%) |
| Blue GCs | 9.3%(5.4%) | 3.9%(2.0%) | 0.1%(0.1%) |
2. Data
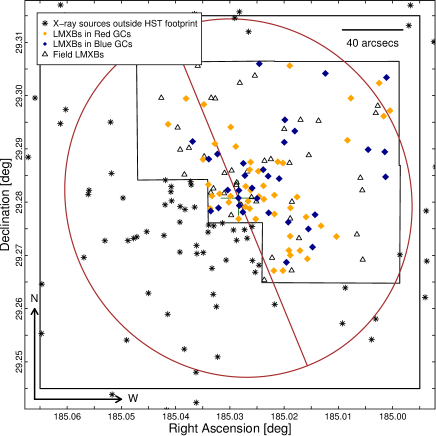
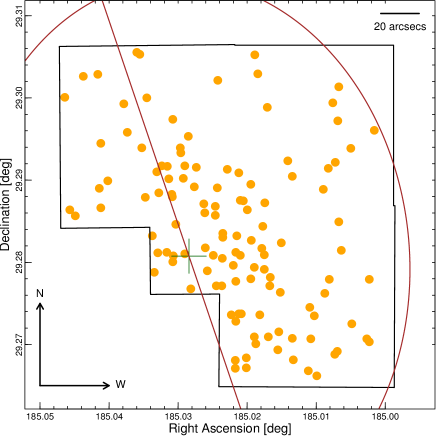
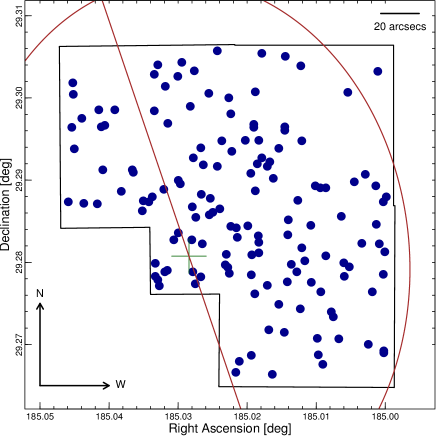
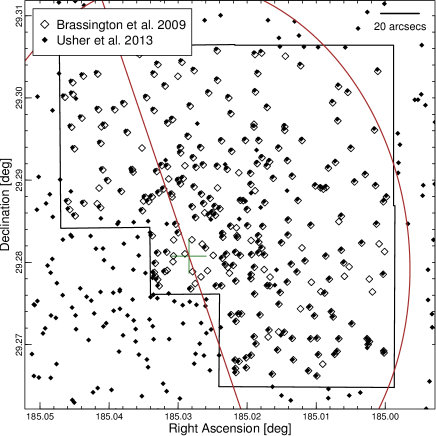
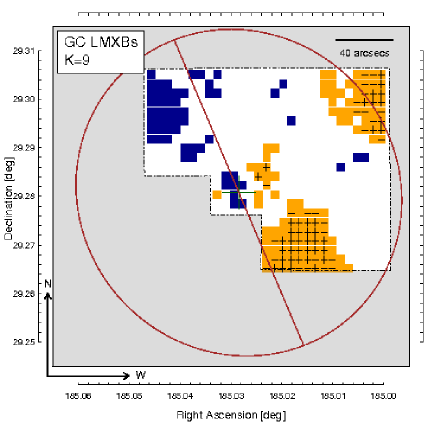
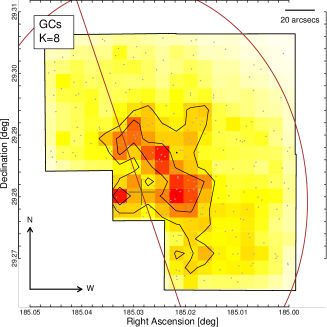
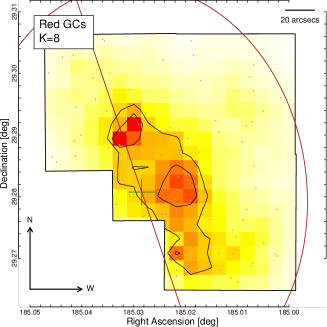
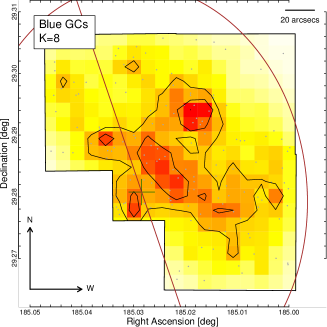
The B09 catalog lists 236 X-ray sources with 0.3-8.0 keV luminosities ranging from to ergs s-1, and also includes a list of GCs from a HST WFPC2 observation (Kundu & Whitmore, 2001), partially covering the galaxy (Table 1). Figure 1 shows the 2D distribution of these X-ray sources, which suggests some spatial features, in particular a region with a relative lack of LMXBs in the south between 25′′ and 40′′, followed by an arc-like region richer in LMXBs. Thirteen out of a total of 23 LMXBs located in the region of the arc are associated with red GCs, with 5 LMXBs associated to blue GCs and 5 field LMXBs. The 2D distributions of red (left) and blue (right) GCs separately are shown in Figure 2. The red GCs are centrally concentrated and sparse in the N-W corner of the observed region. They also seem to be approximately aligned along the major axis of the galaxy, with the exclusion of an over-density in the S-W corner of the footprint. The blue GCs, on the other hand, are more evenly distributed and do not show any clear over- or under-density.
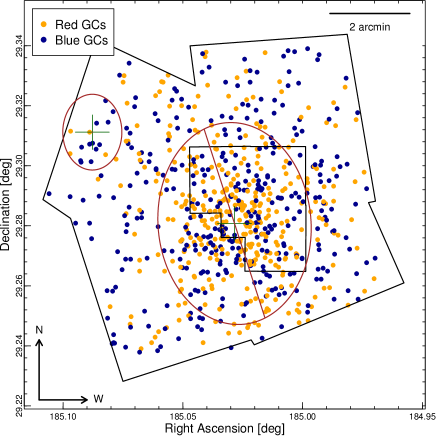
U13 used five archival HST ACS pointings to study the properties of the GC system in NGC4278 out to large radial distances. The sample of GC candidate was selected based on the color, the magnitude and the half-light radii of the sources extracted from the HST images. Contaminants were excluded using a sample of spectroscopically confirmed GCs to determine the optimal selection and by visual inspection of all GC candidates whose half-light radii exceeded 10 pc (U13). The final catalog of U13 GC candidates, which is virtually free from contamination, contains 716 sources. U13 found that the GC candidates follow a bimodal color distribution, and the red and blue classes can be separated using a color threshold , leading to 370 red GCs and 346 blue GCs (see Table 1). The spatial distribution of U13 GCs (Figure 3, left) shows that the red subpopulation is more centrally concentrated than the blue subpopulation, as commonly observed in elliptical galaxies (see e.g. Strader et al., 2006). U13 also checked the azimuthal distribution of GCs in the regions of NGC4278 with complete coverage (), finding that the whole population of GCs and the two color classes separately are all consistent with a uniformly random azimuthal distribution. Figure 3 (right) compares the positions of the GCs from B09 with those of the U13 common area. The two distributions are similar on the region of overlap, except for the core of the galaxy where the U13 catalog seems to be affected by a larger incompleteness than the catalog used by B09. The overall agreement between the two GC catalogs shows that hidden systematics are not likely to affect our results. As for the LMXB data, any incompleteness effect would have only a radial dependence, because of the radial worsening of the Chandra PSF and of the source crowding in the center. These effects will not affect any 2D inhomogeneity.
3. Analysis & Results
We have analyzed the 2D distributions of LMXBs and GCs, following D’Abrusco et al. (2013a), where a detailed explanation of the method used in this paper is given. In brief, for each sample of LMXBs and GCs, we have first generated density maps using the K-Nearest Neighbor (KNN) method of Dressler (1980). This density is based on the local distribution of GCs, i.e. on the distance of the -th closest GCs from the points where the density is estimated. We have evaluated the density in each knot of a regular grid covering the region of the sky where GCs and LMXBs are found. For a given value, the point-density is estimated as:
| (1) |
where is the index of the nearest neighbor used to calculate the density and is the area of the circle with radius equal to the distance of the -th nearest neighbor . The uncertainty on the KNN density scales with the square root of K, so that the relative fractional error is inversely proportional to the square root of . In other words, the fractional accuracy of the method increases with increasing at the expense of the spatial resolution. In this paper, we have reconstructed the density maps of the samples considered using values of ranging from 2 to 10. While the “optimal” value of depends on the typical size (expressed as number of members) of the spatial structures that we want to highlight, this number cannot be determined a priori. For this reason, we consider an interval of “reasonable” values that are roughly proportional to the average density of sources of the samples for which the density maps are reconstructed. Moreover, large values of would result in over- and under-density structures that are smoothed over large areas and that have lost part of the spatial information they carry.
We produced residual maps, by subtracting from the observed density maps a smooth distribution based on the observed radial number density profiles. Using the smooth distribution as seed for Monte Carlo simulations, we have then estimated the statistical significance of any inhomogeneities apparent in the residual map. Given the relatively sparse data we have used 5000 simulations in each case. Table 2 shows the percentage of simulated distributions of LMXBs and GCs with “extreme” number of pixels, i.e. with density values exceeding those of the 90% of pixels in the observed density map. The fraction of spatially clustered simulated distributions of GCs and LMXBs from B09 becomes negligible for and respectively, while the same fractions for all GCs and red/blue U13 GCs become consistent with zero for and respectively.
| LMXBs | All GCs | Red GCs | Blue GCs | |
|---|---|---|---|---|
| A | () | () | () | |
| B | () | () | () | |
| C | () | () | () | |
| D | - | - | - | |
| E | - | - | - | |
| F | - | - | - | |
| G | - | |||
| H | - | |||
| I | - | |||
| L | - | |||
| M | - |
3.1. LMXBs and GCs in the central region
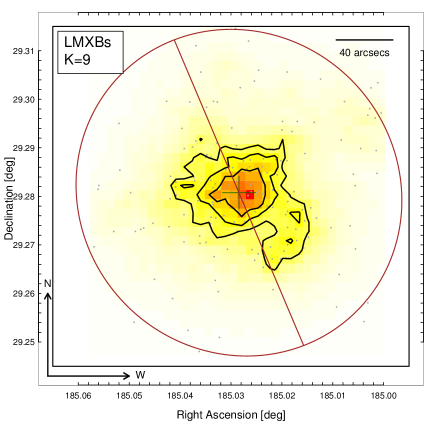
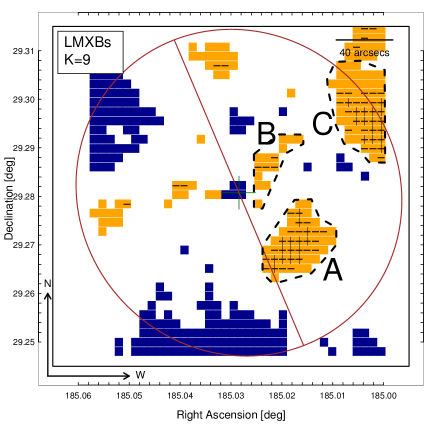
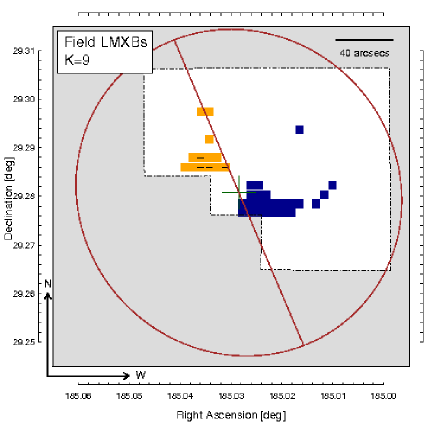
Here we discuss the results of the residual maps obtained using the B09 LMXBs and GC samples. Figure 4 shows the results for the LMXB distribution. The density map (left) shows that LMXBs are centrally concentrated, with one significant over-density located along the southern major axis and extending west-ward. The existence of this over-density is confirmed by the pixel map of residuals with significance larger than (right, Figure 4). In particular, the “arc” at in the SW quadrant, indicated as “A” in Figure 4, is significant. We calculate the significance of a each single feature by counting the fraction of simulated distributions of LMXBs or GCs with groups of spatially clustered pixels with similar average significance. We found that the radial “streamer” extending to the NW of the center of the galaxy, indicated as “B” in the Figure 4, has significance. The other two apparent “streamers” point towards E and N, but their statistical significance is low. Repeating the analysis for GC and field LMXBs (within the HST footprint) separately (Figure 5), we only find an excess corresponding to the “arc” with the red GCs.
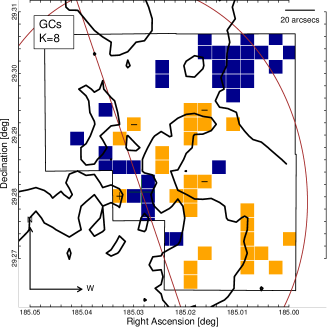
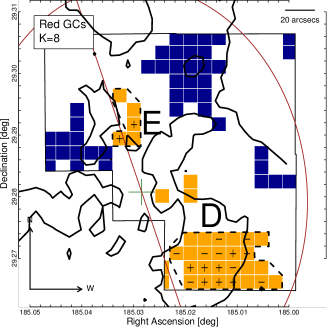
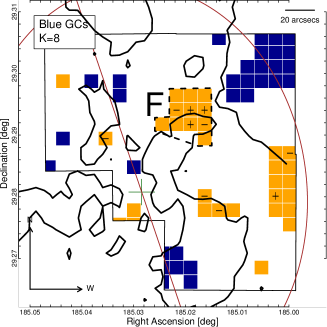
Distinct 2D features can also be seen in the GC distribution, at higher overall statistical significance. Figure 6 shows the density maps (upper panels) and residual maps (lower panels) for all, red and blue GCs respectively. The residual map of the entire (red blue) GCs sample does not displays significant inhomogeneities, while the residual maps for red and blue GCs (obtained for for ) show clear localized over-densities. As already discussed in Section 2, the red GCs follow the direction of the major axis of NGC4278, while blue GCs tend to cluster at larger radial distances. Significant excesses of red GCs can be seen in the mid-lower panel in Figure 6 in the area of the LMXB arc (, “D”), and, with a lower significance, just north of the region of the NW LMXB streamer (, “E”). The significance map for blue GCs (lower-right panel in Figure 6) shows one moderately significant over-density (, “F”) overlapping the position of LMXBs “streamer” indicated as “B” in Figure 4. A summary of the significances of the main over-density structures seen in the LMXBS and GCs residual maps (right plot in Figure 4 and lower mid and right plots in Figure 6 respectively) is presented in Table 3.
3.2. The GC distribution at larger radii
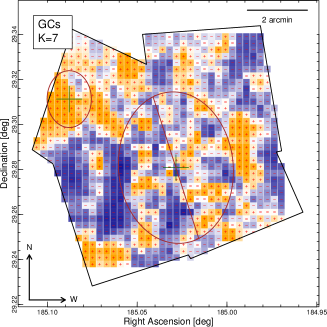
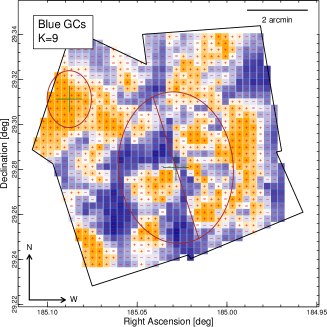
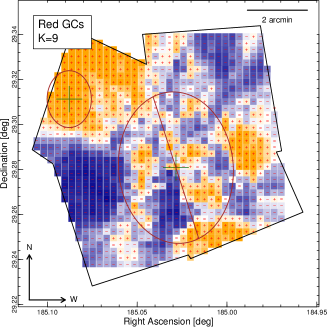
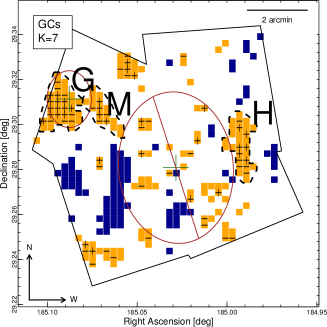
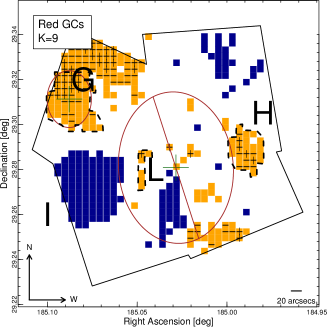
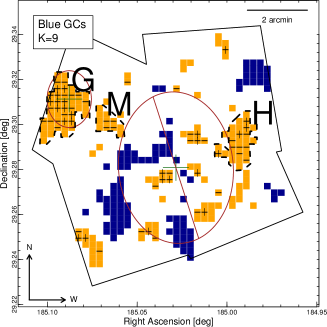
Using U13, we produced density and residual maps of the entire sample of GCs and of the two color classes obtained with the threshold for values of ranging from 2 to 10 (see Section 3 for more details) and with simulations. The probability of a simulated map showing the same number of “extreme” pixels of the observed density map becomes negligible for and for all and red/blue GCs, respectively. The residual maps for all, red and blue U13 GCs are shown in Figure 7 (upper panels). The most significant features of the residual maps (clearly shown in the maps of the significance pixels - mid panel in Figure 7) are the large over-density associated to the region occupied by the nearby galaxy NGC4283 in the N-E corner of the observed field (“G”), the significant over-density along the on the W side of NGC4278 (“H”), and the large under-density located on the E side of the NGC4278 galaxy, south of the NGC4283 galaxy (“I”). All of these structures are clearly visible in the residual maps generated either using the entire GC sample or the two colors sub-samples, with significance larger than 8 in all three cases. A peculiar but less significant structure ( for all GCs, for red GCs), located within the isophote of the NGC4278 galaxy and west of the center of the galaxy (“L”), is visibile in the residual maps produced using all GCs and red GCs. This elongated structure is similar to the “streamer” (“B”) identified in the residual map of the sample of LMXBs from the catalog presented by B09 (see Figure 4). While this structure is not significant per se, the fact that it is close to a high-significance under-density makes it unlikely that it is due to a random density contrast. Another feature that seems to point towards the center of NGC4278 is clearly visible in the residual map generated from the entire GCs sample (“M” in lower-left plot of Figure 7). This over-density is significant at a level in the residual map of all GCs and at a level in the residual map generated by blue GCs shown in Figure 7 (lower right).
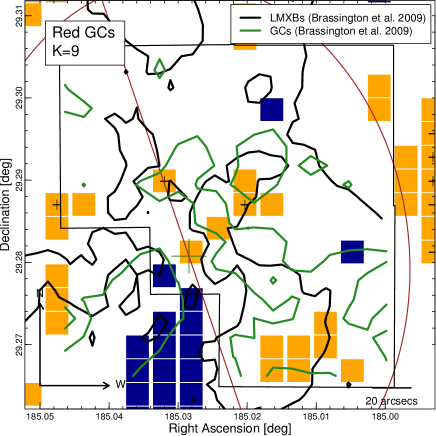
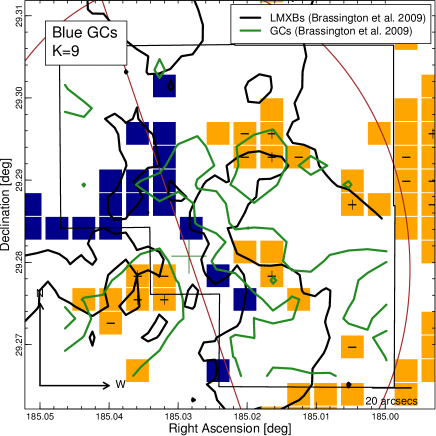
Figure 8 shows the position of the pixels associated to residuals for the red GCs (left) and the blue GCs (right) for in the region of the field covering the region of NGC4278 covered by the samples of GCs and LMXBs from B09. The solid black and green lines represent the contours of the over-density in the residual maps of the LMXBs and GCs of the B09 paper. Even though the pixels in the significance maps produced with U13 GCs are not as spatially clustered as in the maps generated from the B09 GCs, they are mostly located within the outlines of the structures from the residuals maps of LMXBs and GCs from B09 (compare with pixels occupied by over-densities in Figure 4 and Figure 6 for LMXBs and GCs respectively). In more detail, a group of positive residual pixels in the red GCs map are located in the external region of the arc feature (S-W of the center of NGC4278). Another less significant structure is approximately placed along the N-E streamer. In the residual maps generated with the blue GCs, a fairly significant over-density () is located on the N tip of the streamer feature, while few positive pixels overlap the innermost section of the S-W arc.
4. Discussion
Our analysis demonstrates the presence of significant inhomogeneity in the projected spatial distribution of LMXBs in NGC4278, including an arc to the south of the nucleus, a radial streamer, and an over-density at large radii. These features are reminiscent of those reported in the elliptical galaxies NGC4261 (Zezas et al., 2003) and NGC4649 (D’Abrusco et al., 2013b). The study of the 2D distribution of LMXBs in NGC4261 (Zezas et al., 2003) was based on a relatively short single Chandra observation, leading to the detection of a small number of highly luminous sources. These results may be questioned by following deeper studies because of source variability (A. Zezas, work in preparation). In the case of both NGC4278 and NGC4649 the lists of LMXBs were derived from the analysis of several coadded deep observations taken over varied time spans, which would average over variability effects. Moreover, in NGC4278 a later snapshot, not included in B09, was obtained to study long-term variability of luminous LMXBs (Brassington et al., 2012). The full data set confirms the spatial features discussed in this paper (see Figure 1 of Pellegrini et al. (2012)).
The arc and the over-density at large radii are seen only in the 2D distribution of LMXBs associated with GCs. The 2D spatial distributions of red and blue GCs also show significant features. In particular, within the central region of the galaxy, an over-density in the red GC distribution is coincident with the LMXB arc, and features can also be seen loosely correlated with the LMXB streamer. At larger radii, apart from a significant over-density of GCs associated with the position of the galaxy NGC4283, two main features dominate the spatial distribution of GCs: a significant under-density region located E of NGC4278 and close to the isophote of NGC4283, most evident in the red GCs map, and a significant over-density on the W side of NGC4278, which is clearly visible in all residual maps.
As discussed in our previous work (Zezas et al., 2003; Bonfini et al., 2012; D’Abrusco et al., 2013a, b), these spatial features are strongly suggestive of the effects of galaxy growth by accretion of satellites and merging with neighboring galaxies. These phenomena have been observed in our Local Group, and are connected with streams of GCs (e.g., Belokurov et al., 2006; Ibata et al., 1994; McConnachie et al., 2009). GCs are likely to be the individually detectable fossil remnants of these events in more distant galaxies (see e.g., the simulation of Peñarrubia et al., 2009). Similarly, X-ray binaries are also individually detectable tracers of their parent stellar population (Fabbiano, 2006).
The three elliptical galaxies we have investigated so far, present a range of properties. NGC4261 and NGC4649 are giant ellipticals with , while NGC4278 is of intermediate stellar mass, with (de Vaucouleurs et al., 1991); all of them have old stellar populations, with ages ranging from 12 to 16.3 Gy (see compilation in Boroson et al., 2011). While NGC4649 is in Virgo, NGC4261 and NGC4278 are in small groups (see Garcia, 1993). NGC4261 hosts a luminous radio AGN (3C270, Birkinshaw & Davies, 1985), NGC4649 hosts a low-luminosity nuclear radio source (Dressel & Wilson, 1985) and NGC4278 has a LINER nucleus, which is also detected in the radio (Younes et al., 2010; Terashima & Wilson, 2003). Of the three galaxies, NGC4649 is the only one associated with a prominent luminous extended hot halo (e.g., Humphrey et al., 2013).
These three galaxies all present some sign of merging or accretion of external matter, other than our results: NGC4261 has clear boxy isophotes (Nieto & Bender, 1989), usually suggestive of merging (Kormendy & Bender, 1996). Recent kinematical measurements (Arnold et al., 2013) suggest that NGC4649 might be a major dry merger remnant, showing disk-like outer rotation, which suggests a massive lenticular galaxy (S0) progenitor. NGC4649 has a near neighbor, the spiral galaxy NGC4647, with which it is likely to be tidally interacting (de Grijs & Robertson, 2006). Both NGC4261 and NGC4649 are early-type SuperNova (SN) Ia host galaxies. SN 1939B, located close to the outer side of the large-scale arc structure of GCs discussed by (D’Abrusco et al., 2013a) in the S-W quadrant of NGC4261, was discovered by Zwicky & Minkowsky (1939) and was later classified as type Ia SN. Type Ia SN 2004W (Moore et al., 2004) was located 51.6′′ W and 78.7′′ S of the nucleus of NGC4649, where a low significance over-density of GCs has been determined (see right plot in Figure 3 of D’Abrusco et al. (2013b)). The presence of type Ia SNs in these two galaxies hints at intermediate age stellar population that could be linked to past merger and/or interaction events. NGC4278 is relatively more isolated, although also has a near neighbor, NGC4283. Moreover, it has a complex multi-phase ISM (see Pellegrini et al., 2012).
NGC4278 has a large massive HI ring, extending for 37 kpc (Raimond et al., 1981), which may be slowly accreting (Morganti et al., 2006). This disk extends down to 1 kpc, where a ionized rotating disk is found (Sarzi et al., 2006). Morganti et al. (2006) show that the HI ring in NGC4278 has a complex structure, with two faint tail-like structures at large radii, pointing towards S-W and N-E of the center of the galaxy respectively (see Figure 1 in Morganti et al. (2006)). While both HI tails are more spatially extended than the over-densities in the GCs and LMXBs distributions discussed in this paper, we notice that the GCs over-density H (lower panels of Figure 7) overlaps the base on the S-W HI tail-like structure. Morganti et al. (2006) discuss the origin of the neutral gas in early-type galaxies, arguing that while merger or accretion events are thought to be the origin of some of the structures observed in the spatial distribution of HI, the lack of perturbation in the stellar population of some galaxies suggests that cold accretion from the Inter-Galactic Matter (IGM) could also be responsible for the presence of neutral gas. The HI disk in NGC4278 is co-located with a disk of X-ray emission and with complex and irregular dusty filaments, which may be streaming towards the nucleus (Pellegrini, 2011; Lauer et al., 2005; Tang et al., 2011). These features have also been interpreted as due to slow accretion of the HI gas, unaccompanied by star formation, given the old stellar population age; the X-ray disk may be the result of conduction heating of the incoming material by a more diffuse hotter X-ray emitting ISM (Pellegrini, 2011, and references therein). However, the inhomogeneity we have discovered tells a different, perhaps complementary, story. Given the old stellar age and the regular appearance of the stellar spheroid, any LMXBs originating for the evolution of native binary systems in the stellar field, ought to be distributed smoothly, closely following the stellar surface brightness. If the GC populations themselves were also formed early in the history of NGC4278, the same would hold for the distribution of GCs and their associated LMXBs. While this is true overall in the radial distribution of LMXB number density (see Figure 4 of B09), our results clearly show that there are local perturbations to this picture. Therefore some of the accretion events in NGC4278 may have involved the disruption of dwarf companions or perhaps result in some localized star formation, that while not visible against the preponderant old stellar population may be revealed by the LMXB and GC inhomogeneities.
5. Summary and Conclusions
We have discovered statistically significant spatial inhomogeneities in the 2D distributions of LMXBs and GCs in the intermediate mass elliptical NGC4278. In particular, in the inner region of the galaxy we detect an arc-like feature in the LMXB distribution, which is also reflected in a local over-density of the 2D distribution of red GCs. At larger radii, the distribution of GCs is dominated by a very significant over-density likely associated to the nearby galaxy NGC4283. Two other significant density structures are visible outside of the isophote to the W and E of the center of NGC4278, associated to an over-density and an under-density respectively.
These features are suggestive of streamers from disrupted and accreted dwarf companions, of which LMXBs and GCs may be the fossil remnants. NGC4278 is the third galaxy where we have detected this type of feature. Similarly for two previous cases, NGC4261 (D’Abrusco et al., 2013a) and NGC4649 (D’Abrusco et al., 2013b), the availability of observations has provided us with the ability to characterize the whole GC population of the galaxy and thereby identify the large-scale disturbances with the system. Our exploratory work begs the question of how frequent these features may be. If they are common, they may revealed widespread continuing galaxy evolution by accretion, in agreement with the predictions of the CDM theory (Di Matteo et al., 2005). We have demonstrated that the study of the 2D distributions of GCs systems (and LMXBs, when available) is a valuable tool in these investigations. The next step will be to obtain good systematic optical coverage of a well chosen sample of elliptical galaxies.
References
- Arnold et al. (2013) Arnold, J. A., Romanowsky, A. J., Brodie, J. P., et al. 2013, arXiv:1310.2607
- Belokurov et al. (2006) Belokurov, V., Zucker, D. B., Evans, N. W., et al. 2006, ApJ, 647, L111
- Birkinshaw & Davies (1985) Birkinshaw, M., & Davies, R. L. 1985, ApJ, 291, 32
- Blom et al. (2012) Blom, C., Forbes, D. A., Brodie, J. P., et al. 2012, MNRAS, 426, 1959
- Bonfini et al. (2012) Bonfini, P., Zezas, A., Birkinshaw, M., et al. 2012, MNRAS, 421, 2872
- Boroson et al. (2011) Boroson, B., Kim, D.-W., & Fabbiano, G. 2011, ApJ, 729, 12
- Brassington et al. (2009) Brassington, N. J., Fabbiano, G., Kim, D.-W., et al. 2009, ApJS, 181, 605
- Brassington et al. (2012) Brassington, N. J., Fabbiano, G., Zezas, A., et al. 2012, ApJ, 755, 162
- D’Abrusco et al. (2013a) D’Abrusco, R., Fabbiano, G., Strader, J., et al. 2013, ApJ, 773, 87
- D’Abrusco et al. (2013b) D’Abrusco, R., Fabbiano, G., et al., sub. to ApJ
- de Vaucouleurs et al. (1991) de Vaucouleurs, G., de Vaucouleurs, A., Corwin, H. G., Jr., et al. 1991, S&T, 82, 621
- de Grijs & Robertson (2006) de Grijs, R., & Robertson, A. R. I. 2006, A&A, 460, 493
- Di Matteo et al. (2005) Di Matteo, T., Springel, V., & Hernquist, L. 2005, Nature, 433, 604
- Dressel & Wilson (1985) Dressel, L. L., & Wilson, A. S. 1985, ApJ, 291, 668
- Dressler (1980) Dressler, A. 1980, ApJ, 236, 351
- Fabbiano (2006) Fabbiano, G. 2006, ARA&A, 44, 323
- Fabbiano et al. (2010) Fabbiano, G., Brassington, N. J., Lentati, L., et al. 2010, ApJ, 725, 1824
- Garcia (1993) Garcia, A. M. 1993, A&AS, 100, 47
- Grindlay et al. (1984) Grindlay, J. E., Hertz, P., Steiner, J. E., Murray, S. S., & Lightman, A. P. 1984, ApJ, 282, L13
- Humphrey et al. (2013) Humphrey, P. J., Buote, D. A., Brighenti, F., Gebhardt, K., & Mathews, W. G. 2013, MNRAS, 430, 1516
- Ibata et al. (1994) Ibata, R. A., Gilmore, G., & Irwin, M. J. 1994, Nature, 370, 194
- Khochfar et al. (2011) Khochfar, S., Emsellem, E., Serra, P., et al. 2011, MNRAS, 417, 845
- Kormendy & Bender (1996) Kormendy, J., & Bender, R. 1996, ApJ, 464, L119
- Kundu & Whitmore (2001) Kundu, A., & Whitmore, B. C. 2001, AJ, 121, 2950
- Lauer et al. (2005) Lauer, T. R., Faber, S. M., Gebhardt, K., et al. 2005, AJ, 129, 2138
- McConnachie et al. (2009) McConnachie, A. W., Irwin, M. J., Ibata, R. A., et al. 2009, Nature, 461, 66
- Mineo et al. (2013) Mineo, S., Fabbiano, G., D’Abrusco, R., et al. 2013, arXiv:1306.6490
- Moore et al. (2004) Moore, M., Li, W., Filippenko, A. V., Chornock, R., & Foley, R. J. 2004, IAU Circ., 8286, 2
- Morganti et al. (2006) Morganti, R., de Zeeuw, P. T., Oosterloo, T. A., et al. 2006, MNRAS, 371, 157
- Nieto & Bender (1989) Nieto, J.-L., & Bender, R. 1989, A&A, 215, 266
- Pellegrini (2011) Pellegrini, S. 2011, ApJ, 738, 57
- Pellegrini et al. (2012) Pellegrini, S., Wang, J., Fabbiano, G., et al. 2012, ApJ, 758, 94
- Peñarrubia et al. (2009) Peñarrubia, J., Walker, M. G., & Gilmore, G. 2009, MNRAS, 399, 1275
- Raimond et al. (1981) Raimond, E., Faber, S. M., Gallagher, J. S., III, & Knapp, G. R. 1981, ApJ, 246, 708
- Sarzi et al. (2006) Sarzi, M., Falcón-Barroso, J., Davies, R. L., et al. 2006, MNRAS, 366, 1151
- Strader et al. (2006) Strader, J., Brodie, J. P., Spitler, L., & Beasley, M. A. 2006, AJ, 132, 2333
- Strader et al. (2011) Strader, J., Romanowsky, A. J., Brodie, J. P., et al. 2011, ApJS, 197, 33
- Tang et al. (2011) Tang, Y., Gu, Q., Zhang, S., & Tang, B. 2011, MNRAS, 414, 1827
- Terashima & Wilson (2003) Terashima, Y., & Wilson, A. S. 2003, ApJ, 583, 145
- Tonry et al. (2001) Tonry, J. L., Dressler, A., Blakeslee, J. P., et al. 2001, ApJ, 546, 681
- Verbunt & van den Heuvel (1995) Verbunt, F., & van den Heuvel, E. P. J. 1995, X-ray Binaries, 457
- Younes et al. (2010) Younes, G., Porquet, D., Sabra, B., et al. 2010, A&A, 517, A33
- Usher et al. (2013) Usher, C., Forbes, D. A., Spitler, L. R., et al. 2013, MNRAS, 2309
- Zezas et al. (2003) Zezas, A., Hernquist, L., Fabbiano, G., & Miller, J. 2003, ApJ, 599, L73
- Zwicky & Minkowsky (1939) Zwicky, F. & Minkowki, R. 1939, IAU Circ., 774, 1