Characterization of the Spin-1/2 Linear-Chain Ferromagnet CuAs2O4
Abstract
The magnetic and lattice properties of the =1/2 quantum-spin-chain ferromagnet, CuAs2O4, mineral name trippkeite, were investigated. The crystal structure of CuAs2O4 is characterized by the presence of corrugated CuO2 ribbon chains. Measurements of the magnetic susceptibility, heat capacity, electron paramagnetic resonance and Raman spectroscopy were performed. Our experiments conclusively show that a ferromagnetic transition occurs at 7.4 K. Ab initio DFT calculations reveal dominant ferromagnetic nearest-neighbor and weaker antiferromagnetic next-nearest-neighbor spin exchange interactions along the ribbon chains. The ratio of / is near -4, placing CuAs2O4 in close proximity to a quantum critical point in the - phase diagram. TMRG simulations used to analyze the magnetic susceptibility confirm this ratio. Single-crystal magnetization measurements indicate that a magnetic anisotropy forces the Cu2+ spins to lie in an easy plane perpendicular to the -axis. An analysis of the field and temperature dependent magnetization by modified Arrott plots reveals a 3d-XY critical behavior. Lattice perturbations induced by quasi-hydrostatic pressure and temperature were mapped via magnetization and Raman spectroscopy.
pacs:
61.50.Ks, 75.40.-s, 75.30.Et, 75.40.Cx, 75.50.Dd, 76.30.-v, 78.30.-jI Introduction
Low dimensional magnetic Cu2+ systems containing CuX2 ribbon chains have attracted a great deal of attention because of their unusual intrachain nearest- and next-nearest neighbor spin exchange relations. In such compounds it is frequently found that the spin exchange interactions between the Cu2+ (=1/2) ions are such that the next-nearest-neighbor (NNN) exchange is antiferromagnetic (AFM), the nearest-neighbor (NN) exchange is ferromagnetic (FM), and the NNN spin exchange is often considerably stronger than the NN spin exchange. Due to the inherent competition of the NN and NNN spin exchange interactions, the CuX2 ribbon chains tend to develop unusual AFM incommensurate spiral spin structuresGibson2004 ; Enderle2005 ; Capogna2005 ; Drechsler2007a ; Banks2009 ; Law2011 ; Lee2012 ; Willenberg2012 ; Wolter2012 and sometimes concomitantly multiferroic behavior.Naito2007 ; Schrettle2008 ; Yasui2008 ; Zhao2012 These CuX2 ribbon chains are formed by linking CuX4 basal-square-planes of axially elongated CuX6 (X = O, Cl, Br,…) octahedra together via their trans-edges.
The magnetic properties of the CuX2 ribbon chains are primarily determined by the ratio of the NN to NNN spin exchange parameters, and , with = /. However, at low temperatures additional interactions (e.g., smaller interchain spin exchange interactions) also become important. Interchain interactions usually drive the systems to long-range magnetic order, the exact details of which are often determined by additional weak magnetic anisotropies.Enderle2005 ; Mourigal2011 ; Mourigal2012 Over the last decade, much interest has been devoted to such ribbon chain systems with spin exchange parameters lying within the so-called frustrated regime, i.e., between the Majumdar-Ghosh point, = 2, and the ’FM point’, = -4. A first-order phase transition to a FM ground is expected at = -4 and hence, it constitutes a quantum critical point (QCP) in the vicinity of which small perturbations, such as interchain exchange and anisotropic exchange couplings, may induce a pronounced response of the system.Bursill1995 ; White1996 ; Sachdev1999
Several CuO2 ribbon chain systems with -4 have been investigated, none of which undergoes long-range FM ordering at low temperatures. Some systems, such as Li2ZrCuO4 and PbCuSO4(OH)2 (linarite), prevent long-range FM ordering since they exhibit an AFM incommensurate spin-spiral structure along the ribbon chains.Drechsler2007b ; Schmitt2009 ; Willenberg2012 ; Wolter2012 Other systems, such as Ca2Y2Cu5O10 and Li2CuO2, do contain FM ribbon chains, however, weak interchain interactions force the FM-ribbon chains to align antiparallel, resulting in long-range AFM ordering.Matsuda2001 ; Kuzian2012 ; Sapina1990 ; Boehm1998 ; Xiang2007 ; Drechsler2010 In the case of Li2CuO2, the absence of a spiral magnetic order in the ribbon chains is understood to be a consequence of order by disorder arising from interchain interactions.Xiang2007 In all these cases, it appears that either magnetic spiral ordering or weak interchain interactions drive the systems to long-range AFM ordering. It also appears to be possible for such systems not to exhibit a magnetic long-range ordering at all. For example, the system Rb2Cu2Mo3O12, with -2.7, does not undergo long-range magnetic ordering down to 2 K even though magnetic field induced ferroelectricity is observed below 8 K.Hase2004 ; Yasui2013
Here we describe the magnetic and lattice properties of a new system, trippkeite, featuring edge-sharing CuO2 ribbon chains. Trippkeite is an exceptional ribbon chain system because it shows a FM ground state below 7.4 K. Trippkeite is a natural mineral with the chemical composition CuAs2O4. A first investigation and description of the crystal structure of natural trippkeite, by Zemann in 1951, was based on the assumption that trippkeite is isotypic to schafarzikite, FeSb2O4.Zemann1951 In 1975, Pertlik employed hydrothermal synthesis to prepare small crystals of synthetic trippkeite and performed a full crystal structure determination which confirmed Zemann’s earlier results (see Figure 1).Pertlik1975 ; Pertlik1977 This investigation showed that trippkeite is isostructural to the family of compounds with the general composition MT2O4 (M2+ = Mg, Mn, Fe, Co, Ni, Zn; T3+ = As, Sb, Bi), with schafarzikite, FeSb2O4, being the most popular member.Kumada2009
Trippkeite crystallizes in a tetragonal structure (space group 42/) with lattice parameters = = 8.592(4) and = 5.573(4) .Pertlik1975 The Cu atoms are located on Wyckoff sites 4 and the As atoms on sites 8. The O atoms occupy Wyckoff sites 8(O1) and 8(O2). The Cu atoms are coordinated by elongated oxygen octahedra (Cu - O distances: 4 1.95 Å; 2 2.47 Å), which connect via trans-edges to form corrugated CuO2 ribbons. The O1 and O2 atoms are located at the apical and basal positions of the octahedra, respectively. The As atoms form AsO3 pyramids, which link the oxygen atoms in the basal planes with the apical oxygen atoms of neighboring chains such that the basal planes of neighboring chains are perpendicular to each other.Pertlik1975 The electrons of the As atoms act as pseudo-ligands and extend into the channels enclosed by four neighboring chains. Similar spacious structures are known to have a high susceptibility to structural phase transitions that can be induced by external pressure.Hinrichsen2006

II Experimental Details
Small wine-bottle-green crystals of CuAs2O4, approximately 1 mm3 in size, were prepared by hydrothermal synthesis as described in detail by Pertlik.Pertlik1977 Some of the crystals showed brownish impurity appendages, such crystals were discarded. Sample purity was checked by X-ray powder diffraction on crushed crystals. A STOE STADI-P diffractometer with Mo radiation, = 0.7093 Å, was used.
Temperature and magnetic field dependent magnetizations were measured with a Quantum Design, superconducting quantum interference device magnetometer (MPMS). A selection of randomly oriented crystals (mass 5.3 mg) were filled in a quartz glass tube, fixed with a minute amount of a fast drying varnish and measured between 1.85 K and 375 K. Directional dependent magnetizations versus field at constant temperatures were collected on a well defined large single crystal (mass 8 g), oriented by x-ray diffraction with the -axis parallel and perpendicular to the magnetic field.
Magnetization measurements under pressure were performed in a copper-beryllium pressure clamp cell providing hydrostatic pressure up to 1.2 GPa and using silicon oil as a pressure medium. The pressure was determined from the superconducting critical temperature of a high purity (99.999%) Sn sample located next to the CuAs2O4 sample within the pressure cell.Eiling1981
Heat capacity measurements were performed in a Quantum Design, physical property measurement system calorimeter (PPMS). A collection of randomly oriented crystals (mass 3.4 mg) were thermally anchored to the calorimeter platform using a minute amount of Apiezon N grease. The heat capacity of the sample platform with grease was determined in a preceding run and subtracted from the total heat capacities.
Raman spectra were measured with a Jobin Yvon Typ V 010 LabRAM single grating spectrometer with 1 cm-1 spectral resolution. The spectrometer setup was equipped with a double super razor edge filter, Peltier cooled CCD camera and a Mikrocryo cryostat with a copper cold finger. Measurements were performed with linearly polarized He/Ne gas laser light of 632.817 nm with 1mW of power. The light beam was focused to a 10 m spot on the top surface of the sample using a microscope. Orientated measurements were taken parallel and perpendicular to the -axis in temperatures ranging between 4 K and 325 K.
Electron paramagnetic resonance (EPR) measurements were carried out with a Bruker ER040XK X-band microwave spectrometer and Bruker BE25 magnet controlled by a BH15 field controller calibrated with Diphenylpicrylhydrazyl (DPPH). The spectra of a selection of non-oriented crystals (mass 4.5 mg) were collected with microwave radiation of 9.48 GHz in temperature cycles ranging from 15 K to 275 K.
III Theoretical Details
III.1 Spin Exchange Interactions
The intrachain spin exchange interactions, and , of CuAs2O4 were evaluated by performing energy-mapping analyses map1 ; map2 based on first principles DFT calculations for the three ordered spin states depicted in Figure 2. The energies of the three order states can be written in terms of the Heisenberg spin Hamiltonian;
| (1) |
where Jij are the exchange parameters for the coupling between spin sites i and j. According to the energy expressions for spin dimers with (= 1 in this case) unpaired spins per spin site Dai2001 ; Dai2003 , the total spin exchange energies of the three ordered spin states, per eight formula units (FUs), are expressed as summarized in Figure 2. We calculated the electronic energies of the three ordered spin states by employing the projected augmented-wave (PAW) methodBlochl1994 ; Kresse1999 encoded in the Vienna ab initio simulation package (VASP) Kresse1996 and the generalized gradient approximation (GGA) for the exchange and correlation functional. Perdew2008 The plane-wave cut-off energy was set to 400 eV and a set of 18 -points for the irreducible Brillouin zone was used. To probe the effect of electron correlations associated with the Cu 3 state, we performed DFT plus on-site repulsion (DFT+U) calculations with = 0, 4, 6 and 8 eV for Cu.Dudarev1998 By mapping the relative energies of the three ordered spin states obtained from our DFT+ calculations onto the corresponding Heisenberg Hamiltonian (Eq. (1)), we obtain the values of the nearest- and next-nearest neighbor spin exchange parameters, () and ().

| (eV) | (K) | (K) | (K) |
|---|---|---|---|
| 0 | 42.3 | -25.9 | 8.2 |
| 4 | 38.8 | -13.5 | 12.7 |
| 6 | 34.0 | -10.0 | 12.0 |
| 8 | 27.5 | -7.1 | 10.2 |
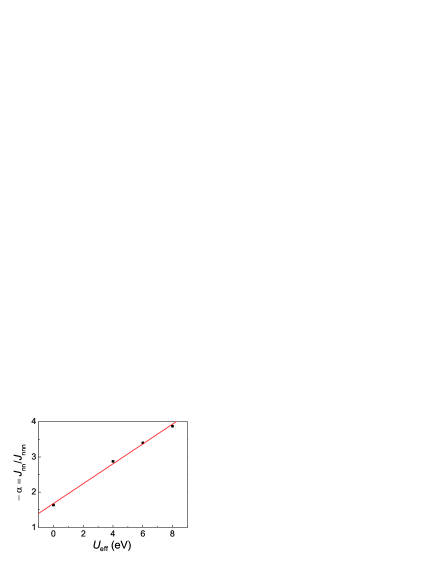
The results summarized in Table 1 show that the FM-NN spin exchange dominates over the AFM-NNN spin exchange. As shown in Figure 3, the ratio of the NN over the NNN spin exchanges increases with increasing values used in the DFT+ calculations. In general, the spin exchange between two spin sites (say, 1 and 2 represented by the magnetic orbitals and , respectively) is written as = + . The FM component increases when increasing the overlap density while the AFM component is proportional to and inversely proportional to .map1 ; map2 The magnetic orbital, - orbital, of the Cu2+ ion has large O 2 contributions. The strong FM-NN interaction in CuAs2O4 is traced to the fact that the bond angle of the Cu-O-Cu superexchange path is close to 90∘ ( 91.5∘) and the magnetic orbitals of the NN Cu2+ ions lead to a large overlap density around the bridging oxygen atoms.map2 The weaker AFM-NNN interaction is a consequence of the twisting of the CuO2 ribbon chains since it reduces the hopping integral between the NNN Cu2+ ions.
The Curie Weiss temperatures listed in Table 1 were calculated with the equation,
| (2) |
The ’s represent the NN and the NNN spin exchange interactions along the ribbon chains, and , respectively. is the number of neighbors with spin exchange in the NN and NNN shell, = = 2 for CuAs2O4. is positive if the spin exchange is predominantly FM. The calculated Curie-Weiss temperatures are positive, consistent with the experimental findings (see below). The values of 6 and 8 eV, most appropriate for Cu2+, indicate -3.9 -3.4 (see Fig. 3), close to the FM-QCP at = -4. Since the - magnetic orbitals of neighboring ribbon chains are largely orthogonal to each other, the interchain spin exchange interactions are expected to be small and not easily accessible with DFT calculations.
III.2 TMRG Calculations
The temperature dependent magnetic susceptibilities, (see Figure 4), of a NN–NNN spin exchange, Heisenberg =1/2 spin-chain was simulated via transfer-matrix density-matrix renormalization group (TMRG) calculations,Bursill1996 as implemented by Wang .Wang1997 A consistent set of parameters was used for the simulations of in the reduced temperature range 0.1 10 and the range -4.50 -3.50. 150 states were kept with =0.001, = 1 and a maximum trotter number of 4000. No difference was seen between 250 and 150 states down to =0.1 (not shown here), as such, 150 states were retained.

III.3 Lattice Properties
The lattice properties were obtained from DFT calculations using the VASP code combined with the phonon package.Parlinski The PAW scheme within the VASP package accommodates the full nodal character of an all-electron charge density in the core region. To achieve highly converged results with an accurate description of the electronic and dynamical properties, basis sets with plane waves up to a 520 eV cut-off energy were used. A GGA with PBEsol prescription was utilized to describe the exchange-correlation energy.Perdew2008 In order to obtain highly converged energies and forces, a dense special -point sampling for the integration of the Brillouin zone was performed. At each selected volume, the structures were fully relaxed to their equilibrium configurations through the calculation of the forces on the atoms and stress tensor.Mujica2003 Lattice-dynamic calculations of phonon modes were performed at the zone center (-point) of the Brillouin zone using the direct force-constant approach (or the supercell method).Parlinski1997 These calculations provide information about the symmetry of the modes and their polarization vectors, and also allowed us to identify the irreducible representations and the character of the phonon modes at the -point. The calculated Raman frequencies with their assigned symmetries are listed in Table 2 in comparison to the experimental observations.
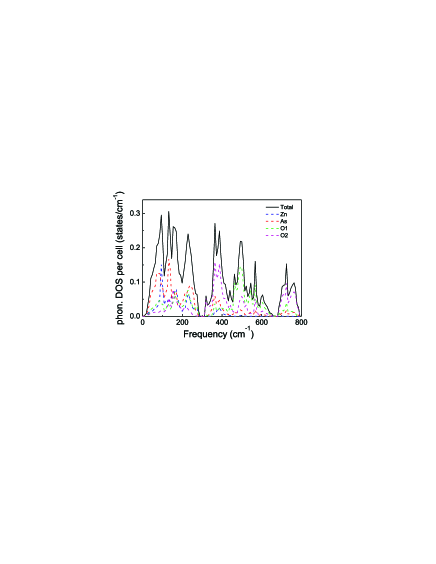
To gain more insight on the lattice properties of CuAs2O4, DFT-GGA and LDA calculations were performed for a hypothetical, diamagnetic compound ZnAs2O4, discarding any magnetic contributions. Figure 5 displays the total and partial phonon densities of states of the hypothetical compound ZnAs2O4. The phonon spectrum is characterized by a set of rather sharp bands indicating nearly localized lattice vibrations extending up to 800 cm-1. The set of phonon bands decomposes into three subgroups, one group below 300 cm-1, corresponding mainly to Zn and As vibrations with little contribution from O vibrations. Above 300 cm-1 two groups of phonon bands corresponding mainly to O vibrations with almost no contribution from the heavier Zn and As atoms. Vibrations related to O atoms in the basal plane of the distorted octahedra (O2) exhibit the highest vibrational frequencies.
IV Results and Discussion
IV.1 Raman Scattering
Raman spectroscopy is a sensitive technique which can be used to search for structural transformations. Raman spectra with light polarized along the crystal -axis were measured for various temperatures between 4 K and 325 K, see Figure 6. Our spectra are similar to that taken at room temperature by KharbishKharbish2012 with the exception of two additional peaks detected. Table 2 lists the results of the CuAs2O4 Raman spectra in comparison with data from Kharbish. The peak positions and symmetry assignments according to the GGA-LDA calculations are also given. As frequently observed for GGA and LDA calculations, the difference between the calculated and experimental wavenumbers is 5 - 7%.
There are no temperature induced peak splittings indicating that the crystal symmetry, and therefore crystal structure, remains unchanged across the FM transition and down to 4 K. Overall there is a slight increase in energies as the temperature is decreased reflecting the thermal lattice contraction. Peaks positioned at 403, 763, and 812 cm-1 (marked by arrows in Figure 6) become narrower and better resolved with decreasing temperature.

| Symmetry | 295 K | Kharbish(RT)Kharbish2012 | GGA | LDA |
|---|---|---|---|---|
| (GGA-LDA) | (cm-1) | (cm | (cm | (cm-1) |
| n.o. | n.o. | 23.2 | 28.9 | |
| n.o. | n.o. | 32.5 | 35.3 | |
| n.o. | n.o. | 98.9 | 105.3 | |
| 101.8 | n.o. | 103.9 | 107.9 | |
| n.o. | n.o. | 123.6 | 128.6 | |
| 134.9 | 136 | 127.2 | 136.5 | |
| 141.1 | 140 | 128.1 | 135.3 | |
| 183.6 | 184 | 174.9 | 179.4 | |
| 192.8 | 194 | 179.9 | 186.8 | |
| 204.7 | 205 | 194.5 | 204.3 | |
| 235.8 | 236 | 219.8 | 224.2 | |
| 275.7 | 277 | 255.1 | 264.0 | |
| 307.9 | n.o. | 281.0 | 286.3 | |
| n.o. | n.o. | 364.3 | 370.9 | |
| 371.3 | 372 | 374.6 | 381.4 | |
| 400.4 | 398 | 388.4 | 401.7 | |
| 421.8 | 423 | 410.7 | 419.0 | |
| 448.1 | 448 | 439.9 | 449.1 | |
| n.o. | n.o. | 477.4 | 481.3 | |
| 497.3 | 498 | 496.4 | 511.8 | |
| n.o. | n.o. | 509.9 | 514.2 | |
| 540.8 | 541 | 535.4 | 549.0 | |
| 659.5 | 659 | 625.6 | 644.7 | |
| 758.5 | 768 | 722.8 | 733.9 | |
| 781.5 | 782 | 731.9 | 743.2 | |
| 806.4 | 812 | 735.3 | 742.2 |
A contraction of the lattice will shorten the spin exchange paths, , between Cu spins and also alter the bonding angles, possibly differently for and , which may lead to a small alteration of . However, as evidenced by the low-temperature bulk properties shown below, the ferromagnetic spin exchange remains dominant leading to long-range FM ordering.
IV.2 Electron Paramagnetic Resonance
A typical EPR spectrum of a polycrystalline CuAs2O4 sample collected at 15 K and at a microwave frequency of 9.48 GHz is displayed in Figure 7. The spectrum can be very well modeled by a field derivative of a Lorentzian absorption resonance line taking into account resonances. The equation used to fit the spectra is as follows
| (3) |
where is the absorbed microwave power, is the half-width at half-maximum (HWHM), is the resonance field, and measures the degree of admixture of dispersion to the signal. Additionally, a background offset and a linear variation of the background signal with the field were taken into account for the fits. Very good agreement to Eq. (3) with the data could be achieved for = 0, as seen in Figure 7. The addition of a dispersion term ( 0) was not beneficial to the fits. The inset in Figure 7 shows how the -factor varies with temperature. Towards room-temperature the averaged -factor was calculated to be
This value is close to the expected average -factor for a Cu, = 1/2 system in an elongated octahedral environment and gives an effective magnetic moment of = 1.82 .Abragam1970 An analysis of the inverse EPR intensity versus temperature ( 150 K), shown in Figure 8, with a Curie-Weiss type temperature of 40 K. The positive indicates a predominant FM spin exchange in accordance with the positive magnetic susceptibility Curie-Weiss temperature (see below) and the DFT calculations. Below 150 K the inverse integrated intensity bends upwards, away from the Curie-Weiss type fit. A similar behavior is also seen in the inverse susceptibility data and discussed in detail below. The temperature dependence of the linewidth, shown in the Figure 8 inset, displays a broadening with temperatures above 50 K. Below 50 K the linewidth decreases which we attribute to a build-up of internal fields caused by magnetic short range ordering. These can also be a source of the temperature variation of the -factor along with minute changes of the crystal field due to the lattice contractions.


IV.3 Magnetization and Magnetic Susceptibility
The magnetic susceptibility as a function of temperature of a randomly oriented selection of CuAs2O4 crystals is displayed in Figure 9. At high temperatures the magnetic susceptibility follows a Curie-Weiss law according to
| (4) |
The Curie constant, , depends on the Avogadro number , the spin of the system =1/2, the Boltzmann constant , the -factor , and the Bohr magneton according to
| (5) |
The temperature independent term in Eq. (4), , represents a sum of the diamagnetic contributions, , from the closed electron shells and the van Vleck susceptibility, , arising from admixtures of the ground state wave functions into excited Cu electronic levels.
| (6) |
From the tabulated diamagnetic increments for individual ions, can be estimated to contribute -7710-6 cm3/mol.Selwood1956 The van Vleck susceptibility depends on the direction of the external field with respect to the crystal axes and the energy level separation. For a polycrystalline Cu2+ system, it typically amounts to values between +10010-6 cm3/mol and +12010-6 cm3/mol, resulting in a of approximately +4310-6 cm3/mol.Takigawa1989 ; Koo2011
The (red) solid line in Figure 9 shows a fit of the experimental inverse susceptibility to Eq. (4) obtained by varying the -factor and the Curie-Weiss temperature. The best fit to the data above 150 K was found with
The Curie-Weiss temperature from the fit was
indicating predominant FM spin exchange interactions, as also found by the EPR measurement.
The slight difference in the -factor obtained by the magnetic susceptibility measurement to that derived from the EPR measurement (see above) may be caused by unavoidable experimental errors and/or a minor -factor anisotropy .Abragam1970
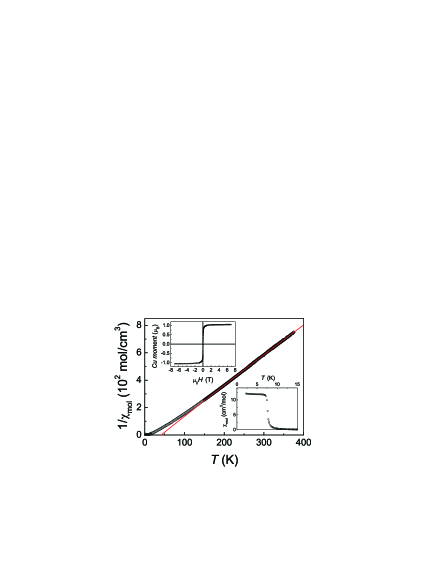
Below 8 K the magnetization rises sharply (see Figure 9 lower inset) indicative of a FM transition. The Curie temperature, , obtained from the inflection point of the susceptibility curve amounts to
An isothermal magnetization measured at 1.85 K, plotted in the upper inset of Figure 9, reveals saturation of the magnetization above a field of 2.5 T with a value of 1.050.01 . This saturation moment is in good agreement with the expected 1 value for a =1/2 system.
Below 150 K the inverse susceptibility noticeably bends upwards from the high-temperature Curie-Weiss law, similar to what has also been observed in the integrated signal intensity gained from the EPR spectroscopy experiment. The temperature dependence of the susceptibility over the whole temperature range, including the upward deviation from the high-temperature Curie-Weiss law, can be well modeled by the magnetic susceptibility of a Heisenberg chain with NN and NNN spin exchange interactions calculated with the TMRG code as described in detail above. Figure 10 displays our experimental data in comparison with the TMRG susceptibility results calculated for ratios -4.5 -3.5, a ferromagnetic NN spin exchange constant of -38 K and a -factor of =2.155, very close to the -factor obtained from the Curie-Weiss fit of the high-temperature susceptibility data.
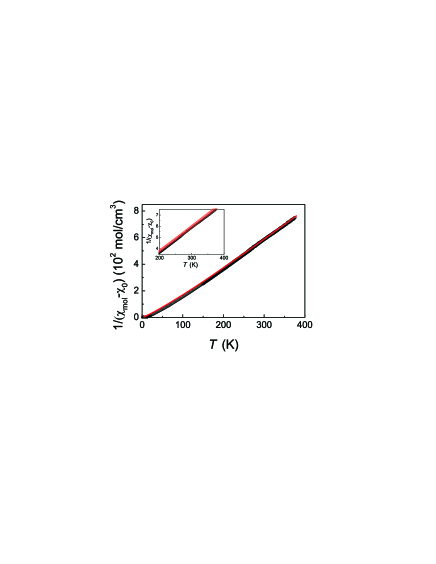
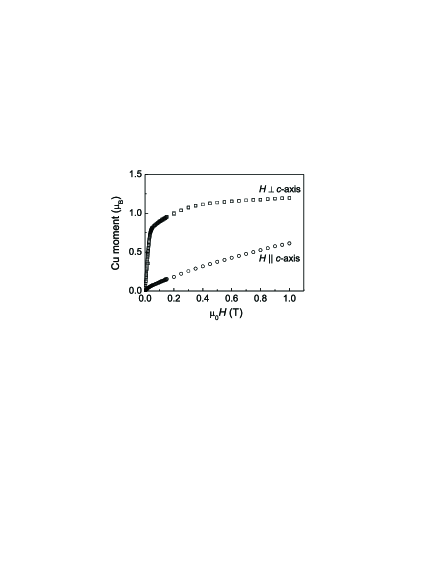
Figure 11 displays the magnetization at 1.85 K of a single crystal (8 2 g) oriented with the -axis parallel and perpendicular to the magnetic field. With the field perpendicular to the -axis, saturation is readily achieved above 0.5 T. With the field oriented along the -axis, saturation is not obtained at 1 T indicating the -axis to be a magnetic hard axis. The saturation moment is in fair agreement with an expected value of 1 , the slight excess can be attributed to errors in the mass determination of the crystal.
IV.4 Modified Arrott plots
An Arrott plot analysis of magnetization isotherms of a FM is a well-established method to determine the Curie temperature, , and the zero-field magnetic polarization. Arrott and Noakes proposed a modified equation of state which takes into account the critical exponents, and , of the magnetization and the magnetic susceptibility, respectively. The Arrott-Noakes equation of state is given byArrott1967
| (7) |
and are material constants which for CuAs2O4 amount to = 0.04 0.01 K and = 1.42 0.01 T. The critical exponents can be extracted from a representation of versus (, with the critical exponents adjusted such that the isotherms close to the Curie temperature follow a linear behavior. Such a modified Arrott-Noakes plot of CuAs2O4 is shown in Figure 12. The critical isotherm, which extrapolates to the origin of the graph, lies between the isotherms measured at 7.00 K and 7.50 K.
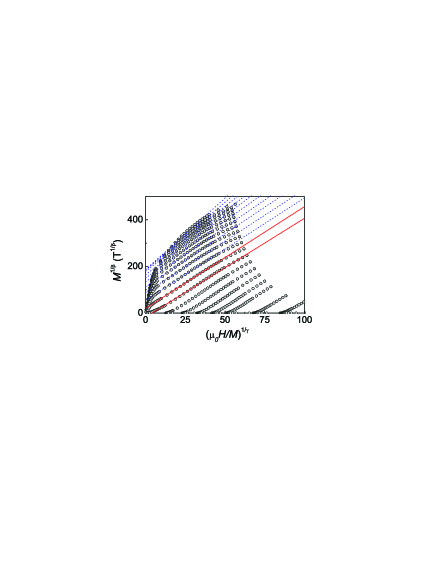
The best agreement with linear behavior for the isotherms near was obtained by adjusting the critical exponents to
and
The critical exponent for the magnetization is consistent with values for standard universality classes 3d-Heisenberg and 3d-XY, but within the experimental error does not allow for a differentiation between the two cases.Guillou1977 ; Guillou1980 ; Reisser1995 is clearly lower than the value expected for a 3d-Heisenberg model but is close to the value expected for a 3d-XY class.Guillou1977 ; Guillou1980 ; Reisser1995 This finding is consistent with the anisotropy seen in the single-crystal magnetization measurement indicating an easy-plane perpendicular to the -axis (see above).
Figure 13 displays the temperature dependence of the zero-field polarization as obtained by extrapolating the high-field data in the modified Arrott plot to 0. By fitting a critical power law according to
| (8) |
with fixed to 0.35 as shown in the Modified Arrott plot, a Curie temperature of
is extracted. This Curie temperature is in reasonable agreement with the magnetic susceptibility data.

IV.5 Pressure Dependence of
Pressure measurements of schafarzikite, FeSb2O4, initially showed the cell lattice parameters to decrease linearly for pressures below 3.5 GPa. At approximately 3.5 GPa and 7 GPa, structural phase transitions occurred, inducing a symmetry reduction from spacegroups 42/ via 21/ to 42/.Hinrichsen2006
Figure 14 displays the pressure dependence of the of CuAs2O4 . The increases linearly with pressure at a rate of
Evidence for pressure induced phase transitions has not been found up to 1.2 GPa.

Applying the pressure induced decrease of the lattice parameters observed for FeSb2O4 similarly to CuAs2O4, we expect apart from the reduction of the atomic distances, a decrease of the NN Cu - O - Cu bonding angle towards 90o. The effect of pressure on the O - O - O ’buckling’ angle, enclosed by the O atoms at the edge of the basal planes running along the -axis, is less pronounced. The decrease of atomic distances and the reduction of NN bonding angles will favor the FM-NN spin exchange which explains the increase of the Curie temperature observed experimentally.Bencini1990 Applying pressure decreases the spin exchange ratio , thus pushing the system further into the ferromagnetic regime.
IV.6 Heat Capacity
The results of the heat capacity measurements performed on a sample of randomly oriented CuAs2O4 crystals versus temperature and magnetic field are shown in Figure 15. In zero-field, a -shaped anomaly is clearly exhibited at 7.4 0.1K, which agrees with the preceding results from the magnetic data. Applying a magnetic field leads to a slight up-shift of the anomaly and at larger fields a broadening and suppression of the anomaly occur.

In order to subtract the lattice contribution to the heat capacity and extract the magnetic heat capacity, , we proceeded in two ways: i. We approximated the lattice contribution to the heat capacity of CuAs2O4 by fitting a superposition of a Debye-type and two Einstein-type heat capacity terms according to
| (9) |
The Debye-type heat capacity is given by
| (10) |
In order to simplify the fit procedure, a Padé approximation for the Debye-type heat capacity proposed recently by Goetsch et al. was utilized.Goetsch2012 The Einstein-type heat capacities, , were calculated according to
| (11) |
The weights, , and , were conditioned such that at sufficiently high temperatures the Petit-Dulong value of 73 ( is the molar gas constant) was satisfied. By fitting the weights, the Debye-temperature and two Einstein-temperatures, the experimental heat capacity above 20 K could be well approximated and extrapolated to 0 K (see Figure 15). The fitted parameters are summarized in Table 3.
| contribution | weight | (K) |
|---|---|---|
| Debye | 1.5 | 136.59(7) |
| Einstein, =1 | 2.25 | 284.5(3) |
| Einstein, =2 | 3.25 | 789(1) |
ii. Alternatively, the heat capacity of the hypothetical compound ZnAs2O4 was calculated from the phonon density of states obtained by ab initio calculations (see above, Figure 5) and the second derivative of the free energy, . The relation is as follows
| (12) |
where and are the heat capacities at constant volume and at constant pressure (accessible by the experiment), respectively. is the free energy given by
| (13) |
In Eq. (13), represents the Boltzmann constant, the Bose-Einstein factor, and the phonon density of states. The high frequency cut-off of the latter defines the upper limit of integration in Eq. (13).
The extracted magnetic contribution to the specific heat was obtained by subtracting the lattice contribution from the experimental results. A plot of versus is shown in the Figure 16. At low temperatures the magnetic heat capacity follows a power law
| (14) |
with 1.2, somewhat lower than expected for 3D FM magnon ( = 3/2) contributions. Above 20 K, a shoulder becomes visible which we attribute to short-range ordering contributions.
By integrating , the magnetic entropy removed by the magnetic ordering is obtained according to
| (15) |
The magnetic entropy amounts to
which is 70% of the entropy expected for a = 1/2 system,
| (16) |
The largest fraction of the entropy is contained in the -anomaly and only a minor fraction is removed by short range ordering, the short range ordering effects were also seen in the -factor temperature dependence (see above).

V Conclusions
In summary, we have investigated the magnetic and lattice properties of CuAs2O4, a system characterized by axially elongated CuO6 octahedra linking to form CuO2 ribbon chains. Ab initio DFT calculations show that the nearest-neighbor intrachain spin exchange interaction is FM with a magnitude 4 times larger than the next-nearest neighbor AFM spin exchange interaction. The ratio of nearest- to next-nearest neighbor spin exchange constants places CuAs2O4 in the ferromagnetic regime next to a quantum critical point between frustrated incommensurate spin-spiral and ferromagnetic order. A comparison of our temperature dependent magnetic susceptibility data with TMRG simulations supports the ab initio calculations. Long-range FM ordering due to smaller interchain spin exchange interactions is found below 7.4 K in the magnetization and heat capacity measurements. A modified Arrott plot analysis of temperature and field dependent magnetization measurements indicates a 3d-XY critical exponents behavior. This finding is consistent with the magnetic anisotropy found by a magnetization measurement of an oriented single crystal. We observe that an application of external pressure increases the Curie temperature by a rate of 1.4 K/GPa, possibly due to an increase of the ferromagnetic nearest-neighbor spin exchange interaction. Raman scattering measurements show that the crystal structure is preserved across the and down to 4 K. GGA and LDA calculations of the lattice dynamics have been performed and are found to be in good agreement with the Raman spectra.
Acknowledgements.
We are grateful to S. Höhn, E. Brücher and G. Siegle for expert experimental assistance, and J. Nuss for the crystal alignment. Discussions with P. Lemmens are gratefully acknowledged. MHW thanks the NERSC Center and the HPC Center of NCSU for the computing resources. We thank Tao Xiang for providing the TMRG code and JML is grateful to Hantao Lu for helpful discussions.References
- (1) B. J. Gibson, R. K. Kremer, A. V. Prokofiev, W. Assmus, and G. J. McIntyre, Physica B 350, e253 (2004).
- (2) M. Enderle, C. Mukherjee, B. Fåk, R. K. Kremer, J.-M. Broto, H. Rosner, S.-L. Drechsler, J. Richter, J. Malek, A. Prokofiev, W. Assmus, S. Pujol, J.-L. Raggazzoni, H. Rakoto, M. Rheinstädter, and H. M. Rnnow, Europhys. Lett. 70, 237 (2005).
- (3) L. Capogna, M. Mayr, P. Horsch, M. Raichle, R. K. Kremer, M. Sofin, A. Maljuk, M. Jansen, and B. Keimer, Phys. Rev. B 71, 140402(R) (2005).
- (4) M. G. Banks, R. K. Kremer, C. Hoch, A. Simon, B. Ouladdiaf, J.-M. Broto, H. Rakoto, C. Lee, and M.-H. Whangbo, Phys. Rev. B 80, 024404 (2009).
- (5) J. M. Law, P. Reuvekamp, R. Glaum, C. Lee, J. Kang, M.-H. Whangbo, and R. K. Kremer, Phys. Rev. B 84, 014426 (2011).
- (6) S.-L. Drechsler, J. Richter, R. Kuzian, J. Málek, N. Tristan, B. Büchner, A. S. Moskvine, A. A. Gippius, A. Vasiliev, O. Volkova, A. Prokofiev, H. Rakoto, J.-M. Broto, W. Schnelle, M. Schmitt, A. Ormeci, C. Loison, and H. Rosner, J. Mag. Mag. Mater. 316, 306 (2007).
- (7) C. Lee, Jia Liu, M.-H. Whangbo, H.-J. Koo, R. K. Kremer, and A. Simon, Phys. Rev. B 86, 060407(R) (2012).
- (8) B. Willenberg, M. Schäpers, K. C. Rule, S. Süllow, M. Reehuis, H. Ryll, B. Klemke, K. Kiefer, W. Schottenhamel, B. Büchner, B. Ouladdiaf, M. Uhlarz, R. Beyer, J. Wosnitza, and A. U. B. Wolter, Phys. Rev. Lett. 108, 117202 (2012).
- (9) A. U. B. Wolter, F. Lipps, M. Schäpers, S.-L. Drechsler, S. Nishimoto, R. Vogel, V. Kataev, B. Büchner, H. Rosner, M. Schmitt, M. Uhlarz, Y. Skourski, J. Wosnitza, S. Süllow, and K. C. Rule, Phys. Rev. B 85, 014407 (2012).
- (10) Y. Naito, K. Sato, Y. Yasui, Y. Kobayashi, and M. Sato, J. Phys. Soc. Jpn. 76, 023708 (2007).
- (11) F. Schrettle, S. Krohns, P. Lunkenheimer, J. Hemberger, N. Büttgen, H.-A. Krug von Nidda, A. V. Prokofiev, and A. Loidl, Phys. Rev. B 77, 144101 (2008).
- (12) Y. Yasui, Y. Naito, K. Sato, T. Moyoshi, M. Sato, and K. Kakurai, J. Phys. Soc. Jpn. 77, 023712 (2008).
- (13) L. Zhao, T.-L. Hung, C.-C. Li,Y.-Y. Chen, M.-K.Wu, R. K. Kremer, M. G. Banks, A. Simon, M.-H. Whangbo, C. Lee, J. S. Kim, I. Kim, and K. H. Kim, Adv. Mater. 24, 2469 (2012).
- (14) M. Mourigal, M. Enderle, R. K. Kremer, J. M. Law, and B. Fåk, Phys. Rev. B 83, 100409(R) (2011).
- (15) M. Mourigal, M. Enderle, B. Fåk, R. K. Kremer, J. M. Law, A. Schneidewind, A. Hiess, and A. Prokofiev, Phys. Rev. Lett. 109, 027203 (2012).
- (16) R. Bursill, G. A. Gehring, D. J. J. Farnell, J. B. Parkinson, Tao Xiang, and Chen Zeng, J. Phys.: Condens. Matter 7, 8605 (1995).
- (17) S. R. White and I. Affleck, Phys. Rev. B 54, 9862 (1996).
- (18) S. Sachdev, Quantum Phase Transitions (Cambridge University Press, 1999).
- (19) S.-L. Drechsler, O. Volkova, A. N. Vasiliev, N. Tristan, J. Richter, M. Schmitt, H. Rosner, J. Málek, R. Klingeler, A. A. Zvyagin, and B. Büchner, Phys. Rev. Lett. 98, 077202 (2007).
- (20) M. Schmitt, J. Málek, S.-L. Drechsler, and H. Rosner, Phys. Rev B 80, 205111 (2009).
- (21) M. Matsuda, H. Yamaguchi, T. Ito, C. H. Lee, K. Oka, Y. Mizuno, T. Tohyama, S. Maekawa, and K. Kakurai, Phys. Rev. B 63, 180403(R) (2001).
- (22) R. O. Kuzian, S. Nishimoto, S.-L. Drechsler, J. Málek, S. Johnston, J. van den Brink, M. Schmitt, H. Rosner, M. Matsuda, K. Oka, H. Yamaguchi, and T. Ito, Phys. Rev. Lett. 109, 117207 (2012).
- (23) F. Sapiñia, J. Rodríguez-Carvajal, M. J. Sanchis, R. Ibáñiez, A. Beltrán, and D. Beltrán, Solid State Commun. 74, 779 (1990).
- (24) M. Boehm, S. Coad, B. Roessli, A. Zheludev, M. Zolliker, P. Böni, D. McK. Paul, H. Eisaki, N. Motoyama, and S. Uchida, Europhys. Lett. 43, 77 (1998).
- (25) H. J. Xiang, C. Lee, and M.-H. Whangbo, Phys. Rev. B 76, 220411(R) (2007).
- (26) S.-L. Drechsler, J. Málek, W. E. A. Lorenz, R. O. Kuzian, R. Klingeler, S. Nishimoto, U. Nitzsche, M. Knupfer, N. Wizent, G. Behr, H. Rosner, H. Eschrig, and B. Büchner, J. Phys.: Conference Series 200, 012028 (2010).
- (27) M. Hase, H. Kuroe, K. Ozawa, O. Suzuki, H. Kitazawa, G. Kido, and T. Sekine, Phys. Rev. B 70, 104426 (2004).
- (28) Y. Yasui, Y. Yanagisawa, R. Okazaki, I. Terasaki, Y. Yamaguchi, and T. Kimura, J. Appl. Phys. 113, 17D910 (2013).
- (29) J. Zemann, TMPM Tschermaks Min. Petr. Mitt. 2, 417 (1951).
- (30) F. Pertlik, TMPM Tschermaks Min. Petr. Mitt. 22, 211 (1975).
- (31) F. Pertlik, Z. Anorg. Allg. Chem. 436, 201 (1977).
- (32) N. Kumada, Y. Yonesaki, T. Takei, N. Kinomura, and S. Wada, Mat. Res. Bull. 44, 1298 (2009).
- (33) B. Hinrichsen, R. E. Dinnebier, P. Rajiv, M. Hanfland, and A. Grzechnik, J. Phys.: Condens. Matter 18, S1021 (2006).
- (34) A. Eiling and J. S. Schilling, J. Phys. F: Metal Phys. 11, 623 (1981).
- (35) M. Whangbo, H. Koo, and D. Dai, J. Solid State Chem. 176, 417 (2003).
- (36) H. J. Xiang, C. Lee, H.-J. Koo, X. G. Gong and M.-H. Whangbo, Dalton Trans. 42, 823 (2013).
- (37) D. Dai and M. Whangbo, J. Chem. Phys. 114, 2887 (2001).
- (38) D. Dai and M. Whangbo, J. Chem. Phys. 118, 29 (2003).
- (39) P. E. Blöchl, Phys. Rev. B 50, 17953 (1994).
- (40) G. Kresse and D. Joubert, Phys. Rev. B 59, 1758 (1999).
- (41) G. Kresse and J. Furthmüller, Phys. Rev. B 54, 11169 (1996).
- (42) J. P. Perdew, A. Ruzsinszky, G. I. Csonka, O. A. Vydroz, G. E. Scuseria, L. A. Constantin, X. L. Zhou, and K. Burke, Phys. Rev. Lett. 100, 136406 (2008).
- (43) S. L. Dudarev, G. A. Botton, S. Y. Savrasov, C. J. Humphreys, and A. P. Sutton, Phys. Rev. B 57, 1505 (1998).
- (44) R. Bursill, Tao Xiang, and G. A. Gehring, J. Phys.: Cond. Matter 8, L583 (1996).
- (45) Xiaoqun Wang and Tao Xiang, Phys. Rev. B 56, 5061 (1997). (1997), arXiv:cond-mat/9705301.
- (46) see http://wolf.ifj.edu.pl/phonon/.
- (47) A. Mujica, A. Rubio, and A. Muñoz, Rev. Mod. Phys. 75, 863 (2003).
- (48) K. Parlinski, Z-. Q. Li, and Y. Kawazoe, Phys. Rev. Lett. 78, 4063 (1997).
- (49) S. Kharbish, J. of Geosciences 57, 53 (2012).
- (50) A. Abragam and B. Bleaney, Electron Paramagnetic Resonance of Transition Ions, (Oxford University Press, 1970).
- (51) P. W. Selwood, Magnetochemistry 2nd ed. (Interscience, New York, 1956), p. 78.
- (52) M. Takigawa, P. C. Hammel, R. H. Heffner, Z. Fisk, J. L. Smith, and R. B. Schwarz, Phys. Rev. B 39, 300 (1989).
- (53) H. J. Koo, C. Lee, M.-H. Whangbo, G. J. McIntyre, and R. K. Kremer, Inorg. Chem. 50, 2582 (2011).
- (54) A. Arrott and J.E. Noakes, Phys. Rev. Lett. 19, 786 (1967).
- (55) J. C. LeGuillou and J. Zinn-Justin, Phys. Rev. Lett. 13, 713 (1977).
- (56) J. C. LeGuillou and J. Zinn-Justin, Phys. Rev. B 21, 3976 (1980).
- (57) R. Reisser, R. K. Kremer, and A. Simon, Physica B 204, 265 (1995).
- (58) A. Bencini and D. Gatteschi, Electron Paramagnetic Resonance of Exchange Coupled Systems(Springer, Berlin, 1990), p. 10.
- (59) R. J. Goetsch, V. K. Anand, Abhishek Pandey, and D. C. Johnston, Phys. Rev. B 85, 054517 (2012).