High frequency A-type pulsators discovered using SuperWASP††thanks: Based on service observations made with the WHT operated on the island of La Palma by the Isaac Newton Group in the Spanish Observatorio del Roque de los Muchachos of the Instituto de Astrofísica de Canarias.††thanks: Based on observations made with the Southern African Large Telescope (SALT)
Abstract
We present the results of a survey using the WASP archive to search for high frequency pulsations in F-, A- and B-type stars. Over million targets have been searched for pulsations with amplitudes greater than millimagnitude. We identify over stars which pulsate with periods less than min. Spectroscopic follow-up of selected targets has enabled us to confirm new rapidly oscillating Ap stars, pulsating Am stars and the fastest known Scuti star. We also observe stars which show pulsations in both the high-frequency domain and in the low-frequency Scuti range. This work shows the power of the WASP photometric survey to find variable stars with amplitudes well below the nominal photometric precision per observation.
keywords:
asteroseismology – stars: chemically peculiar – stars: oscillations – stars: variables: Scuti – techniques: photometric – surveys.1 Introduction
With the advent of large ground-based photometric surveys (e.g. WASP, Pollacco et al. 2006; HATnet, Bakos et al. 2004; ASAS, Pojmański 1997; OGLE, Udalski et al. 1992) there is a wealth of photometric data on millions of stars. Despite not being the prime science goal, these surveys can be exploited to probe stellar variability across the entire sky (e.g. Norton et al., 2011; Smalley, 2013). The ability of these surveys to achieve millimagnitude (mmag) precision provides a vast database in which to search for low-amplitude stellar variability.
The WASP project is a wide-field survey for transiting exoplanets. The project is a two-site campaign: the first instrument is located at the Observatorio del Roque de los Muchachos on La Palma and achieved first light in November , the second is located at the Sutherland Station of the SAAO and achieved first light in December . Each instrument consists of eight mm, f Canon telephoto lenses backed by Andor CCDs of pixels observing deg2 each through broadband filters covering a wavelength range of nm (Pollacco et al., 2006). This set-up enables simultaneous observations of up to fields with a pixel size of ″. The instruments capture two consecutive s integrations at a given pointing, then move to the next observable field. Typically, fields are revisited every min.
The images collected are passed through the reduction pipeline, where the data are corrected for primary and secondary extinction, the instrumental colour response and the system zero-point. The atmospheric extinction correction uses a network of stars with a known () colour to determine the extinction terms, which are then applied to all extracted stars using an assumed colour of G-type stars. This process results in a ‘WASP ’ magnitude which is comparable to the Tycho- passband. The data are also corrected for systematic errors using the SysRem algorithm of Tamuz, Mazeh & Zucker (2005). Aperture photometry is performed at stellar positions provided by the USNO-B input catalogue (Monet et al., 2003). Stars brighter than magnitude are extracted and provided with a unique WASP ID of the format SWASPJ. Data are stored in fits format with labels of the observed field, camera and date of observation. Such a configuration and extended time-base allows the extraction of multiple lightcurves for each object based on either date, field or camera.
To date there are over billion data points in the archive covering over million unique objects. With such a large database of objects it is possible to search for a wide variety of stellar variability.
In this paper we present the results from a survey of the WASP archive in the search of rapidly varying stars. We focus on stars hotter than mid F-type in the region of the Hertzsprung-Russell (HR) diagram where the classical instability strip intersects the main-sequence. In this region we find the classical Scuti ( Sct) pulsators, the non-magnetic metallic-lined (Am) stars, the strongly-magnetic, chemically peculiar, rapidly oscillating Ap (roAp) stars, the metal deficient Boötes stars, the Doradus ( Dor) pulsators and the SX Phoenicis variables.
Most of the stars in this region of the HR diagram are Sct stars which show normal chemical abundances in their atmospheres. However, at about A, per cent of the A-type stars are in fact Am stars (Smith, 1973). These stars show a discrepancy of at least five spectral subclasses between their hydrogen line spectral class, their Ca K line strength, and their metallic line strengths (Conti, 1970). If the differences are less than five subclasses they are designated ‘marginal’ Am stars (denoted Am:). It was previously thought that the Am stars cannot pulsate with amplitudes greater than mmag, if at all (Breger, 1970), however a study by Smalley et al. (2011) has shown that per cent of known Am stars pulsate at the mmag level. Their study concluded that the pulsations in Am stars must be laminar so as not to produce sub-cm s-1 turbulence which would homogenize the star. The driving mechanism in the Am stars is the opacity () mechanism acting on helium in the He ii ionisation zone, resulting in both radial and non-radial pressure modes (p-modes) (see Aerts, Christensen-Dalsgaard & Kurtz, 2010).
Rarer than the Am stars are the chemically peculiar Ap stars. Constituting only about per cent of the A-type stars (Wolff, 1968), the Ap stars are strongly-magnetic and have over-abundances of rare-earth elements. Around Ap stars are known to be roAp stars (Kurtz, 1982). These stars show high-overtone p-mode pulsations in the range of min. The driving mechanism is the same as that for the Am stars, the mechanism, but it is acting in the hydrogen ionization zone instead. The pulsational axis in the roAp stars is thought to be aligned with the magnetic field axis rather than the rotational axis, leading to the oblique pulsator model of Kurtz (1982). Due to the strong global magnetic fields, the Ap stars are subject to stratification in their atmospheres, often leading to surface brightness anomalies in the form of chemical spots (Stibbs, 1950). These spots can be stable for many decades, allowing for an accurate determination of their rotation period from the lightcurve. The roAp stars provide the best test-bed, beyond the Sun, to study the interactions between pulsations and strong global magnetic fields, as well as testing gravitational settling and radiative levitation theories (e.g. Gautschy & Saio, 1998; Balmforth et al., 2001; Kurtz et al., 2011).
Hybrid pulsators, which show both p-mode and gravity (g-) mode pulsations, are also found in this region of the HR diagram. At the base of the instability strip there is an area where the Dor stars, g-mode pulsators, overlap with the p-mode Sct stars. These objects are of great scientific interest as it becomes possible to probe both the core and atmosphere simultaneously. Observations made with the Kepler spacecraft of these hybrid stars (Grigahcène et al, 2010; Catanzaro et al., 2011) have shown that these objects are more common than previously thought, with the possibility that nearly all stars in this region of the HR diagram show both Dor and Sct pulsations (Grigahcène et al, 2010).
Finally, we also have the pre-main-sequence A-type stars in this region of the HR diagram. These stars are among the fastest known Sct pulsators, with the fastest being HD with a period of min (Amado et al., 2004). These targets often show multi-mode periodograms, with ‘noisy’ lightcurves due to dusty circumstellar environments. As a result of this environment many of these objects are heavily reddened.
Previous surveys for pulsations in the A-type stars have targeted objects that were already known to be spectroscopically interesting A stars (e.g. Kochukhov et al., 2013; Paunzen et al., 2012; Smalley et al., 2011). This approach limits the results to specific types of pulsators. However, the approach we have adopted in our study requires no previous knowledge of the targets, except for a rough photometric spectral type. This has allowed us to search for all types of pulsations in F-, A- and B-type stars and will permit the possible discovery of new types, thus the aim of our study is to identify stars which show variability with a period of less than min. This blind survey enables us to approach the search for different types of pulsators in a novel way, opening our results to pulsating Am stars, roAp stars, fast Sct stars and pre-main-sequence stars.
2 Archive Survey
2.1 Determining WASP detection limits
Before a full archive survey is conducted, we need to understand the capabilities of the WASP data in detecting pulsations. In order to do this, we employ the micromagnitude (mag) precision of Kepler data.
The Kepler mission, launched in March , observed over stars in two cadence modes - the long cadence (LC) mode with an effective exposure time of min was used for the majority of stars, with stars observed in the short cadence (SC) mode with an effective exposure time of min (Gilliland et al., 2010). Kepler consisted of an array of CCDs covering deg2 of sky in the direction of the constellations Cygnus and Lyra. Observations were made through fixed CCD filters covering nm (Koch et al., 2010) which is slightly redder than WASP. Kepler achieved a photometric precision of up to parts per million (Borucki et al., 2010; Koch et al., 2010) resulting in a large quantity of high cadence data at mag precision.
Debosscher et al. (2011) have conducted a variability study on the first Quarter of Kepler data. We used their results to select Kepler targets which showed a principal frequency with an amplitude of mmag. Corresponding WASP data were extracted from the archive as long as their () colour was less than so to target G stars and hotter, ensuring we account for reddened objects to maximise our sample size. This resulted in a final sample size of stars.
Periodograms for these targets were calculated using the fasper method of Press et al. (1989, 1992). A small selection of the resulting periodograms were inspected manually where it was found that periodograms suffered greatly from low-frequency noise and a high ‘Fourier grass’ level – the approximate background level of the periodogram which resembles mown grass – at higher frequencies. Examination of the lightcurves revealed many points which significantly deviated from the mean (Fig. 1 top left). To remove these outliers we have adopted a resistant mean algorithm (Huber, 1981) which removes data points from the lightcurve which deviate from the median by more than . A recalculation of the periodograms resulted in a much smoother periodogram with clearly defined peaks (Fig. 1 top right).


All peaks from each WASP periodogram are compared with the corresponding Kepler target data to determine if the pulsation has been detected. We require a maximum deviation of d-1 between the two data sets to conclude that they agree (the Rayleigh criterion for a typical season of WASP data i.e. , where is the season duration). We find agreement between target stars. Of the non-matches, we determined that if the data set has fewer than data points the frequency is not recovered, and if we have a high level of target blending, due to the large WASP pixel sizes, the amplitudes are diluted to below our detection threshold. Of the targets that do match, we are able to conclude that the minimum detection limit is mmag.
2.2 Target selection
Using MASS colours for stars in the WASP database we select over million F-, A- and B-type stars, requiring () (corresponding to F). We also stipulate that the targets have a USNO magnitude of , which are the approximate detection limits of the WASP instruments. Finally we reject stars with fewer than data points as we know from Section 2.1 that signals cannot be extracted with so few data.
With our subset of stars we extract each season of data and calculate a periodogram, to a maximum frequency of d-1, as described above. We choose this upper limit to balance computational time with expected detection rate. In all, we calculate over million individual periodograms, indicating an average of seasons per star. To increase the speed of later peak identification we do not store the entire periodogram, only the significant peaks. A peak is deemed significant if it has a S/N . To determine the noise level, the periodogram is split into sections of d-1 with the mean of each section calculated. The noise level is then taken to be the lowest value calculated. That is to say, the noise is estimated to be half of the ‘Fourier grass’ level of the most stable section. This value is then used for the entire periodogram. Although not the conventional method to calculate Fourier noise, this method is computationally fast. We have accounted for any over estimates of the noise by lowering the S/N criteria from the widely accepted value of (Breger et al., 1993; Koen, 2010). For later analysis of individual targets, for which we use Period (Lenz & Breger, 2005), we use a threshold S/N of .
To identify pulsation candidates in the data with confidence, we require certain criteria to be met. A single object must show a peak at the same frequency in more than one season, within a tolerance of d-1. We implement this criterion to reduce the possibility of spurious noise being identified as a true signal. We also consider the window function to eliminate any sampling aliases. Targets which satisfy these criteria have their full periodograms calculated and stored for human inspection.
During this selection process we do not consider the effects of blending or overcrowding of the WASP aperture. Due to the large pixel size of the WASP detectors this can be a common occurrence, with an estimated % of targets suffering % dilution. However, at the detection stage, we are solely interested in the detection of variability, with later diagnostics to resolve blends or confusion being conducted to ensure the variability is attributed to the correct target (see Section 4.1.10 for an example).
2.3 Renson & Manfroid catalogue search
To understand the capabilities of the WASP data with regards to finding roAp stars, we conducted an initial test using the catalogue of Renson & Manfroid (2009). All stars identified as Ap were cross-checked with the WASP database, and extracted with the same criteria as in Section 2.2. This amounted to Ap stars. Periodograms were calculated using the aforementioned method, and examined if the above criteria were fulfilled. The automatic search resulted in the extraction of just known roAp star (HD ), out of a possible known roAp stars in the subset we searched.
To decipher why only one object was recovered from the WASP data we first consider the spectral response of the WASP instruments. Designed for exoplanet detection, the broad spectral response dilutes the pulsations which are strongest in B-band photometry (Kurtz, 1990). Comparing WASP observations of HD with those in the literature, we see that WASP data suffers an amplitude decrease of per cent. Given the WASP detection threshold is between mmag, we expect the lower limit in B-band photometry to be between mmag, thus accounting for the non-detection of targets.
We further investigate why we detect no pulsations for the remaining targets by calculating for each season of data the weighted reduced- (Bevington, 1969) which aims to characterize the lightcurve by accounting for the number of data points and the scatter in the lightcurve i.e.
With this taken into account, it becomes more clear why we do not detect the roAp stars with amplitudes above our expected amplitude threshold. For the four non-detected targets above the threshold, the value suggests the data are not of high enough quality to consistently detect pulsations.
This suggests we will only detect a small fraction of the roAp stars that exist in the WASP database. The main reason for the lack of detections of the known targets is the colour response of the WASP instruments. For the target that was automatically extracted, the amplitude dilution of per cent indicates that we will only observe the highest amplitude pulsators.
Of the Ap stars we studied, we detected no new roAp stars amongst the sample. We are, of course, limited by our threshold of mmag which provides an upper limit on any pulsations in the WASP V-band photometry.
| HD | Literature Data | WASP Data | ||||||||||||||
| Mag | Mag | of | ||||||||||||||
| (B) | (d-1) | (mmag) | (VWASP) | (d-1) | (mmag) | Seasons | ||||||||||
| 6532 | 8.60 | 202.82 | 5 | 8.38 | – | – | 2 | 42.43 | 2.33 | |||||||
| 9289 | 9.63 | 137.14 | 3.5 | 9.42 | – | – | 4 | 7.46 | 14.93 | 3.73 | 2.66 | |||||
| 12098 | 8.46 | 189.22 | 3 | 8.23 | – | – | 1 | 1.82 | ||||||||
| 12932 | 10.56 | 124.14 | 4 | 10.28 | 124.10 | 1.03 | 5 | 1.18 | 1.07 | 0.99 | 1.17 | 0.97 | ||||
| 84041 | 9.74 | 96.00 | 6 | 9.25 | – | – | 5 | 44.65 | 9.52 | 3.95 | 7.76 | 6.29 | ||||
| 99563 | 8.90 | 134.58 | 10 | 8.50 | – | – | 4 | 12.28 | 204.96 | 11.33 | 2.65 | |||||
| 101065 | 8.73 | 119.01 | 13 | 8.27 | – | – | 2 | 2.44 | 5.65 | |||||||
| 119027 | 10.41 | 165.52 | 2 | 10.19 | – | – | 4 | 1.58 | 1.27 | 8.69 | 1.79 | |||||
| 122970 | 8.70 | 129.73 | 2 | 8.33 | – | – | 4 | 2.89 | 4.60 | 6.95 | 3.90 | |||||
| 185256 | 10.37 | 141.18 | 3 | 10.10 | – | – | 7 | 3.77 | 2.18 | 0.934 | 1.47 | 2.91 | 1.43 | 37.82 | ||
| 193756 | 9.56 | 110.77 | 1.5 | 9.27 | – | – | 5 | 3.29 | 0.95 | 1.82 | 4.25 | 3.10 | ||||
| 196470 | 10.14 | 133.33 | 0.7 | 9.84 | – | – | 6 | 3.02 | 4.10 | 3.53 | 4.91 | 2.58 | 4.48 | |||
| 203932 | 9.10 | 244.07 | 2 | 8.92 | – | – | 4 | 23.25 | 3.80 | 0.66 | 17.62 | |||||
| 213637 | 10.05 | 125.22 | 1.5 | 9.73 | – | – | 8 | 1.52 | 1.63 | 1.53 | 2.06 | 1.52 | 1.42 | 0.89 | 1.36 | |
| 218495 | 9.62 | 194.59 | 1 | 9.43 | – | – | 4 | 7.95 | 6.41 | 5.62 | 7.81 | |||||
3 Candidate Targets
Of the million F-, A- and B-type stars extracted from the WASP archive, we find stars which show variations on the order of min or less which are present in two or more seasons of observations. Of these targets, we obtained spectral follow-up for stars. The targets were selected for follow-up based on their frequency and amplitude of pulsation. Focusing initially on the objects whose periodograms look like that of the rare roAp stars, then moving to lower frequencies and periodograms which show a more complex pulsation spectrum. In Table 2 we present photometric information on the stars for which we obtained spectra.
| Abbreviated | Other | R.A. | Dec | V | () | of | npts | Amp | |
| ID | ID | J2000 | J2000 | Seasons | (d-1) | (mmag) | |||
| J0004 | HD 225186 | 00:04:15.12 | 17:25:29.6 | 9.05 | 4 | 13814 | 60.08 | 3.40 | |
| J0008 | TYC 4-562-1 | 00:08:30.50 | 04:28:18.2 | 10.16 | 3 | 23076 | 150.26 | 0.76 | |
| J0026a | TYC 2269-996-1 | 00:26:04.18 | 34:47:32.9 | 10.04 | 3 | 13037 | 79.13 | 2.05 | |
| J0051 | TYC 5270-1900-1 | 00:51:07.36 | 11:08:31.9 | 11.52 | 3 | 21913 | 58.04 | 4.77 | |
| J0206b | HD 12932 | 02:06:15.80 | 19:07:26.2 | 10.17 | 4 | 15269 | 124.10 | 1.38 | |
| J0353 | HD 24355 | 03:53:23.09 | 25:38:33.3 | 9.65 | 3 | 7951 | 224.31 | 1.65 | |
| J0410 | HD 26400 | 04:10:45.78 | 07:17:17.2 | 9.54 | 3 | 28629 | 68.22 | 2.70 | |
| J0429 | HD 28548 | 04:29:27.24 | 15:01:51.1 | 9.22 | 2 | 22195 | 65.65 | 4.41 | |
| J0629 | HD 258048 | 06:29:56.85 | 32:24:46.9 | 10.52 | 3 | 15343 | 169.54 | 1.49 | |
| J0651 | TYC 8912-1407-1 | 06:51:42.17 | 63:25:49.6 | 11.51 | 3 | 36597 | 132.38 | 0.79 | |
| J0855 | TYC 2488-1241-1 | 08:55:22.22 | 32:42:36.3 | 10.80 | 3 | 13203 | 197.27 | 1.40 | |
| J1110 | HD 97127 | 11:10:53.91 | 17:03:47.5 | 9.43 | 3 | 11184 | 106.61 | 0.66 | |
| J1215 | HD 106563 | 12:15:28.17 | 11:24:41.3 | 10.55 | 3 | 16354 | 65.46 | 1.48 | |
| J1250 | TYC 297-328-1 | 12:50:56.15 | 05:32:12.9 | 11.25 | 4 | 22902 | 68.99 | 4.30 | |
| J1403 | HD 122570 | 14:03:41.51 | 40:51:08.9 | 10.41 | 4 | 19613 | 99.12 | 1.27 | |
| J1430 | TYC 2553-480-1 | 14:30:49.64 | 31:47:55.1 | 11.56 | 3 | 21181 | 235.54 | 1.06 | |
| J1625 | HD 147911 | 16:25:24.10 | 21:41:18.6 | 9.17 | 5 | 21514 | 68.52 | 6.37 | |
| J1640 | 2MASS J16400299-0737293 | 16:40:02.99 | 07:37:29.7 | 12.67 | 2 | 14511 | 151.93 | 3.52 | |
| J1648 | TYC 2062-1188-1 | 16:48:36.99 | 25:15:48.6 | 9.98 | 5 | 43024 | 105.12 | 0.60 | |
| J1757 | TYC 2612-1843-1 | 17:57:26.48 | 32:25:23.7 | 11.58 | 5 | 35794 | 63.71 | 2.46 | |
| J1758 | 2MASS J17584421+3458339 | 17:58:44.20 | 34:58:33.9 | 12.93 | 5 | 74131 | 71.28 | 2.49 | |
| J1844 | TYC 3130-2480-1 | 18:44:12.27 | 43:17:51.9 | 11.25 | 5 | 39389 | 181.73 | 1.45 | |
| J1917 | TYC 7926-99-1 | 19:17:33.42 | 42:42:07.3 | 11.18 | 3 | 12120 | 164.47 | 1.85 | |
| J1940 | 2MASS J19400781-4420093 | 19:40:07.81 | 44:20:09.2 | 13.02 | 5 | 25071 | 176.39 | 4.16 | |
| J1951 | 2MASS J19512756-6446247 | 19:51:27.55 | 64:46:24.5 | 13.26 | 4 | 28567 | 58.43 | 4.29 | |
| J2022 | TYC 9311-73-1 | 20:22:36.50 | 70:11:00.2 | 12.77 | 4 | 27249 | 62.54 | 3.30 | |
| J2026 | TYC 5762-828-1 | 20:26:42.62 | 11:52:45.1 | 11.80 | 4 | 15957 | 212.66 | 1.62 | |
| J2029 | HD 195061 | 20:29:33.21 | 18:13:12.2 | 9.81 | 6 | 24743 | 28.86 | 2.50 | |
| J2054 | TYC 525-2319-1 | 20:54:19.84 | 07:13:11.0 | 9.94 | 5 | 31892 | 104.86 | 1.10 | |
| J2155 | 2MASS J21553126+0849170 | 21:55:31.26 | 08:49:17.0 | 12.83 | 4 | 29563 | 61.34 | 6.38 | |
| J2241 | TYC 3218-888-2 | 22:41:54.21 | 40:30:39.1 | 11.45 | 3 | 10389 | 75.54 | 3.32 | |
| J2254 | TYC 569-353-1 | 22:54:34.21 | 00:52:46.3 | 12.72 | 3 | 33997 | 52.59 | 5.06 | |
| J2255 | TYC 6390-339-1 | 22:55:20.44 | 18:36:35.3 | 11.95 | 4 | 17232 | 66.96 | 2.68 | |
| J2305 | TYC 9131-119-1 | 23:05:45.31 | 67:19:03.0 | 11.43 | 2 | 16265 | 92.75 | 1.61 | |
| J2313 | TYC 577-322-1 | 23:13:26.32 | 02:27:49.5 | 10.72 | 3 | 24001 | 60.42 | 5.97 | |
| J2345 | 2MASS J23455445-3932085 | 23:45:54.44 | 39:32:08.2 | 13.60 | 2 | 11594 | 60.47 | 20.33 | |
| aThis target is classed as one star in the WASP archive but is in fact a visual binary. | |||||||||
| bThis is a known roAp star included for comparison. | |||||||||
3.1 Spectroscopy
To obtain spectra for our candidate stars, we make use of the Intermediate dispersion Spectrograph and Imaging System (ISIS) mounted on the -m William Herschel Telescope (WHT) in service mode for our northern targets, and the Robert Stobie Spectrograph (RSS) mounted on the -m Southern African Large Telescope (SALT) to observe our southern targets. We require only low resolution classification spectra for our targets, achieving a spectral resolution of for SALT/RSS observations and for WHT/ISIS observations. In addition, two objects were observed with the Hamilton Echelle Spectrograph (HamSpec; Vogt, 1987) on the Shane -m telescope at Lick Observatory, achieving a resolution of .
All spectra have been extracted from their fits images and have been flat-field corrected, de-biased, cleaned of cosmic-rays and have had wavelength calibrations applied. Tools from the starlink project111http://starlink.jach.hawaii.edu/starlink/ were used to perform these tasks, with the exception of the HamSpec spectra, which were reduced using routines written in IDL. Finally, the spectra were intensity rectified using the uclsyn spectral synthesis package (Smalley, Smith & Dworetsky, 2001).
To determine the stellar temperatures from the spectra we used uclsyn, setting to a constant and synthesised the Balmer lines. Due to the low resolution classification spectra, we are only able to attain the temperatures to within K. We estimate the S/N for each spectrum using the der_snr code of Stoehr et al. (2008). The spectral types of the stars were determined via comparison with MK Standard stars using the method of Gray & Corbally (2009). We present the spectroscopic information and results in Table 3.
| ID | Telescope/ | Exposure | Observation Date | S/N | Balmer | SED | Spectral | ||||||||||
| Instrument | (s) | (K) | (K) | Type | |||||||||||||
| J0004 | SALT/RSS | 2012-05-31 | 180 | 7900 | 7518 377 | A5 | |||||||||||
| J0008 | SALT/RSS | 2013-06-15 | 60 | 7300 | 7484 336 | A9p SrEu(Cr) | |||||||||||
| J0026Sa | WHT/ISIS | 2011-11-22 | 100 | 6650 | 6100318 | F4 | |||||||||||
| J0026P | WHT/ISIS | 2011-11-22 | 115 | 8100 | A2m | ||||||||||||
| J0051 | SALT/RSS | 2013-06-06 | 50 | 7850 | 8144 479 | A6 | |||||||||||
| J0206 | WHT/ISIS | 2011-11-22 | 70 | 7600 | 7310 318 | A4p | |||||||||||
| J0353 | WHT/ISIS | 2012-10-24 | 50 | 8250 | 7417 331 | A5p SrEu | |||||||||||
| J0410 | WHT/ISIS | 2011-11-22 | 125 | 8150 | 7712 346 | A3m: | |||||||||||
| J0429 | WHT/ISIS | 2013-10-24 | 120 | 8200 | 8770 334 | A2m | |||||||||||
| J0629 | WHT/ISIS | 2012-10-24 | 40 | 6600 | 6211 281 | F4p EuCr(Sr) | |||||||||||
| J0651 | SALT/RSS | 2012-09-11 | 70 | 7400 | 7843 491 | F0p SrEu(Cr) | |||||||||||
| J0855 | WHT/ISIS | 2011-11-22 | 80 | 7800 | 8287 475 | A6p SrEu | |||||||||||
| J1110 | WHT/ISIS | 2012-12-25 | 55 | 6300 | 6707 294 | F3p SrEu(Cr) | |||||||||||
| J1215 | WHT/ISIS | 2012-12-25 | 70 | 8100 | 8437 412 | A3m: | |||||||||||
| J1250 | WHT/ISIS | 2012-12-25 | 100 | 8300 | 7099 370 | A4m | |||||||||||
| J1403 | SALT/RSS | 2012-05-08 | 140 | 7550 | 7500 350 | A9 | |||||||||||
| J1430 | WHT/ISIS | 2012-12-25 | 85 | 7100 | 7479 366 | A9p SrEu | |||||||||||
| J1625 | SALT/RSS | 2012-05-08 | 235 | 8200 | 6147 272 | A1m | |||||||||||
| J1640 |
|
|
|
|
6282 314 |
|
|||||||||||
| J1648 | WHT/ISIS | 2013-02-01 | 80 | 7100 | 6939 307 | F0 | |||||||||||
| J1757 | WHT/ISIS | 2013-02-01 | 105 | 7900 | 7425 377 | A7m: | |||||||||||
| J1758 | WHT/ISIS | 2013-02-01 | 110 | 7700 | 7260 480 | A7m: | |||||||||||
| J1844 | Shane/HamSpec | 2012-07-24 | 40 | 7000 | 8043 435 | A7p EuCr | |||||||||||
| J1917 | SALT/RSS | 2013-04-22 | 100 | 7800 | 6989 293 | A7m | |||||||||||
| J1940 | SALT/RSS | 2012-11-03 | 20 | 6900 | 7623 411 | F2(p Cr) | |||||||||||
| J1951 | SALT/RSS | 2013-04-25 | 75 | 8100 | 8076 438 | A5 | |||||||||||
| J2022 | SALT/RSS | 2013-04-25 | 85 | 8200 | 7973 507 | A4m | |||||||||||
| J2026 | WHT/ISIS | 2013-04-25 | 60 | 6000 | 6528 433 | F8 | |||||||||||
| J2029 | SALT/RSS | 2013-04-27 | 40 | 8000 | 7754 339 | A4m | |||||||||||
| J2054 | Shane/HamSpec | 2012-07-24 | 60 | 7000 | 8372 438 | A3m: | |||||||||||
| J2155 | SALT/RSS | 2013-06-07 | 50 | 8100 | 6681 555 | A3 | |||||||||||
| J2241 | WHT/ISIS | 2012-10-25 | 70 | 8100 | 7771 391 | A3m | |||||||||||
| J2254 | SALT/RSS | 2013-06-17 | 55 | 8150 | 7059 450 | A4 | |||||||||||
| J2255 | SALT/RSS | 2013-05-13 | 50 | 8200 | 8564 627 | A3 | |||||||||||
| J2305 | SALT/RSS | 2012-11-04 | 35 | 8050 | 8146 374 | A5m: | |||||||||||
| J2313 | SALT/RSS | 2013-06-19 | 65 | 8000 | 7794 376 | A5 | |||||||||||
| J2345 | SALT/RSS | 2013-06-07 | 75 | 9700 | 9772 964 | A3 | |||||||||||
| aWe identify this target as a spectroscopic binary, with a radial velocity shift of km s-1. | |||||||||||||||||
3.2 Stellar temperatures from spectral energy distributions
Effective temperatures can be determined from the stellar spectral energy distribution (SED). For our target stars these were constructed from literature photometry, using 2MASS (Sktrutskie et al., 2006), DENIS (Fouqué et al., 2000), Tycho and magnitudes (Høg et al., 1997), USNO-B1 magnitudes (Monet et al., 2003), TASS and magnitudes (Droege et al., 2006) CMC14 magnitudes (Evans, Irwin & Helmer, 2002) as available.
The stellar values were determined by fitting solar-composition Kurucz (1993) model fluxes to the de-reddening SEDs. The model fluxes were convolved with photometric filter response functions. A weighted Levenberg-Marquardt non-linear least-squares fitting procedure was used to find the solution that minimized the difference between the observed and model fluxes. Since is poorly constrained by our SEDs, we fixed for all the fits. Stellar energy distributions can be significantly affected by interstellar reddening. However, in the absence of measured reddening values, we have assumed in our fitting. The uncertainties in includes the formal least-squares error and adopted uncertainties in of 0.02 and of 0.5 added in quadrature. We present the SED derived for our spectroscopically observed targets in Table 3.
4 Results
4.1 New roAp stars
We present here the new roAp stars discovered in the SuperWASP archive. Some objects show a low frequency signature in their periodogram which is attributed to rotational modulation. We present both the low frequency periodograms and the phase folded lightcurves alongside a discussion of each object, with the details of the modulations shown in Table 4. The periodograms indicate the frequency () on which the data are folded, as well as labels of other prominent peaks. In this frequency range the periodograms show the reflection of the d-1 aliases, labelled as , which must not be confused with the true peak. Each periodogram is calculated with a single season of WASP data for clarity (the peaks are also present in all other data sets for each target). The solid line on each phase plot represents the harmonic fit. The false-alarm probability (FAP) is calculated using the method of Maxted et al. (2011).
| ID | Period | Amp | FAP | |
|---|---|---|---|---|
| (d-1) | (d) | (mmag) | ||
| J | 0.0717 | 13.95 | 6.37 | 0.001 |
| J | 0.3234 | 3.09 | 2.55 | 0.096 |
| J | 0.2722 | 3.67 | 4.17 | 0.003 |
| J | 0.0495 | 20.20 | 7.65 | 0.000 |
| J | 0.1044 | 9.58 | 5.87 | 0.017 |
4.1.1 J
J shows roAp pulsations at d-1 with an amplitude of mmag (Fig. 2 top). WASP has observed the target for three consecutive seasons with slight discrepancies in the pulsation frequency which is attributed to the -d aliases. The spectrum obtained for this star (Fig. 2 bottom) has been classified as Ap, with strong enhancements of Sr ii and Eu ii. The spectrum confirms this to be a new roAp star.
The pulsations in J are similar to those in HD , which pulsates at d-1 with an amplitude in the blue of mmag (Martinez & Kurtz, 1994). HD is a hotter star, classified as Ap SrEu(Cr), and is also known to show amplitude modulation as a result of closely spaced frequencies.

4.1.2 J
The star J displays pulsations at about d-1 with an amplitude of mmag as well as a low-frequency variation corresponding to d (Fig. 3 & Fig. 4). The spectrum of this star is classified as Ap with an enhancement of Sr ii and Eu ii, confirming it as a new roAp star.
Similar to J, HR shows pulsations at about the same frequency ( d-1; Kurtz, 1981) and is classified as an Ap SrEu(Cr) star. The rotation period of HR has been discussed at length in the literature, recently Rusomarov et al. (2013) present a period of d derived from longitudinal magnetic field data points spanning over 4 decades. Balona & Zima (2002) present spectra of HR which show a core-wing anomaly in the Hα line, a feature which we also note in our ISIS red-arm spectrum.


4.1.3 J
J has pulsations at d-1 with an amplitude of mmag (Fig. 5 top). The spectrum (Fig. 5 bottom) shows strong over-abundances of Sr ii, Cr ii and Eu ii. The photometric observations give no indication of rotational modulation. We classify the star as Fp.
Through both Balmer line analysis and SED fitting, we conclude that J is a very cool Ap star with a similar to the roAp star HD ( K; Kochukhov, 2003), and thus placing J amongst the coolest roAp stars.


4.1.4 J
We classify J as an Fp star whose spectrum shows a strong over-abundance of Sr ii at & (Fig. 6). We also see enhanced features of Eu ii at & and Cr ii at . Our photometry shows pulsations at d-1 (Fig. 6), with no clear indications of rotational modulation in the lightcurve.
In the literature we find a very similar roAp star to J. Pulsating at a frequency of d-1 with an amplitude in the blue of mmag, HD is an Ap SrEu star (Kurtz & Martinez, 1993). Elkin, Kurtz & Mathys (2008) present photometric and spectroscopic values for HD , deriving and K respectively, which are similar to those we obtain for J.


4.1.5 J
J shows rapid pulsations at d-1 with an amplitude of mmag (Fig. 7). Balmer line fitting gives a of K, and a spectral type of Ap when compared to MK standards. The spectrum also shows an over-abundance of Eu ii at & , with weak Ca K and Ca i at (Fig. 7). As well as the high-frequency pulsation, the periodogram shows a low-frequency signature with a period of d (Fig. 8).
Our temperatures derived for J vary greatly between methods, however the SED method is very poorly constrained for this target as indicated by the error bar. Assuming a of that derived through Balmer line fitting, J is almost identical to the known roAp star HD (Martinez & Kurtz, 1990). The pulsations of the two are at the same frequency, with J showing a larger undiluted amplitude. The ISIS red arm spectrum also shows a core-wing anomaly in the Hα line.


4.1.6 J
J exhibits low amplitude pulsations at d-1 (Fig. 9). We classify the spectrum as a cool Fp star with a measured from the Balmer lines of K. The spectrum shows a slight over-abundance of Eu ii at & , and a marginal over-abundance of Sr ii (Fig. 9). We also note the weak Ca i K and lines which may be due to stratification in the atmosphere.
J has the lowest pulsation frequency of our roAp stars and is also the coolest, as derived from the Balmer lines. J is similar in amplitude and frequency to HD . However, HD is classified as A with a temperature of K derived from its Hα profile (Elkin et al. 2008).


4.1.7 J
Pulsating at a frequency of d-1 with an amplitude of mmag (Fig. 10), we classify J as an Ap star with an effective temperature of K derived from the Balmer lines. The spectrum shows an over-abundance of Eu ii (Fig. 10). J is the fastest roAp star we have found in the WASP archive, and is third fastest of all the roAp stars.
HD is a similar object to J in both pulsations and temperature. HD has a of K (Balmforth et al., 2001), but is classified as only having an over-abundance of Sr. The Hα line profile of J indicates the presence of a core-wing anomaly.

4.1.8 J
WASP photometry shows J to pulsate at d-1 with an amplitude of about mmag (Fig. 11). The classification spectrum shows over-abundances of both Sr ii and Eu ii allowing us to classify this star as Ap (Fig. 11). We also detect in the photometry a signature with a period of d, most likely due to the rotation of the star (Fig. 12).
We obtained two spectra of this target using two different instruments. The separate analysis of both spectra resulted in the same classification and . There are no known roAp stars which exhibit a similar pulsation spectrum as J, in the sense that J is exhibits pulsations of mmag in our diluted photometry, making it one of the highest amplitude pulsators.


4.1.9 J
J shows a low amplitude pulsation at d-1 (Fig. 13). We classify this star as Ap with a of about K. The spectra for this target were obtained using the Hamilton Echelle Spectrometer mounted on the Shane -m telescope at Lick observatory (Fig. 13). We utilised this instrument to gain a high resolution spectrum to be able to perform a full abundance analysis on J as it lies in the Kepler field. Identified as KIC , the target has been observed in LC mode for the duration of the mission. Analysis of both the Kepler data and the HamSpec spectrum is under-way (Holdsworth et al., in preparation).
We observe J to have a rotationally modulated lightcurve with a period of d (Fig. 14), a signature which is also present in the Kepler data. This is the longest rotation period roAp star we present. The mono-periodic pulsations are similar to those of HD which pulsates at d-1 with a blue-band amplitude of mmag (Martinez et al., 2000).


4.1.10 J
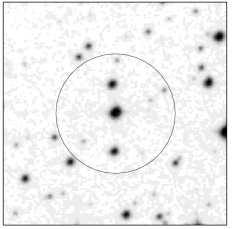
J shows pulsations at d-1, and is the highest amplitude roAp star discovered by SuperWASP at mmag (Fig. 15). Given the effects of amplitude reduction of pulsations in the WASP data, J may be the highest amplitude roAp star known. The SALT/RSS classification spectrum was obtained at a low S/N due to the faintness of the target. After smoothing the spectrum (by convolving it with a Gaussian profile), we deduce that J is an Fp star with enhancements of Eu ii (Fig. 15). We also detect a low-frequency signal in the photometry with a period of d (Fig. 16). J is a prime example of the large pixel sizes of the WASP cameras, and the possible blending that this introduces. Fig. 17 shows an DSS image of the target star (centre) and surrounding objects. The over-plotted circle represents the photometric aperture of WASP (with a radius of ). To confirm the source of the high-frequency pulsation, we used the TRAPPIST telescope (Jehin et al., 2011) to observe the target for h. TRAPPIST is a -m robotic telescope situated at the ESO La Silla Observatory. Backed by a CCD camera of pixels, the instrument achieves a plate scale of ″per pixel. This vastly superior plate scale compared to WASP, enabled us to confirm that J is the source of the pulsation (Fig. 18). We were, however, unable to confirm the origin of the low frequency signature which may originate on one of the other objects in the aperture.


4.2 Other pulsating stars
As we have a lower boundary of d-1 as our search criterion, we also anticipated the detection of fast Sct systems. In total, we detect objects which have periods less than min. We chose, for follow-up spectroscopic observations, objects which appear to us as either possibly relatively slow roAp stars, with the slowest known being HD ( d-1; Alentiev et al., 2012), or multi-periodic Sct stars.
| WASP | Other | V | A1 | … | A5 | ||
| ID | ID | (d-1) | (mmag) | (d-1) | (mmag) | ||
| 1SWASPJ000415.12-172529.6 | HD 225186 | 9.05 | 60.08 | 3.40 | … | – | – |
| 1SWASPJ000537.79+313058.8 | TYC 2259-818-1 | 11.70 | 52.92 | 1.47 | … | – | – |
| 1SWASPJ000830.50+042818.1 | TYC 4-562-1 | 10.16 | 150.26 | 0.76 | … | – | – |
| 1SWASPJ000940.84+562218.9 | TYC 3660-1935-1 | 10.34 | 66.37 | 3.15 | … | – | – |
| 1SWASPJ002436.35+165847.3 | HD 2020 | 8.50 | 54.41 | 3.40 | … | – | – |
| a Also available at CDS | |||||||
Of our spectroscopically observed targets, we classify stars as new pulsating Am stars, with a frequency range of d-1, and temperature range of K. However, we note that at classification resolution there is not always a clear distinction between Am and Ap stars. It is also possible that within this group of stars there are Ap stars which show multi-periodicity of the Sct type. Although it was not initially thought that Ap stars pulsate in the Sct range, Kurtz (2000) proposed a list of likely targets, with the first example of such a system being HD (Koen et al., 2001). Kepler observations have also detected this phenomenon in of the Ap stars that it has observed (e.g. Balona et al., 2011a). However, there are currently no known systems which exhibit both high overtone roAp pulsations and low overtone Sct pulsations. Theoretical work by Saio (2005) suggests that both high and low overtone p-modes cannot co-exist in magnetic Ap stars as Sct pulsations are suppressed by the presence of the magnetic field, whereas roAp pulsations can be enhanced. However, our survey has identified a few targets, such as J (Section 4.2.2), which show both low and high overtone p-modes in a single target. Further observation are needed, however, to eliminate any other explanations such as target blending and binary systems.
We present below four further targets which show pulsations above d-1 for which we have obtained spectra.
The remaining targets for which we obtained spectra are presented in Appendix A. We also provide an on-line catalogue of all the variable systems which show periods shorter than min. Table 5 shows an example of the on-line table format.
4.2.1 J
J is an interesting target as our observations show it to pulsate in two distinct frequency ranges (Fig. 19 top). We detect pulsational frequencies between and d-1 and between and d-1. We classify the star as A (Fig. 19 bottom), however we note different classifications recorded in the literature (e.g. A/III; Houk 1978, FV; Pickles & Depagne 2010, F (HD)). We detect low-frequency variations in J at a period of d. The phases folded plot (Fig. 20) shows that this target is most likely an ellipsoidal variable. In such a case, we do not expect this target to be a hybrid pulsator, but a pulsating non-eclipsing binary pair.


4.2.2 J
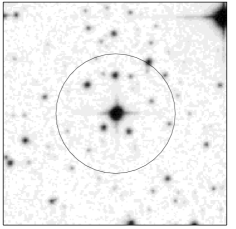
J also shows pulsations in two separate regions. However, here we have pulsations in the Sct range (, & d-1) and a single peak in the higher frequency domain ( d-1). We obtained a classification spectrum with the RSS spectrograph on SALT, revealing the star to be Am in nature. Similar to the blending problem we saw with J, J also has nearby objects which may have caused this multi-periodic lightcurve (Fig. 21). We again used the TRAPPIST telescope to confirm that J is the source of the pulsations (see Fig. 22). The star is listed in the Washington Double Star catalogue (WDS; Mason et al., 2001) with a separation of ″ based on two observations in the 1930s. We estimate the distance to J to be about pc, which suggests a binary separation of au. The two components of the visual binary system have magnitudes of and in the V-band (Mason et al., 2001). If the companion is a main-sequence star, given the spectral type of the primary, we estimate it to be a G-type star. We would expect none of the pulsations to originate from a G star. We propose that either both sets of pulsations originate on the Am star, or that there is an unresolved binary system with two pulsating components. Further observations are required to fully understand the nature of J.


4.2.3 J
J shows two pulsations over d-1. The strongest is at d-1 with an amplitude of mmag, with the second at d-1 with an amplitude of mmag. The Shane/HamSpec spectrum obtained for this target indicates that it is an Am: star based on a weakened Ca K line and slightly enhanced Sr. We note that there is no clear depletion of Sc ii. We estimate a of 50 km s-1 for J.


Low frequency variations are noted in the photometry, corresponding to a period of d (Fig. 24). When the data are folded on this period, the resulting phase diagram shows two maxima with unequal minima. The lightcurve indicates a binary target, where the pulsations may originate in one or both components. However there is no evidence for this in the single spectrum we obtained.
J is the fastest Am star that we have found with SuperWASP, superseding the previous fastest, HD (Smalley et al., 2011) pulsating at d-1. Our results have therefore pushed the boundary of the pulsating Am stars farther into the domain of the roAp stars, further blurring the distinction between these two types of pulsator.

4.2.4 J
J is a double-mode, high-frequency Am pulsating star similar in nature to J. It pulsates slightly slower than J at and d-1 (Fig. 25 top). We classify J as an Am star (Fig. 25 bottom).
We detect no low-frequency variability in the SuperWASP photometry, indicating that both pulsations are most likely originating in J. Multiple periods have previously been observed in Am stars (e.g. Joshi et al., 2003; Balona et al., 2011b), however not at the frequencies or amplitudes presented here.


5 Conclusion
We have exploited the SuperWASP archive in the search for rapidly varying F-, A- and B-type stars. Our survey, of over million objects, has resulted in the discovery of new roAp stars as well as new pulsating Am stars. Further to this, there are over systems which show variations on periods less than min.
The discovery of this number of new roAp stars increases the known stars of this class by per cent, providing a larger sample for further study.
This work shows the power of photometric surveys to identify a whole variety of variable stars. There are many more sources of data that can be exploited in a similar way to that which we have presented here for the search for rare and interesting pulsating stars. We have been able to push the previous limits of pulsation frequencies in some types of A stars, leading to a greater frequency overlap between different pulsator classes.
Acknowledgements
DLH acknowledges financial support from the STFC via the Ph.D. studentship programme. The WASP project is funded and maintained by Queen’s University Belfast, the Universities of Keele, St. Andrews, Warwick and Leicester, the Open University, the Isaac Newton Group, the Instituto de Astrofisica Canarias, the South African Astronomical Observatory and by the STFC. Some of the observations reported in this paper were obtained with the Southern African Large Telescope (SALT) under programs 2012-1-UKSC-001 (PI: BS), 2012-2-UKSC-001 (PI: DLH) and 2013-1-UKSC-002 (PI: DLH). TRAPPIST is a project funded by the Belgian Fund for Scientific Research (FNRS) with the participation of the Swiss National Science Foundation. The Digitized Sky Surveys were produced at the Space Telescope Science Institute under U.S. Government grant NAG W-2166. The images of these surveys are based on photographic data obtained using the Oschin Schmidt Telescope on Palomar Mountain and the UK Schmidt Telescope. The plates were processed into the present compressed digital form with the permission of these institutions. This publication makes use of data products from the Two Micron All Sky Survey, which is a joint project of the University of Massachusetts and the Infrared Processing and Analysis Center/California Institute of Technology, funded by the National Aeronautics and Space Administration and the National Science Foundation. We thank the referee, Donald Kurtz, for useful comments and suggestions.
References
- Aerts, Christensen-Dalsgaard & Kurtz (2010) Aerts C., Christensen-Dalsgaard J., Kurtz D.W., 2010, Asteroseismology, Springer
- Alentiev et al. (2012) Alentiev D., Kochukhov O., Ryabchikova T., Cunha M., Tsymbal V., Weiss W., 2012, MNRAS, 421, L82
- Amado et al. (2004) Amado P.J., Moya A., Suárez J.C., Martín-Ruiz S., Garrido R., Rodríguez E., Catala C., Goupil M.J., 2004, MNRAS, 352, L11
- Bakos et al. (2004) Bakos G., Noyes R.W., Kovács G., Stanek K.Z., Sasselov D.D., Domsa I., 2004, PASP, 116, 266
- Balmforth et al. (2001) Balmforth N.J., Cunha M.S., Dolez N., Gough D.O., Vauclair S., 2001, MNRAS, 323, 362
- Balona & Zima (2002) Balona L.A., Zima W., 2002, MNRAS, 336, 873
- Balona et al. (2011a) Balona L.A. et al., 2011a, MNRAS, 410, 517
- Balona et al. (2011b) Balona L.A. et al., 2011b, MNRAS, 414, 792
- Bevington (1969) Bevington P.R., 1969, Data reduction and error analysis for the physical sciences, New York: McGraw-Hill
- Borucki et al. (2010) Borucki W.J. et al., 2010, Science, 327, 977
- Breger (1970) Breger M., 1970, ApJ, 162, 597
- Breger et al. (1993) Breger M., et al., 1993, A&A, 271, 482
- Catanzaro et al. (2011) Catanzaro G. et al., 2011, MNRAS, 411, 1167
- Conti (1970) Conti P.S., 1970, PASP, 82, 781
- Debosscher et al. (2011) Debosscher J., Blomme J., Aerts C., De Ridder J., 2011, A&A, 529, A89
- Droege et al. (2006) Droege T.F., Richmond M.W., Sallman M.P., Creager R.P., 2006, PASP, 118, 1666
- Elkin, Kurtz & Mathys (2008) Elkin V., Kurtz D.W., Mathys G., 2008, Contr. Astron. Observ. Skalnate Pleso, 38, 317
- Evans, Irwin & Helmer (2002) Evans D.W., Irwin M.J., Helmer L., 2002, A&A, 395, 347
- Fouqué et al. (2000) Fouqué P. et al., 2000, A&AS, 141, 313
- Gautschy & Saio (1998) Gautschy A., Saio H., 1998, in Deubner F.L., Christensen-Dalsgaard J., Kurtz D.W., eds, Proc IAU Symp. 185, New Eyes to See Inside the Sun and Stars, Kyoto, Japan, p. 277
- Gilliland et al. (2010) Gilliland R.L. et al., 2010, ApJL, 713, L160
- Gray & Corbally (2009) Gray R.O., Corbally C.J., 2009, Stellar Spectral Classification. Princeton Univ. Press. Princeton, NJ
- Grigahcène et al (2010) Grigahcène A. et al., 2010, ApJL, 713, L192
- Høg et al. (1997) Høg E. et al., 1997, A&A, 323, L57
- Houk (1978) Houk N., 1978, Michigan catalogue of two-dimensional spectral types for the HD stars, University Microfilms International
- Huber (1981) Huber P.J., 1981, Robust Statistics, Wiley
- Jehin et al. (2011) Jehin E. et al., 2011, The Messenger, 145, 2
- Joshi et al. (2003) Joshi S. et al., 2003, MNRAS, 344, 431
- Koch et al. (2010) Koch D.G. et al., 2010, ApJL, 713, L79
- Kochukhov (2003) Kochukhov O., 2003, A&A, 404, 669
- Kochukhov et al. (2013) Kochukhov O., Alentiev D., Ryabchikova T., Boyko S., Cunha M., Tsymbal V., Weiss W., 2013, MNRAS, 431, 2808
- Koen et al. (2001) Koen C., Kurtz D.W., Gray R.O., Kilkenny D., Handler G., Van Wyk F., Marang F., Winkler H., 2001, MNRAS, 326, 387
- Koen (2010) Koen C., 2010, Ap & SS, 329, 267
- Kreidl (1990) Kreidl T. J., 1990, Inf. Bull. Var. Stars, 3539, 1
- Kurtz (1981) Kurtz D.W., 1981, Inf. Bull. Var. Stars, 1915, 1
- Kurtz (1982) Kurtz D.W., 1982, MNRAS, 200, 807
- Kurtz (1989) Kurtz D.W., 1989, MNRAS, 238, 1077
- Kurtz (1990) Kurtz D.W., 1990, ARA&A, 28, 607
- Kurtz (2000) Kurtz D.W., 2000, in Brege M., Montgomery M.H., eds, ASP Conf. Ser. Vol. 210, Delta Scuti and Related Stars. Astron. Soc. Pac., San Francisco, p. 287
- Kurtz & Martinez (1993) Kurtz D.W., Martinez P., 1993, Inf. Bull. Var. Stars, 3966, 1
- Kurtz et al. (2011) Kurtz D.W. et al., 2011, MNRAS, 414, 2550
- Kurucz (1993) Kurucz R.L., 1993, Kurucz CD-ROM 13. SAO, Cambridge, USA
- Lenz & Breger (2005) Lenz P., Breger M., 2005 CoAst, 146, 53
- Martinez & Kurtz (1990) Martinez P., Kurtz D.W., 1990, Inf. Bull. Var. Stars, 3510, 1
- Martinez & Kurtz (1994) Martinez P., Kurtz D.W., 1994, MNRAS, 271, 118
- Martinez et al. (2000) Martinez P. et al., 2000, Inf. Bull. Var. Stars 4853, 1
- Mason et al. (2001) Mason B.D., Wycoff G.L., Hartkop, W.I., Douglass G.G., Worley C.E., AJ, 122, 3466
- Maxted et al. (2011) Maxted P.F.L. et al., 2011, PASP, 123, 547
- Monet et al. (2003) Monet D.G. et al., 2003, AJ, 125, 984
- Norton et al. (2011) Norton A.J. et al., 2011, A&A, 528, A90
- Pickles & Depagne (2010) Pickles A., Depagne É., 2010, PASP, 122, 1437
- Pojmański (1997) Pojmański G., 1997, AcA, 47, 467
- Pollacco et al. (2006) Pollacco D.L. et al., 2006, PASP, 118, 1407
- Press et al. (1989) Press W.H., Rybicki G.B., 1989, ApJ, 338, 277
- Press et al. (1992) Press W.H., Teukolsky S.A., Vetterling W.T., Flannery B.P., 1992, Numerical recipes in FORTRAN. The art of scientific computing, Cambridge University Press
- Paunzen et al. (2012) Paunzen E., Netopil M., Rode-Paunzen M., Handler G., Božić H., Ruždjak D., Sudar D., 2012, A&A, 542, A89
- Reegen (2007) Reegen P., 2007, A&A, 467, 1353
- Renson & Manfroid (2009) Renson P., Manfroid J., 2009, A&A, 498, 961
- Rusomarov et al. (2013) Rusomarov N. et al., 2013, A&A, 558, A8
- Saio (2005) Saio H., 2005, MNRAS, 360, 1022
- Sktrutskie et al. (2006) Skrutskie M.F. et al., 2006, AJ, 131, 1163
- Smalley et al. (2011) Smalley B. et al., 2011, A&A, 535, A3
- Smalley (2013) Smalley B., 2013, in Chaplin W., Guzik J., Handler G., Pigulski A., eds, Proc IAU Symp. 301, Precision Asteroseismology, in press
- Smalley, Smith & Dworetsky (2001) Smalley B., Smith K.C., Dworetsky M.M. 2001. UCLSYN User Guide http://www.astro.keele.ac.uk/~bs/publs/uclsyn.pdf
- Smith (1973) Smith M.A., 1973, ApJS, 25, 277
- Stibbs (1950) Stibbs D.W.N., 1950, MNRAS, 110, 395
- Stoehr et al. (2008) Stoehr F. et al., 2008, in Argyle, R.W., Bunclark, P.S., Lewis, J.R. eds, ASP Conf. Ser. Vol. 394, Astronomical Data Analysis Software and Systems XVII. Astron. Soc. Pac., San Francisco, p. 505
- Tamuz, Mazeh & Zucker (2005) Tamuz O., Mazeh T., Zucker S., 2005, MNRAS, 356, 1466
- Udalski et al. (1992) Udalski A., Szymanski M., Kaluzny J., Kubiak M., Mateo M., 1992, AcA, 42, 253
- Vogt (1987) Vogt S.S., 1987, PASP, 99, 1214
- Wolff (1968) Wolff S.C., 1968, PASP, 80, 281
Appendix A Spectroscopically observed targets
Below we present the periodograms and spectra for the remaining spectroscopically observed targets.


