Comments concerning the paper ”Measurement of negatively charged pion spectra in inelastic p+p interactions at 20, 31, 40, 80 and 158 GeV/c” by the NA61 collaboration
1 Introduction
The study of inclusive hadron production in p+p interactions has a long history. It has closely followed the steady evolution of particle accelerators towards higher interaction energies as well as the development of novel detector technologies. Although the measurement of particle yields in well-defined regions of the available phase space might seem to be a rather trivial undertaking, the achievement of high precision presents a real challenge to the experimentalist in terms of absolute normalization and the control of systematic effects, in particular concerning the necessary corrections for detector and accelerator connected effects. The term of ”precision” has to be defined here very carefully. In fact a survey of the existing data reveals that it is the evaluation of systematic errors rather than the available event statistics that is the limiting factor. Indeed only a few experiments have achieved cross section measurements with a systematic uncertainty in the one to two percent range. It is on this level that one may talk about ”high precision” data, and this performance has shown no real evolution over the past few decades of experimental work. It is by no means true that the use of state-of-the-art detector technology would automatically ensure superior data quality. Indeed any new attempt at producing ”precision” data has to take full account of the preceding work. It is in this sense that this paper presents a critical review of new data on yields produced by the NA61 collaboration in the range of beam momenta from 20 to 158 GeV/c [1]. In the introduction to their publication the authors claim that ”the available data concern mainly basic features of unidentified charged hadrons and they are sparse. Many needed results on hadron spectra are missing”. And they continue: ”Thus new high precision measurements on hadron production properties in p+p interactions are necessary…”. These claims are put to a stringent test in the present comments, and it will be shown that the new data are by no means superior to existing results. In fact the NA61 results are found to be less precise than a set of reference experiments over the full range of the studied beam momenta.
This paper is arranged as follows. After an introduction to the experimental situation concerning inclusive pion production, a set of reference experiments in the range of beam momenta from 12 to 158 GeV/c is recalled in Sect. 3. Section 4 describes some aspects of the new NA61 results. A detailed comparison of these data with the published reference experiments follows for the total yields in Sect. 5, for the integrated rapidity distributions in Sect. 6 and for the double differential cross sections in Sect. 7. Some remarks concerning normalization problems in Sect. 8 conclude the paper.
2 The experimental situation
Most early experiments studying secondary hadron production in p+p interactions have been using hydrogen bubble chambers. This technique has a decisive advantage over all other detectors in terms of the continuous phase space coverage, perfect absolute normalization and only small corrections for detector related effects. Hence it offers superior performance concerning the systematic uncertainties.
For beam momenta up to about 5 GeV/c, the study of fully constrained exclusive final states has been possible using kinematical fitting. Above this limit, the transition to inclusive single particle cross sections had to be accepted due to the increased total multiplicity including numerous non-detected neutral hadrons. This accentuated the inherent weakness of bubble chamber data in terms of particle identification and of the rather sharp limitation in the size of the obtainable data samples. For the study of production however the former limitation is of less importance in energy regions where the K-/ and / ratios remain limited to the few percent level and methods of precise corrections have been developed, especially making use of the complete phase space coverage of the bubble chamber results. These methods have been employed up to beam momenta of about 70 GeV/c.
The alternative detector technique using small solid angle magnetic spectrometers allows for complete particle identification using for instance Cerenkov or time-of-flight detectors. Its weaknesses lie in the increased problems around calibration, normalization and corrections as well as in the generally very limited and fractional coverage of the production phase space. In fact not a single spectrometer experiment has been covering the complete phase space in one set-up. The introduction of the Time Projection Chamber (TPC) as a large solid angle detector permitting combined precision tracking and particle identification has remedied at least part of these problems. It offers, in fixed target experiments, identification over a major fraction of phase space via energy loss measurement with the exception of the cross-over region between the energy loss of the different particle species at about 1–3 GeV/c laboratory momentum. This corresponds to different areas in accessible phase space as a function of beam momentum. In addition TPC detectors need, as they are used in conjunction with targets of beam interaction lengths of at most a few percent, external triggering which introduces non-trivial and sizeable corrections.
In the following sections a number of existing results in the range of beam momenta covered by the NA61 experiment will be used as a reference for a detailed comparison with the new data. In this comparison the following definitions and variables will be used:
-
•
laboratory beam momentum (GeV/c)
-
•
transverse momentum (GeV/c)
-
•
cms energy squared ( = proton mass) (GeV2)
-
•
cms rapidity ( cms longitudinal momentum)
-
•
average number of per inelastic event
-
•
transverse mass ( = pion mass)
-
•
invariant inclusive cross section
-
•
pion density per inelastic event
-
•
integrated pion density per inelastic event
3 The reference experiments
3.1 Beam momenta, event samples and systematic uncertainties
A series of eight published experiments have been selected in the range 12 158 GeV/c. These are completely bracketing the NA61 beam momenta. Some information concerning the beam momenta, cms energies and the size of the event samples are summarized in Table 1.
| (GeV/c) | 12 | 19 | 24 | 28.5 | 32 | 69 | 100 | 158 |
|---|---|---|---|---|---|---|---|---|
| reference | [2] | [3] | [2] | [4] | [5] | [6] | [7] | [8] |
| (GeV) | 4.92 | 6.12 | 6.84 | 7.43 | 7.85 | 11.45 | 13.76 | 17.27 |
| events used | 175k | 8k | 100k | 30k | 100k | 8k | 4k | 4700k |
| detector | HBC | HBC | HBC | HBC | HBC | HBC | HBC | TPC |
It should be mentioned here that the event numbers of the bubble chamber experiments, especially refs. [2, 5] are rather sizeable for this detector technique and well adapted to the systematic errors, see below.
All reference experiments have published and rapidity distributions . In addition double differential cross sections are available in [2, 5, 6, 8]. The bubble chamber experiments [2, 3, 4, 5, 6, 7] achieve measurements of the total charged multiplicity with a precision of about 1%. For the event numbers given in Table 1 this uncertainty is in most cases not governed by the statistical errors. For the given errors are about 2%, again not dominated by statistics. The TPC experiment NA49 [8] gives an overall systematic uncertainty of 2%. This means that all reference data offer a systematic precision on the 2% level.
3.2 Particle identification
The situation concerning the contribution of K- and anti-protons is clarified in Fig. 1.
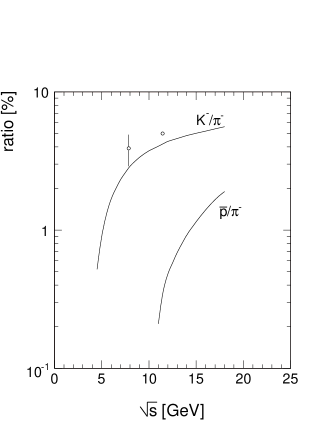
It is apparent from Fig. 1 that in relation to an overall systematic uncertainty of 2% the K- and contributions are of importance above 5 GeV and 14 GeV, respectively. The K- and yields are directly determined by energy loss analysis in the NA49 experiment [9, 10]. The bubble chamber experiments at 32 and and 69 GeV/c beam momentum have used either a direct determination of the K- yields [5] or corrections derived from the measurement of K cross sections [6] in order to take account of the kaon contributions. Reference [5] measures a K-/ ratio of 4%1.5%, ref. [6] gives a correction of 5–6%, see Fig. 1. It may therefore be concluded that at least to an accuracy within the given systematic errors the identification of yields has been achieved. For the group of measurements at beam momenta between 19 and 28.5 GeV/c [2, 3, 4] no subtraction of K- contributions has been attempted in the published results. As in this energy region the K-/ ratio is of order 1.7–2.2%, a corresponding reduction of the published yields has been performed in the subsequent sections of this paper. The data [7] at = 100 GeV/c need a somewhat bigger downward correction of about 5%, see Fig. 1. Here the internal consistency with the other reference data may be controlled regarding the energy dependence of the total yields and of the rapidity distributions, Sects. 5 and 6.
4 The NA61 experiment
4.1 Beam momenta, event samples and systematic uncertainties
Some information about the NA61 data [1] concerning the beam momenta and the number of used events is given in Table 2.
| (GeV/c) | 20 | 31 | 40 | 80 | 158 |
|---|---|---|---|---|---|
| (GeV) | 6.27 | 7.74 | 8.76 | 12.32 | 17.27 |
| events used | 233k | 843k | 1580k | 1540k | 1650k |
The available event numbers are superior to the ones of the bubble chamber experiments [2, 3, 4, 5, 6, 7], however this advantage is offset by the very sizeable systematic uncertainties. The bin-by-bin distributions of the given systematic errors are shown in Fig. 2.
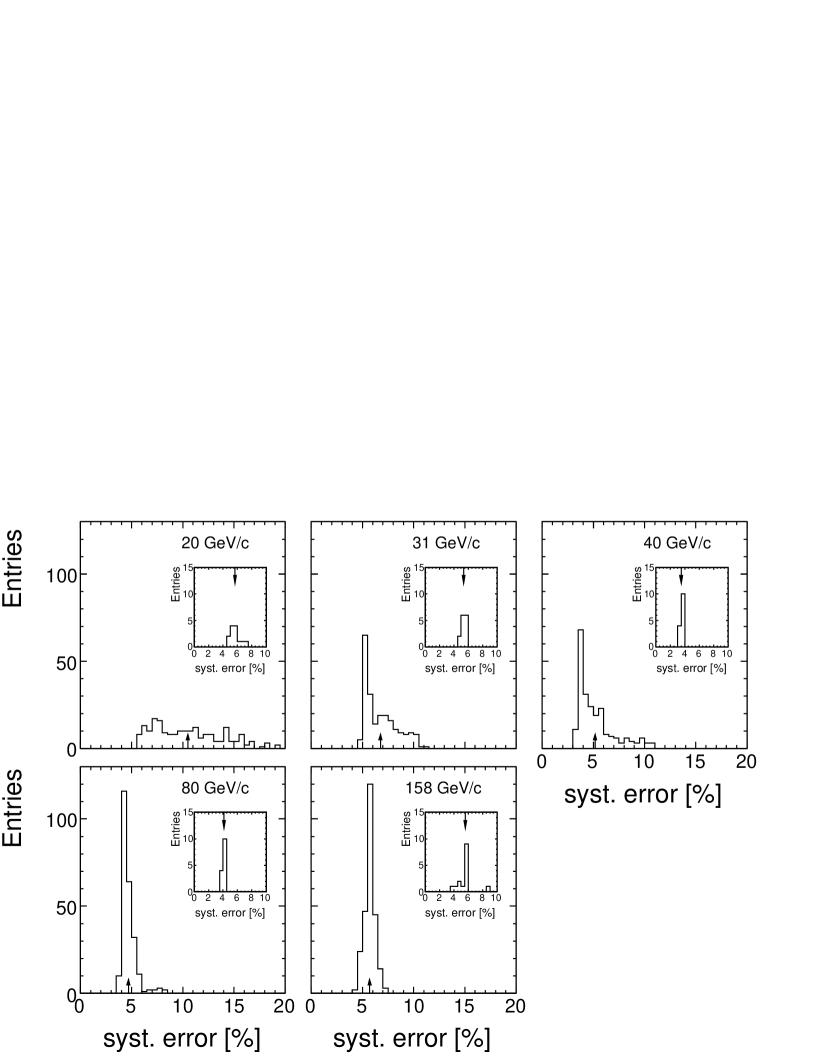
Evidently the NA61 data feature rather important systematic uncertainties on the bin-to-bin level, with a minimum at about 5–6% and maximum values reaching up to 20% at low beam momenta. This means that these errors are by factors of 3–10 above the ones published by the reference experiments. The strong difference between the uncertainties of the integrated quantities, see inserts in Fig. 2, and the ones given for the individual bins are somewhat surprising. They would indicate very strong bin-to-bin correlations due to finite transverse momentum resolution. Given the event statistics of order 1–2 Mevents it may be stated that the experimental errors are governed by systematics rather than by statistical fluctuations.
4.2 Particle identification
NA61 does not attempt to use the superior particle identification capabilities offered by its TPC detectors [8, 9, 10] with the exception of a correction for electron contamination. Instead, the yields of all negative hadrons (h-) are determined and a correction for K- and contributions is applied using a microscopic production model [11]. No quantitative information is given in [1] as to the precision to which this model might describe the K- and yields as functions of and rapidity. A detailed comparison would be particularly mandatory in view of the recent work on the -dependence of kaon and baryon production published by NA49 [9, 10].
5 Total yields
For a precise comparison of the following reference data from experiments only giving the total yields, Table 3, have been added to the list of Table 1.
| (GeV/c) | 2.23 | 2.78 | 3.68 | 5.50 | 6.60 | 60 | 100 | 102 | 205 | 300 | 400 |
|---|---|---|---|---|---|---|---|---|---|---|---|
| ref. | [12] | [13] | [14] | [15] | [16] | [17] | [18] | [19] | [20] | [21] | [19, 22, 23] |
With the exception of the low-energy measurements [12, 13, 14, 15, 16] and the EHS experiment [23] the data are obtained from . They have been corrected for K- and contributions using the particle ratios of Fig. 1. The resulting average yields are given in Fig. 3 as a function of s1/4.
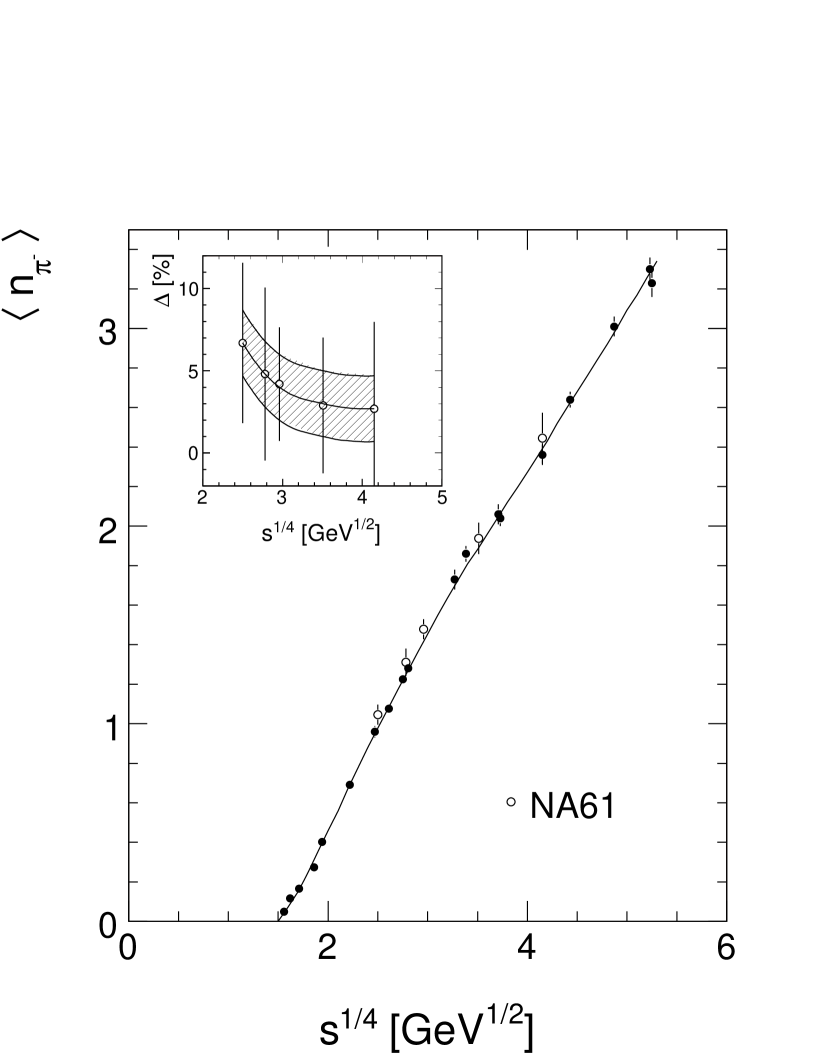
It is evident from Fig. 3 that the NA61 data lie above the reference results for all values of . The percent deviation increases with decreasing beam momentum and reaches 7% at = 20 GeV/c (insert of Fig. 3).
The deviations which are visible in Fig. 3 have direct consequences for the overall precision of the NA61 experiment. If the yield is increased, the h+ yield has to follow upwards, albeit with a smaller percentage, in order to not violate charge conservation. This will in turn offset the total charged multiplicity which is measured to a one percent systematic accuracy by most reference experiments.
6 Rapidity distributions
6.1 Reference rapidity density distributions as a function of and
The single differential, integrated rapidity distributions constitute a next step towards a more detailed inspection of the NA61 results. All reference experiments cited in Table 1 have published rapidity distributions. These have been interpolated to the rapidity values published in [1]. The resulting rapidity densities are shown in Fig. 4 as a function of beam momentum for the rapidity range from 0.1 to 2.7. The data points (full dots) are interpolated in by the full lines.
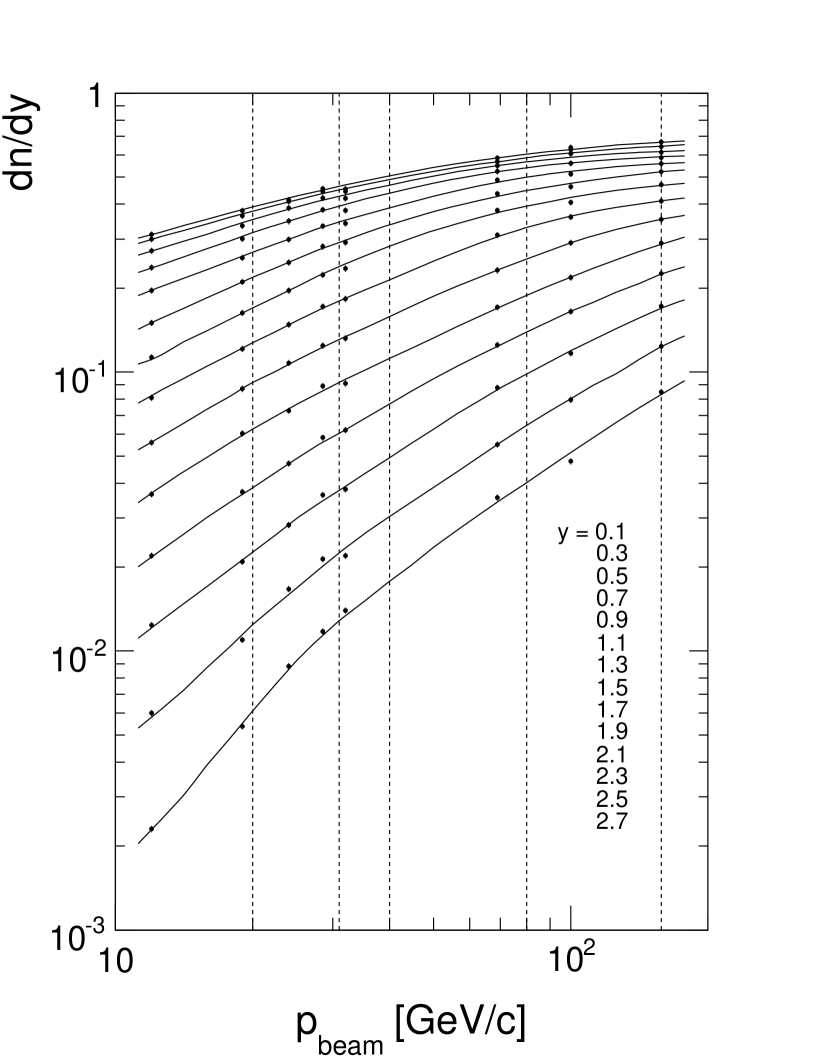
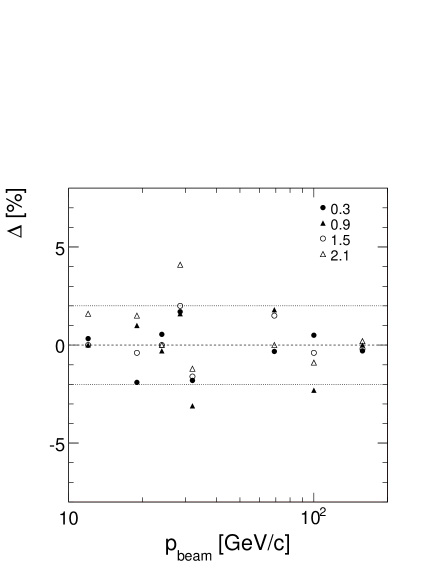
Evidently the eight cited experiments constitute a data sample which is internally consistent and compatible with a continuous and smooth dependence both on and on rapidity. The deviations of the data points from the interpolation are consistent with the systematic uncertainty of 2% given by all experiments. This is exemplified in Fig. 5 where the percent deviations of the data points with respect to the interpolated dependence are shown for four rapidity values between 0.3 and 2.1.
6.2 Comparison to the NA61 results
The global data sample contained in Fig. 4 may now be compared to the NA61 results at the five respective beam momenta between 20 and 158 GeV/c. This comparison is presented in the five panels of Fig. 6 giving the relative difference in percent between the NA61 results and the reference data interpolation to the NA61 beam momenta.
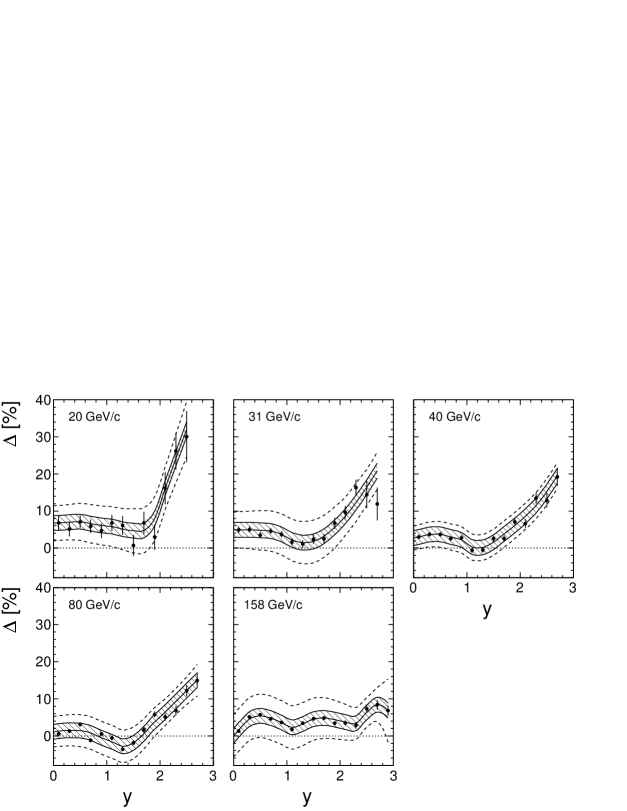
Very substantial deviations appear in this comparison of the single differential distributions. There is in general a structure with positive deviations at low and high rapidity and an intermediate minimum around = 1.3–1.5. The minimum becomes slightly negative at = 40 and 80 GeV/c. The positive deviations reach typical values of about 6% at low and between 10 and 30% at 2 with a clear dependence on beam momentum. This corresponds to discrepancies of more than 4 standard deviations even compared to the larger NA61 errors.
6.3 Gaussian fits
The fitting of rapidity distributions with two symmetrically displaced Gaussians appears to be a standard procedure of NA61 in order to represent their data both for the elementary p+p and for A+A interactions. It is of course not to be expected that the physics of soft hadron production would satisfy such a simplistic arithmetic parametrization. This is demonstrated in Fig. 7 which shows the comparison between the double Gaussian fit and the NA61 data (full dots) and the published NA49 data (open circles) at 158 GeV/c beam momentum.
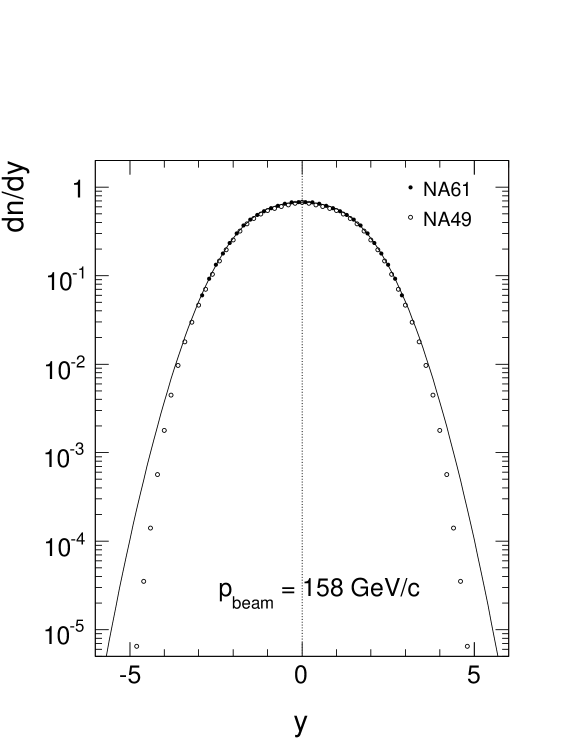
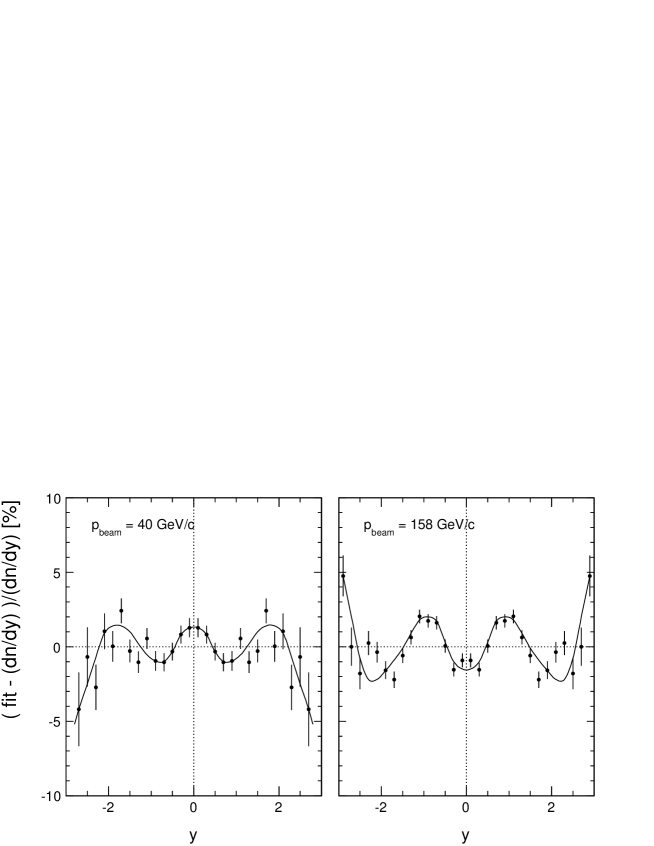
Beyond the rapidity range covered by the NA61 data, the parametrization diverges from the published data by a factor of 2 at = 4 and by more than one order of magnitude at = 4.8. But also within the rapidity range of the NA61 measurements there are important systematic differences between data and fit as presented in Fig. 8 for the beam momenta of 40 and 158 GeV/c.
7 Double differential cross sections
A final step in the critical assessment of the NA61 results consists in scrutinizing the double differential densities in comparison to the reference experiments that have given cross sections as a function of both y and .
7.1 Comparison to NA49 at = 158 GeV/c
NA49 has published [8] detailed interpolated invariant cross sections as functions of Feynman and . These data are given in steps of 0.05 GeV/c in and may be readily interpolated to the rapidity values chosen by NA61. The corresponding relative differences, given in percent of the NA49 cross sections, are shown in Fig. 9 for 6 values of as a function of rapidity.
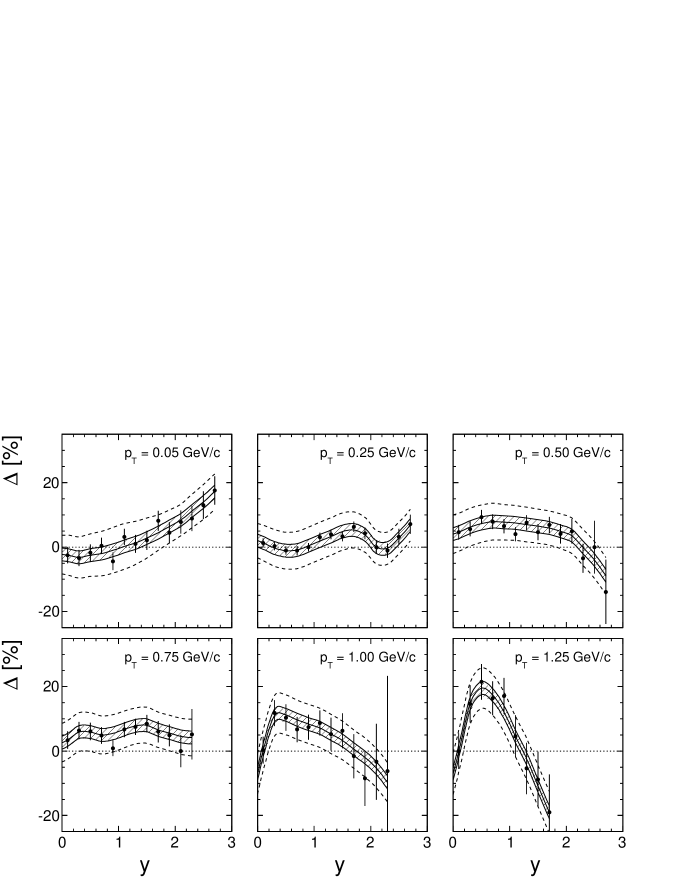
Very substantial deviations of the NA61 data from the NA49 results are visible in Fig. 9. These deviations show a systematic behaviour, reaching up to 20% of the NA49 values.
7.2 Comparison to the bubble chamber reference [2]
Double differential cross sections at = 12 and 24 GeV/c have been published by [2] as functions of and rapidity. These data have been interpolated to the beam momentum of 20 GeV/c and compared to the NA61 results. The resulting relative differences in percent are shown in Fig. 10.
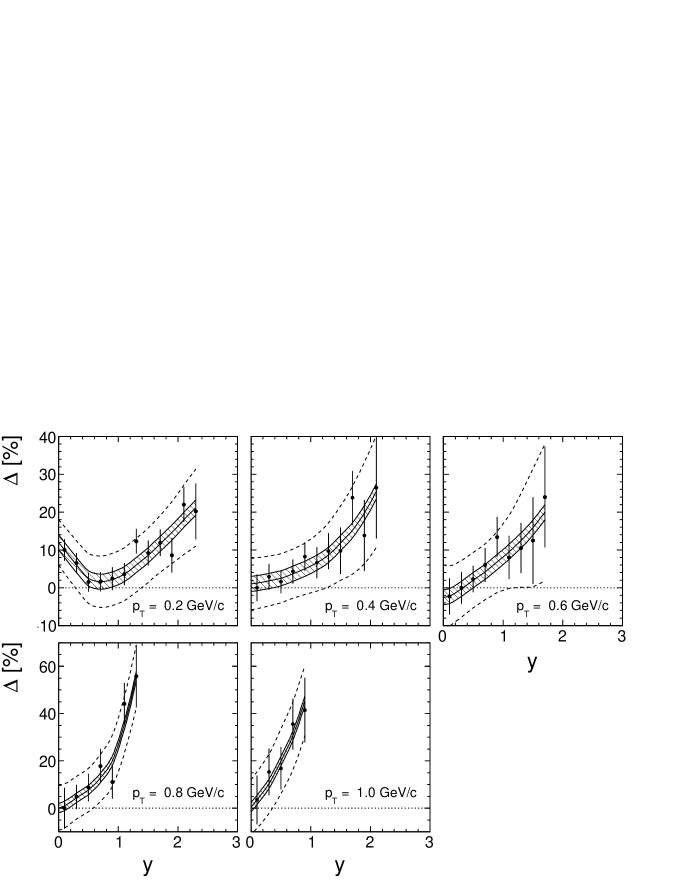
Also at this beam momentum large discrepancies up to a 40–50% level are evident, with a systematic rapidity dependence that changes strongly with transverse momentum.
7.3 Inverse slopes of the distributions (”temperature”)
NA61 has chosen to fit their distributions by an exponential within the limits 0.2 0.7. The lower limit is positioned well above the mean such that, at central rapidity and = 158 GeV/c, only 44% of all fall within this bin. The inverse slope of a supposedly exponential distribution is generally connected to a thermodynamic quantity called ”hadronic temperature”. It may be asked what relation an exponential fit over this small interval may have to this quantity. Indeed, the dependence of the inverse slope on may be extracted from the published NA61 data by using a local exponential fit to three successive data points. This is shown in Fig. 11 for the most central rapidity bin at = 158 GeV/c.
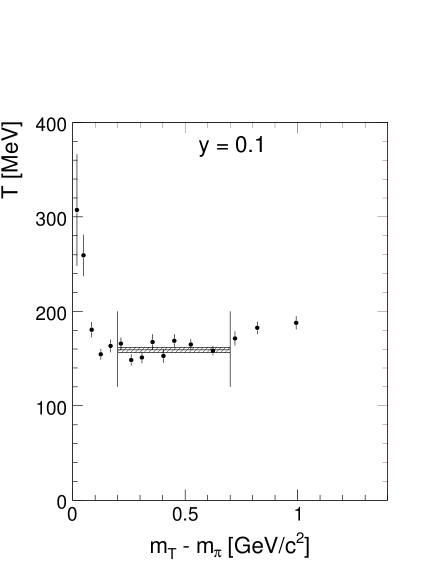
A look at Fig. 11 shows that the fit limits appear to have been chosen to cover mainly the region of the dependence that might be called exponential within the sizeable statistical bin-by-bin errors. Immediately below and above these limits the inverse slopes increase towards low and high . In fact the distributions have been shown to be non-exponential for pions [8], kaons [9] and baryons [10] by the NA49 collaboration. This is very evident looking at the corresponding inverse slopes for as a function of as published, with an event number three times higher than NA61, by NA49 [8], see Fig. 12.

Indeed there is practically no region in this plot where the inverse slopes may be called constant. Between the cut limits 0.2 0.7 of the NA61 analysis there is a systematic change of the inverse slopes by about 15 MeV, to be compared to the given systematic error of the NA61 fit of only 2.7 MeV. In this context also the comparison of the inverse slopes between central Pb+Pb and p+p interactions [1] (Fig. 18) needs comment. The published Pb+Pb data [25] show a very strong dependence of the inverse slopes on , see Fig. 13.
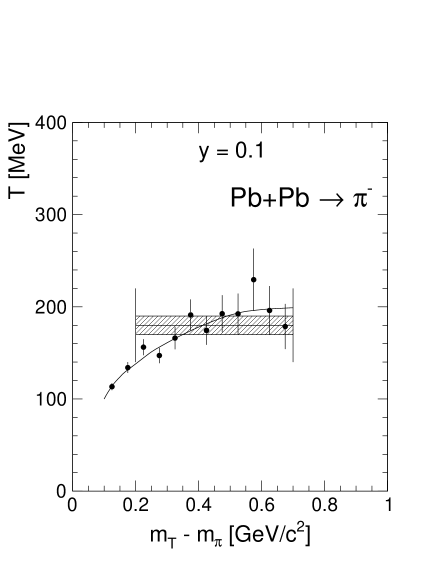
In view of a variation of the inverse slopes of about 100 MeV in the interval 0.1 0.7 GeV/c2 the very concept of a well-defined and constant ”hadronic temperature” must be questioned.
The value of 180 MeV quoted in [1] (Fig. 18) with a systematic error of only 10 MeV, will change to 163 MeV by changing the fit interval from 0.2 0.7 GeV/c2 to 0.1 0.6 GeV/c2 while the same change in the p+p data will keep the value stable to within 1 MeV. In addition it should be recalled that the inverse slopes have to diverge upwards in the approach to = = 0 as the invariant cross section crosses this value with slope zero.
8 Corrections and normalization
Given the large discrepancies between the NA61 results and the set of reference experiments described above, it should be mandatory to localize apparative and experimental effects that might be responsible for the observed problems. This would concern in particular the size of the corrections to the raw data and the way the results are normalized. Unfortunately there are no quantitative informations available in [1] with respect to these important ingredients to the data analysis. The reader might use the repeated statement that the systematic errors are enumerated as 20-40% of the applied corrections to estimate that the corresponding corrections might reach values of up to or bigger than 50%. Concerning the absolute normalization the statement concerning a change of the target density with time in Sect. 3 of the paper [1] would indicate that the standard normalization via a model-independent direct measurement of the trigger cross section [8] was impossible, see also the comments in [24]. Instead the normalization has to rely completely on the comparison to a microscopic model [11]. The event losses due to the interaction trigger of NA61 are almost completely located in the diffractive sector of the strong interaction, a sector that is notoriously ill described by the standard microscopic models as those do not contain the production and cascading decays of N∗ resonances which dominate this region of phase space. Furthermore, the used production model will not only have to describe exactly the inclusive yields of forward particles hitting the trigger counter, but also the correlation of these particles with secondary in order to quantify the correction to be applied at lower rapidity. This correction is strongly dependent on and [8]. In this context the statement that ”the results presented in this paper are determined from particle yields per selected event” does not take into account that all reference yields discussed in the present comments are referred to the total inelastic cross section and not to an undetermined trigger cross section.
9 Conclusion
New data on negative pion production from the NA61 collaboration in the range of beam momenta from 20 to 158 GeV/c have been compared to a wide range of reference data in the same energy region. Important deviations of the new data from the existing results have been revealed. These discrepancies increase in the successive steps from the total pion yields via the single differential rapidity distributions to the double differential invariant cross sections.
References
- [1] N. Abgrall et al., CERN-PH-EP-2013-182, submitted to Eur. Phys. J. C
- [2] V. Blobel et al., Nucl. Phys. B69 (1974) 454
- [3] H. Boggild et al. Nucl. Phys. B57 (1973) 77
- [4] W. H. Sims et al. Nucl. Phys. B41 (1972) 317
- [5] E. E. Zabrodin et al., Phys. Rev. D52 (1995) 1316
- [6] V. V. Ammosov et al., N. Cim. 40A (1977) 237
- [7] W. M. Morse et al., Phys. Rev. D15 (1977) 66
- [8] C. Alt et al., Eur. Phys. J. C45 (2006) 343
- [9] T. Anticic et al., Eur. Phys. J. C68 (2010) 1
- [10] T. Anticic et al., Eur. Phys. J. C65 (2010) 9
- [11] K. Werner, Nucl. Phys. B175 (2008) 81
- [12] A. M. Eisner et al., Phys. Rev. 138 (1965) 670
- [13] E. Pickup et al., Phys. Rev. 125 (1962) 2091
- [14] G. A. Smith et al., Phys. Rev. 123 (1961) 2160
- [15] G. Alexander et al., Phys. Rev. 154 (1967) 1284
- [16] E. R. Gellert, LBL-749 (1972)
- [17] C. Bromberg et al., Phys.Rev. D15 (1977) 64
- [18] J. Erwin et al., Phys. Rev. Lett. 32 (1974) 254
- [19] C. Bromberg et al., Phys. Rev. Lett. 31 (1973) 1563
- [20] S. Barish et al., Phys. Rev. D9 (1074) 2689
- [21] A. Firestone et al., Phys.Rev. D10 (1974) 2080
- [22] R. D. Kass et al. Phys.Rev. D20 (1979) 605
- [23] M. Aguilar-Benitez et al., Z. Phys. C50 (1991) 405
- [24] NA61 progress report 2012, CERN-SPSC-2012-029
- [25] S. Afanasiev et al., Phys. Rev. C66 (2002) 054902