The Inner Dynamical Mass Across Galaxy Morphology:
A Weak Scaling with Total Stellar Mass
Abstract
We compile a sample of dispersion-supported and rotation-supported galaxies for which the dynamical mass enclosed at 500 pc can be measured. We find that this dynamical quantity increases only slowly with stellar mass () over 9 decades in baryonic mass and 3 in length scale, with a sudden upturn at the highest masses (). This upturn occurs for the earliest type (S0 and Sa) disk galaxies, and is consistent with the “extra” mass within 500 pc being predominantly stellar. This sudden change may be indicative of different bulge formation mechanisms between early and late type disks. We also compare the data to the results of recent galaxy formation simulations. These broadly track the observed trend, with some tendency to put too much mass in the inner 500 pc, depending on the details of each simulation.
Subject headings:
galaxies: formation — galaxies: structure1. Introduction
Galaxy formation remains one of the more vexing problems in extragalactic astronomy. As shown in recent papers such as Brook et al. (2012a), Governato et al. (2012), Di Cintio et al. (2013), and Vogelsberger et al. (2013), galaxy simulations that aim to reproduce the observed properties of galaxies and their dark matter halos over a wide range of masses have become increasingly complex and comprehensive. Simulations are probing, among other topics, the seeding and growth of black holes, the chemical enrichment of galaxies, the formation of bulgeless disk galaxies, and the ability of stellar feedback to modify the inner structure of dark matter halos. The simulations often tackle more than one of these issues simultaneously.
To evaluate how realistic the modeled formation processes and resulting simulated galaxies are, having a well-studied and understood sample of real, observed galaxies with which to compare is necessary. Galaxy observations provide important constraints on the initial input parameters to the simulations and also define the final galactic structure and composition that should be achieved.
In this Letter, we compile data for a sample of dwarf spheroidal and early and late-type disk galaxies and characterize their inner mass structure. We investigate the amount of total enclosed dynamical mass inside of 500 pc across galaxy type and total baryonic mass. We also directly compare recent galaxy simulations to the data to determine how well they reproduce observed galaxy structure.
2. Data
We collect data for a sample of 50 dispersion- and 61 rotation-supported systems. The dispersion-supported systems are Local Group dwarf spheroidal (dSph) galaxies with measured half-light radii and stellar velocity dispersions. The data are taken from Walker et al. (2007), McConnachie (2012), and Collins et al. (2013). These systems have total luminosities ranging from 103107 .
The rotation-supported systems are disk galaxies of all morphological types with published rotation curves from Begum & Chengalur (2004), de Blok & Bosma (2002), de Blok et al. (2001), de Blok et al. (2008), Kuzio de Naray et al. (2008), Noordermeer et al. (2007), Oh et al. (2011), Sanders (1996), Sofue et al. (1999), Trachternach et al. (2009), and Verheijen & Sancisi (2001). These include bright, early-type spirals and low mass dwarf irregulars, and both high and low surface brightness galaxies. The sample of disk galaxies covers a large range in mass, with ranging from 20300 km s-1. The unifying property of the sample is the availability of dynamical data at small radii.
For each dSph and disk galaxy, we compile , , , , and (500 pc). For the disk galaxy sample, we also compile the disk type using the HyperLeda database (Paturel et al., 2003). is the total stellar mass of a galaxy. We assume a stellar mass-to-light ratio = 1 when computing for the dSphs (Martin et al., 2008). For the disk galaxies, we calculate the total stellar mass using the Baryonic Tully-Fisher Relation (BTFR) of McGaugh (2012). For , 1.33 is taken as the total gas mass of a galaxy. , the total baryonic mass of a galaxy, is the sum of and . The effective radius, , is the half-light radius in for the dSph sample, and 1.7 times the disk scale length in or for the disk galaxy sample.
We measure the total dynamical mass (stars+gas+dark matter) (500 pc) inside of 500 pc. Our primary motivation for choosing 500 pc is so that we can evaluate dSph and disk galaxies at the same scale. As discussed in detail in Section 3, this radius is a compromise for both types of galaxies: the half-light radius for dSphs is often less than 500 pc, but resolution and non-circular motions can affect rotation curves at smaller radii.
To calculate (500 pc) for the dispersion-supported dSph galaxies, we use Equation 10 of Walker et al. (2009)
| (1) |
and evaluate it at r = 500 pc.
As discussed in the Walker et al. (2009) paper, this equation provides enclosed mass estimates for dispersion-supported galaxies that are comparable to the masses obtained from a full Jeans/MCMC analysis if it is applied “near” the half-light radius. The half-light radii of the dSphs in our sample range from tens of pc to 1 kpc, with the majority being around 250 pc. We discuss the applicability/implementation of Equation 1 to our dSph sample below.
For eight “classical” dSphs in our sample, (500 pc) is provided by M.G. Walker (2013, private communication). These values are calculated using a complete Jeans/MCMC analysis. We use these data to determine a correction factor, , that we apply to the (500 pc) values calculated for the dSph sample using Equation 1. This correction factor is the ratio of the fully modeled mass to the mass estimated by Equation 1 as a function of the difference between 500 pc and the half-light radius: We discuss in Section 3.1 the typical size of this correction and the uncertainty of (500 pc) values calculated for the dSphs111We attempted a similar exercise for giant ellipticals, but lack sufficient information to construct the equivalent of Equation 1. using Equation 1.
We lack detailed mass models for some of the assembled disk galaxies, so we assume spherical symmetry: with pc. This is a tolerable assumption for very late types, which tend to be dominated by their dark matter halos, and for very early types in which the bulge component dominates the inner mass budget. For intermediate types, the stellar disk can dominate the mass budget at small radii, but deviations from the spherical approximation are at most tens of percent in mass, a negligible amount over the scales considered.
3. Results
3.1. Total Enclosed Mass at 500 pc
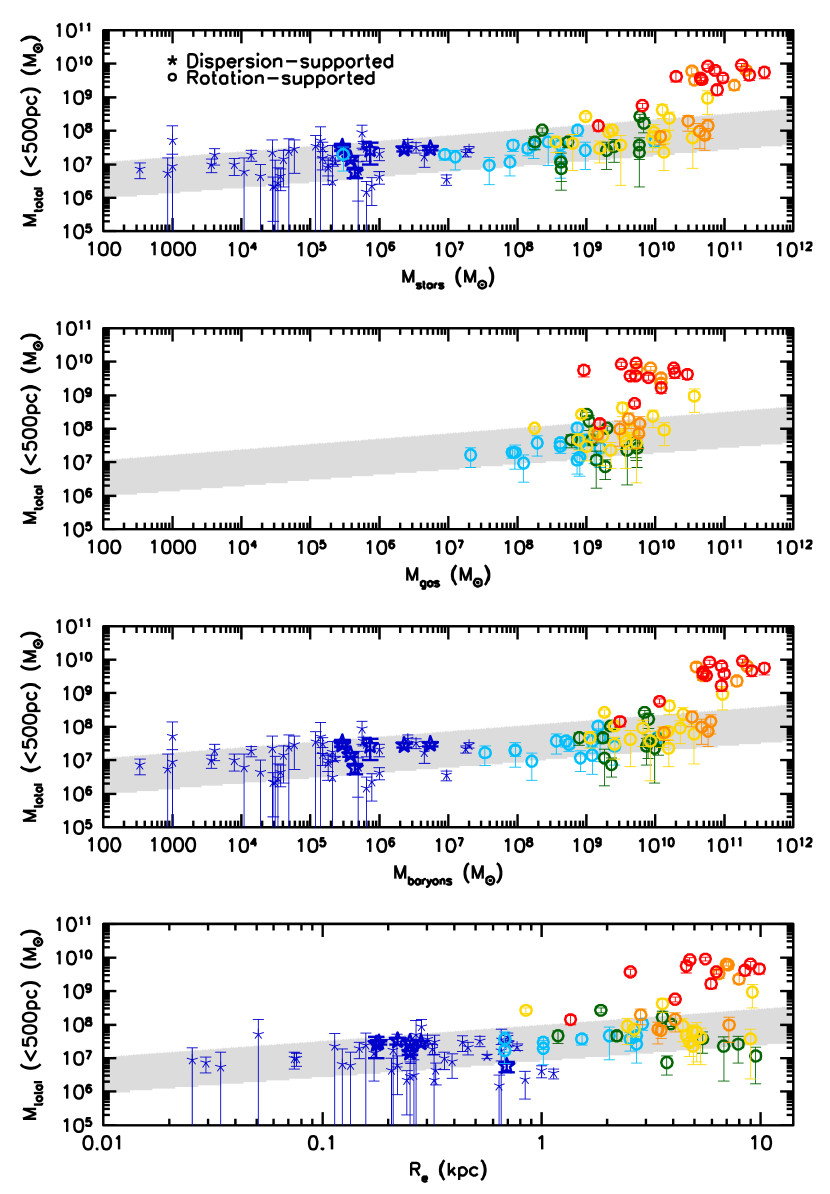
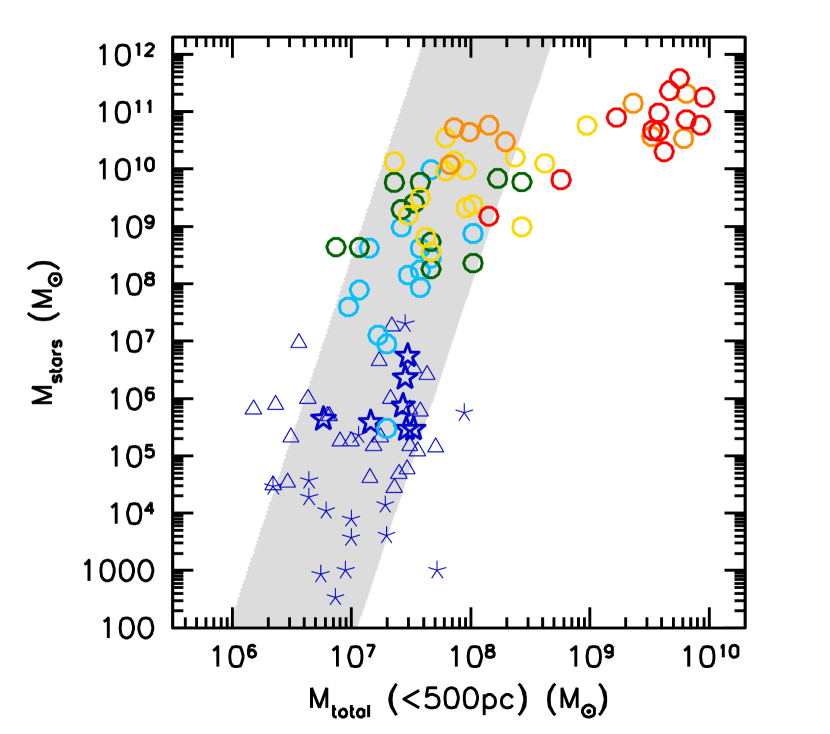
In Figure 1, we plot (500 pc) as a function of , , , and for the combined dSph and disk galaxy samples. We find that (500 pc) increases very slowly over many orders of magnitude in the other parameters, and that there is a smooth transition between dispersion-supported systems and rotation-supported systems. Specifically, over orders of magnitude in baryonic mass and in length, the total dynamical mass inside of 500 pc increases only 1.5 orders of magnitude for all but the most massive early-type (S0-Sa) disk galaxies. (500 pc) increases from a few 106 M⊙ for the lowest luminosity dSph galaxies to for Sb-Sc type disk galaxies in the sample (see also Figure 2).
The dynamical mass enclosed by 500 pc is remarkably similar for vastly different galaxies. Figure 1 shows that galaxies with different kinds of internal motions (pressure support vs. rotational support), different primary baryonic mass components (stellar mass vs. gas mass), different environments (satellite galaxies vs. isolated field galaxies), different physical sizes, etc., are generally rather similar. They are not identical as we do find a gradual trend for the inner dynamical mass to increase with total stellar mass: . There is some scatter about this relation, but the majority of galaxies fall within half a dex of this line.
The weak correlation defined by the majority of the assembled sample is violated by the most massive early-type (S0-Sa) disks. These have a significantly higher central concentration of mass (Fig. 2). This sets in around with a fairly narrow transition region where galaxies of this mass either lie on or above the relation. Indeed, the data give the visual impression of a gap between the most concentrated early-type galaxies and the rest of the sample. It is unclear whether this gap is real, or a chance consequence of the sample size. The sudden change in enclosed central mass of the earliest type galaxies in our sample is real.
The large central masses of early-type galaxies are probably dominated by stars. This is consistent with the findings of Noordermeer et al. (2007), from whom most of the early-type data originate. In detailed mass models of early-type systems, it is common to see an inner peak in the rotation curve due to the bulge and a subsequent peak farther out. The latter might be attributed to either disk or dark matter, but one dark matter halo cannot produce both peaks, requiring the inner peak to be dominated by the stellar bulge.
The apparent dichotomy in inner mass is suggestive of distinct bulge formation mechanisms between early- and late-type spirals. The mechanism in early-type spirals is evidently very efficient at packing lots of stars into a small radius. Perhaps these are classical bulges built by mergers, or cold flows are more efficient at delivering baryons to small radii in these massive galaxies (Dekel et al., 2009). Contrawise, the less dense central regions of late-type galaxies might grow by secular evolution of the disk.
Our results are robust against errors and changes in our assumptions. Uncertainties in for the dSphs or the calibration of the BTFR for the disks will change by a factor of a few at most. This translates to small shifts left or right in Figure 1 that are insignificant compared to the entire range of that is plotted, particularly given the shallow slope of (500 pc) with total stellar mass. Uncertainties in and will produce similarly negligible horizontal shifts in Figure 1.
The largest uncertainty is in the measurement of (500 pc). As discussed in Section 2, Equation 1 is a good substitute for full modeling when it is used to determine the enclosed mass of a dispersion-supported system at a radius close to the half-light radius. Comparing the fully-modeled masses of dSphs provided by Walker to the estimates obtained using Equation 1, we find that Equation 1 gives values that are typically 1.3 times larger than those determined from the full modeling. This would be a small vertical shift in Figure 1. Our correction factor, , compensates for this difference when (500 pc) is calculated for the remainder of the dSph sample. Those dSphs with half-light radii beyond the range of the Walker sample ( 180700 pc) are least certain. These are typically the lowest luminosity (lowest ) systems. Even if we exclude these galaxies, the remaining dSph sample continues the trend set by the disk galaxies, as highlighted by the gray band in the figures.
The uncertainty on (500 pc) for the disk galaxies is dependent on how well the rotation velocity at 500 pc can be measured. 500 pc is at the lower limit of the spatial resolution of most rotation curves and non-circular motions become more important at small radii. In addition, it becomes more difficult to constrain (500 pc) if the galaxy has a bulge since the rotation curve will rise very quickly. We are therefore forced to exclude galaxies whose rotation curves lack the rising portion at small radius. These are typically very massive galaxies with in excess of 300 km s-1. These systems would populate the very upper right corner of Figure 1.
Much like the constant mass within 300 pc in the Milky Way dSphs that was emphasized by Strigari et al. (2008), the total dynamical mass inside of 500 pc appears to be nearly constant in galaxies spanning an enormous range of total baryonic mass, type, and size. It is only in the earliest type disk galaxies with total stellar masses greater than 1010M⊙ that a significant amount of mass builds up in the inner 500 pc. In the next section, we explore whether recent galaxy simulations are successful in matching the inner regions of observed galaxies.
3.2. Enclosed Mass and Feedback in Simulations
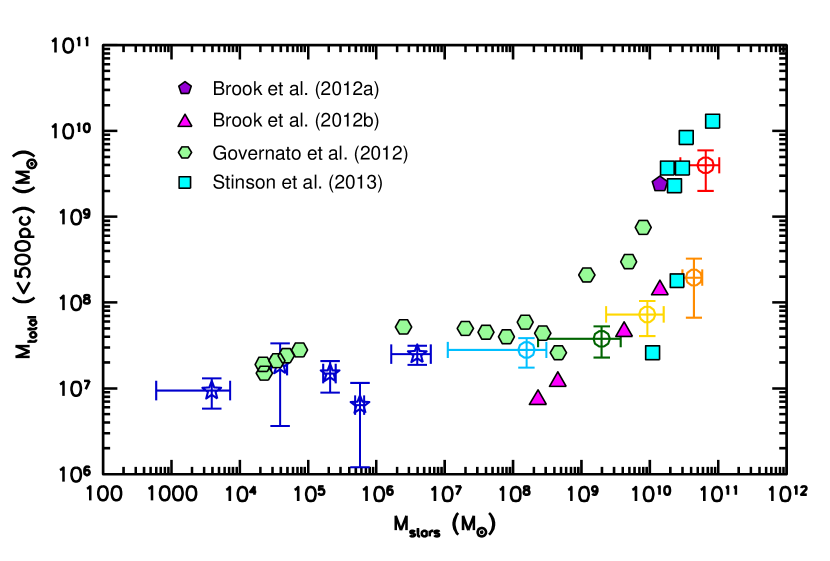
In Figure 3, we bin the observed galaxy data and plot the median stellar mass and median (500 pc) for each bin. The dSph galaxies are binned by stellar mass such that each bin contains 10 galaxies. The disk galaxies are binned in stellar mass by type and contain between 9 and 15 galaxies per bin. Around a few times 109 M⊙ in total stellar mass, a gradual upturn in the total dynamical mass inside of 500 pc begins to appear. This upturn is roughly where the baryons begin to dominate the inner mass (McGaugh et al., 2007; Walker et al., 2010).
We also plot in Figure 3 the total dynamical mass inside of 500 pc for recent galaxy simulations. These simulations employ feedback prescriptions to modify the inner mass distribution of the galaxy-halo system, prevent the formation of massive bulges, and produce flat rotation curves, exponential surface brightness profiles and dark matter cores. Specifically, we include the simulations of Brook et al. (2012a, b), the simulated galaxies presented in Governato et al. (2012), and the simulations of Stinson et al. (2013). We have chosen these simulations as a comparison sample because (500 pc) is measurable in the published rotation curves (or (500 pc) is tabulated) and is also provided. Not all recent simulations provide the necessary information to perform our test (e.g., Guedes et al., 2011; Hopkins et al., 2012; Agertz et al., 2013).
Though (500 pc) does not distinguish between luminous and dark mass, the binned galaxy observations do provide a robust measure of the total inner mass. (500 pc) can therefore be used to gauge how realistic and/or successful the simulations are in reproducing observed total mass distributions. If they are successful in this regard, one can then ask if they are also able to match the ratios and radial distributions of the different mass components. With this in mind, we now examine how the simulations compare to the observations in Figure 3.
The total mass inside of 500 pc in the simulations with 109 M⊙ are in the same range of the central masses of observed galaxies of similar total stellar mass, though typically on the high side. The feedback processes that are acting in these simulations are keeping the total inner dynamical masses consistent with observations. These simulations also seem to be making progress in matching the mass profile (cuspy vs. cored) of the dark matter halo (see figure 1 in Governato et al. 2012 and figure 6 in Brook et al. 2012b).
The simulations with 109 M⊙ show a similar upturn in (500 pc) as the observed galaxies. While the Governato et al. (2012) simulations in this range have significantly more total mass in their central 500 pc than the observed late-type Sd and Sc disk galaxies with comparable total stellar masses, the two most massive Brook et al. (2012b) simulations are in much better agreement with the observations. These are their SG3 and SG4 simulations; most of the merger activity and star formation takes place prior to = 2 in SG3 (the less massive galaxy of the two), while SG4 builds up its mass at a much later time after = 1.
The Brook et al. (2012a) simulation, identified as an SBc/d galaxy, has significantly more mass in its center than observed galaxies of similar type. This is not an uncommon result. Simulated disk galaxies often have very steep rotation curves, even when star formation, feedback and outflows are modeled (see, for example, Guedes et al., 2011; Piontek & Steinmetz, 2011). The decomposition of the Brook et al. (2012a) rotation curve into stellar and dark matter mass components shows that it is not just a build-up of baryonic mass, but also a substantial increase in dark matter mass that is responsible for the large total mass at the center: the simulated galaxy contains 3 108 M⊙ of dark matter and 2.1 109 M⊙ in stars in the inner 500 pc. It is likely that adiabatic contraction has played a role in creating such a dense center.
The two Stinson et al. (2013) simulations with low inner dynamical masses fall in the range of observed Sb and Sc galaxies. These simulations utilize high early stellar feedback and high diffusion to regulate/modify star formation. The five other Stinson et al. (2013) simulations have much higher inner dynamical masses, more similar to the bin of early-type S0-Sa galaxies. In general, these simulated galaxies have slightly lower total stellar masses than the observed early-type galaxies. Alternatively, if the morphology of the simulated galaxies is closer to Sb-Sc, the inner dynamical masses of the simulations are too high, much like the Brook et al. (2012a) simulation. The Stinson et al. (2013) simulations cover a narrow range in mass, so it is unclear how their feedback prescription would fare for low mass galaxies.
The baryonic feedback models that are being developed to address observational constraints are making headway towards matching observed galaxies. There is a tendency for the total inner dynamical masses of the simulations to be larger than those of observed galaxies of similar total stellar mass, with the details depending on the particulars of each simulation. So far, we have only been able to check the dynamical mass at a particular radius for those simulations that provide the necessary information. A much stronger test could be made if the radial distribution of baryonic surface density and gravitational force were provided for simulated galaxies (McGaugh, 2004).
4. Summary
We have shown that for a sample of dSph and early- and late-type disk galaxies, the total (baryons+dark matter) dynamical mass inside of 500 pc is nearly independent of the overall mass of the galaxy. There is a weak scaling, . Over 9 decades in baryonic mass and 3 in length, the central mass increases only 1.5 dex.
The earliest type (S0-Sa) disks are an exception to this weak scaling. Their central masses increase 1.5 dex rather suddenly for . We speculate that this might be the consequence of a distinct formation mechanism for their dense stellar bulges.
We have also compared the results of recent galaxy simulations to the data to investigate how well the simulations reproduce observed galaxy structure. The simulations display a slow increase in total inner dynamical mass with increasing total stellar mass that is similar to the trend seen in observed galaxies, though the degree of detailed agreement varies with individual models. Considerably stronger tests could be made if more information were provided by the models.
References
- Agertz et al. (2013) Agertz, O., Kravtsov, A. V., Leitner, S. N., & Gnedin, N. Y. 2013, ApJ, 770, 25
- Begum & Chengalur (2004) Begum, A. & Chengalur, J.N. 2004, A&A, 424, 509
- Brook et al. (2012a) Brook, C.B., Stinson, G., Gibson, B.K., Roskar, R., Wadsley, J., & Quinn, T. 2012a, MNRAS, 419, 771
- Brook et al. (2012b) Brook, C.B., Stinson, G., Gibson, B.K., Wadsley, J. & Quinn, T. 2012b, MNRAS, 424, 1275
- Collins et al. (2013) Collins, M.L.M., Chapman, S.C., Rich, R.M., et al. 2013, ApJ, 768, 172
- Conroy & van Dokkum (2012) Conroy, C. & van Dokkum, P.G. 2012, ApJ, 760, 71
- de Blok & Bosma (2002) de Blok, W.J.G. & Bosma, A. 2002, A&A, 385, 816
- de Blok et al. (2001) de Blok, W.J.G., McGaugh, S.S., & Rubin, V.C. 2001, AJ, 122, 2396
- de Blok et al. (2008) de Blok, W.J.G., Walter, F., Brinks, E., et al. 2008, AJ, 136, 2648
- de Zeeuw et al. (2002) de Zeeuw, P.T., Bureau, M., Emsellem, E., et al. 2002, MNRAS, 329, 513
- Dekel et al. (2009) Dekel, A., Birnboim, Y., Engel, G., et al. 2009, Nature, 457, 451
- Di Cintio et al. (2013) Di Cintio, A., Brook, C.B., Maccio, A.V., et al. 2013, MNRAS, submitted (arXiv:1306.0898)
- Governato et al. (2012) Governato, F., Zolotov, A., Pontzen, A., et al. 2012, MNRAS, 422, 1231
- Guedes et al. (2011) Guedes, J., Callegari, S., Madau, P., & Mayer, L. 2011, ApJ, 742, 76
- Hopkins et al. (2012) Hopkins, P. F., Kereš, D., Murray, N., Quataert, E., & Hernquist, L. 2012, MNRAS, 427, 968
- Kuzio de Naray et al. (2008) Kuzio de Naray, R., McGaugh, S.S., & de Blok, W.J.G. 2008, ApJ, 676, 920
- Martin et al. (2008) Martin, N.F., de Jong, J.T.A., & Rix, H.W. 2008, ApJ, 684, 1075
- McConnachie (2012) McConnachie, A.W. 2012, AJ, 144, 4
- McGaugh (2004) McGaugh, S. S. 2004, ApJ, 609, 652
- McGaugh (2012) McGaugh, S.S. 2012, AJ, 143, 40
- McGaugh et al. (2007) McGaugh, S.S., de Blok, W.J.G., Schombert, J.M., Kuzio de Naray, R., & Kim, J.H. 2007, ApJ, 659, 149
- Noordermeer et al. (2007) Noordermeer, E., van der Hulst, J.M., Sancisi, R., Swaters, R.S., & van Albada, T.S. 2007, MNRAS, 376, 1513
- Oh et al. (2011) Oh, S.-H., de Blok, W.J.G., Brinks, E., Walter, F., & Kennicutt, R.C. 2011, AJ, 141, 193
- Paturel et al. (2003) Paturel G., Petit C., Prugniel P., Theureau G., Rousseau J., Brouty M., Dubois P., Cambrésy L., 2003, A&A, 412, 45
- Piontek & Steinmetz (2011) Piontek, F. & Steinmetz, M. 2011, MNRAS, 410, 2625
- Portinari et al. (2004) Portinari, L., Sommer-Larsen, J., & Tantalo, R. 2004, MNRAS, 347, 691
- Sanders (1996) Sanders, R.H. 1996, ApJ, 473, 117
- Sofue et al. (1999) Sofue, Y., Tutui, Y., Honma, M., Tomita, A., Takamiya, T., Koda, J., & Takeda, Y. 1999, ApJ, 523, 136
- Stinson et al. (2013) Stinson, G.S., Brook, C., Maccio, A.V., Wadsley, J., Quinn, T.R., & Couchman, H.M.P. 2013, MNRAS, 428, 129
- Strigari et al. (2008) Strigari, L.E., Bullock, J.S., Kaplinghat, M., Simon, J.D., Geha, M., Willman, B., & Walker, M.G. 2008, Nature, 454, 1096
- Trachternach et al. (2009) Trachternach, C., de Blok, W.J.G., McGaugh, S.S., van der Hulst, J.M., & Dettmar, R.J. 2009, A&A, 505, 577
- Verheijen & Sancisi (2001) Verheijen, M.A.W., & Sancisi, R. 2001, A&A, 370, 765
- Vogelsberger et al. (2013) Vogelsberger, M., Genel, S., Sijacki, D., Torrey, P., Springel, V., & Hernquist, L. 2013, MNRAS, submitted (arXiv:1305.2913)
- Walker et al. (2007) Walker, M.G., Mateo, M., Olszewski, E.W., et al. 2007, ApJ, 667, L53
- Walker et al. (2009) Walker, M.G., Mateo, M., Olszewski, E.W., Penarrubia, J., Evans, N.W., & Gilmore, G. 2009, ApJ, 704, 1274
- Walker et al. (2010) Walker, M.G., McGaugh, S.S., Mateo, M., Olszewski, E.W., & Kuzio de Naray, R. 2010, ApJ, 717, L87