The Two-Dimensional Spatial Distributions of the Globular Clusters and Low-Mass X-ray Binaries of NGC4649.
Abstract
We report significant anisotropies in the projected two-dimensional (2D) spatial distributions of Globular Clusters (GCs) of the giant Virgo elliptical galaxy NGC4649 (M60). Similar features are found in the 2D distribution of low-mass X-ray binaries (LMXBs), both associated with GCs and in the stellar field. Deviations from azimuthal symmetry suggest an arc-like excess of GCs extending north at 4-15 kpc galactocentric radii in the eastern side of major axis of NGC4649. This feature is more prominent for red GCs, but still persists in the 2D distribution of blue GCs. High and low luminosity GCs also show some segregation along this arc, with high-luminosity GCs preferentially located in the southern end and low-luminosity GCs in the northern section of the arc. GC-LMXBs follow the anisotropy of red-GCs, where most of them reside; however, a significant overdensity of (high-luminosity) field LMXBs is present to the south of the GC arc. These results suggest that NGC4649 has experienced mergers and/or multiple accretions of less massive satellite galaxies during its evolution, of which the GCs in the arc may be the fossil remnant. We speculate that the observed anisotropy in the field LMXB spatial distribution indicates that these X-ray binaries may be the remnants of a star formation event connected with the merger, or maybe be ejected from the parent red GCs, if the bulk motion of these clusters is significantly affected by dynamical friction. We also detect a luminosity enhancement in the X-ray source population of the companion spiral galaxy NGC4647. We suggest that these may be younger high mass X-ray binaries formed as a result of the tidal interaction of this galaxy with NGC4649.
1. Introduction
Recent work is bringing forth a picture of complex and diverse Globular Cluster (GC) populations in elliptical galaxies, consistent with several merging episodes of which the different GC populations are the fossil remnant (Strader et al. 2011, for M87; Blom et al. 2012, for NGC4365). Our work on the elliptical galaxy NGC4261 has shown large-scale spiral-like features in the two-dimensional (2D) GC distribution (Bonfini et al., 2012; D’Abrusco et al., 2013), which would have been unreported in the study of radial distributions. This continuing merging evolution would be expected in the framework of simulations based on the CDM model of hierarchical galaxy formation (White & Rees, 1978; Di Matteo et al., 2005).
The CDM model of hierarchical galaxy formation (White & Rees, 1978) has been successful in reproducing several results of both deep and large sky surveys (e.g., Navarro et al. 1994, Di Matteo et al. 2005, Navarro et al. 2010). However, direct observational validation of continuous galaxy evolution via satellite merging from observations of galaxies in the local universe is only recently appearing in the literature, and has been mostly limited to the Milky Way and Local Group. Large-scale surveys of the stellar population of the Milky Way have shown an increasing complex dynamical environment of satellite dwarf galaxies interacting gravitationally with and being accreted by our galaxy (e.g. the Sloan Digital Sky Survey results of Belokurov et al. 2006). The Sagittarius Stream (Ibata et al., 1994) is a well-studied example of this phenomenon. A wide-area survey of the M31-M33 region confirms this picture, detecting streams and dwarf galaxies in the halo of M31 and in the region between M31 and M33 (McConnachie et al., 2009).
Although these subtle details may not be perceivable beyond our Local Group, GCs may provide a marker of these interactions in farther away systems. Observationally, for example, the Sagittarius dwarf/stream is associated with several GCs (e.g., Salinas et al. 2012, Forbes & Bridges 2010). Although the parent dwarf galaxy may be disrupted, and therefore hard to be detected against the background of the more luminous dominant galaxy, GC may retain the information of the encounter. This is suggested by simulations - albeit limited to the tidal evolution of GCs in dwarf spheroidal dark matter halos - which show that GCs with combined high mass and high density will survive the encounter (Peñarrubia et al., 2009).
The giant elliptical galaxy NGC4649 (M60) in the Virgo cluster was recently surveyed with several Chandra and HST exposures, completely covering the area within the D25 ellipse (de Vaucouleurs et al., 1991) and extending with variable coverage to larger radii. The resulting catalogs of GCs (Strader et al., 2012) and Low Mass X-ray Binaries (LMXBs) (Luo et al., 2013) give us a unique opportunity to study the properties of these populations and to explore further the GC-LMXB connection (see review, Fabbiano, 2006), with full spatial coverage. NGC4649 is a relatively isolated galaxy, except for the close neighbor spiral NGC4647, with which NGC4649 may be tidally interacting (Lanz et al., 2013).
In the first follow-up paper based on these Chandra and HST data (Mineo et al., 2013), we studied the radial distributions of the GCs and LMXBs populations and compared them with that of the optical surface brightness, which is a good proxy of the stellar mass for the old stellar population of NGC4649. The radial distributions of red and blue GCs differ, as generally observed in other galaxies (see review, Brodie & Strader, 2006; Strader et al., 2012). The blue GC radial profile is definitely wider than that of the stellar light. The red GCs profile is steeper, close to that of the stellar light, with a noticeable “dip” in the denser centermost region (r 3 kpc at the NGC4649 distance of 16.5 Mpc (Blakeslee et al., 2009)), where tidal disruption of GCs may be more efficient. The LMXBs associated with GCs follow the same radial distributions as their parent GC populations. Roughly three times more of these LMXBs are found in red rather than in blue GCs, as generally observed in early-type galaxies (Kundu et al. 2002; Kim et al. 2009; Mineo et al. 2013; see Ivanova et al. (2012) for a theoretical explanation). The field LMXBs - those without a GC counterpart - follow the stellar light, i.e., the mass distribution of old stars, within the ellipse (Kim & Fabbiano, 2004; Gilfanov, 2004). Mineo et al. (2013) also report a departure of the LMXB radial distribution from that of the stellar mass at larger galactocentric radii, which could also be associated with more luminous sources. As discussed there, this over-luminosity may point to a younger field LMXB population: evolutionary models of native field LMXB populations have shown that LMXBs become fainter with the increasing age of the parent stellar population (Fragos et al., 2013a, b).
Here we complete our study of the spatial distribution of the GC populations in NGC4649, by examining their 2D observed distributions, to explore the presence of irregularities that may point to mergers or satellite accretion by NGC4649. Given the association and possible evolutionary relation between GCs and LMXBs (see Fabbiano, 2006, and refs. therein), we also extend this study to the LMXB population of NGC4649. In particular we seek to explore if the regularity observed in the radial distributions of these sources still persists in the azimuthal dimension.
In Section 2 we describe the catalogs of GCs and LMXBs used in this paper. These data were analyzed with the method described in D’Abrusco et al. (2013). This method is based on the K-Nearest Neighbor (KNN) density estimator (Dressler, 1980), augmented by Monte Carlo simulations, to estimate the statistical significance of any spatial feature (Section 3). The results are presented in Section 4 and discussed in Section 5. We summarize our finding in Section 6. In this paper we adopt a distance of 16.5 Mpc to NGC4649 (Blakeslee et al., 2009). At this distance, an angular separation of 1′ corresponds to a linear distance of 4.8 kpc.
2. Data: GCs and LMXBs
The GC and LMXB samples used in this work are the results of the joint Chandra-HST large-area mapping of NGC4649 (PI Fabbiano111Public Chandra data can be retrieved through the CXC, at the following URL: http://cxc.harvard.edu/. HST public data can be searched and retrieved using the MAST archive, available at the URL: http://archive.stsci.edu/.). The GC sample is based on the GC catalog extracted by Strader et al. (2012) from six HST ACS pointings of NGC4649. It contains 1603 GCs with photometry in and filters, selected by requiring and and discarding all sources with size consistent with the PSF (presumed to be foreground stars). This catalog includes 841 red GCs with , and 762 blue GCs with . The color threshold was derived from Strader et al. (2012) after verifying that significant color substructures are visible in the whole interval of galactocentric distances explored by the catalog of GCs. While the shapes and positions of the red and blue features in the color distribution of GCs (see Figure 6 in Strader et al. (2012)) show a slight dependence on the galactocentric distance within NGC4649, the value allows a clear separation of the two GCs color classes over the whole range of distances. For our analysis we have also considered a split of the sample in luminosity, resulting in 467 high-luminosity GCs with , and 1136 low-luminosity GCs with . As discussed later in Section 3, small variations of both color and luminosity boundaries do not alter the results of our analysis. In this particular case, the magnitude threshold used to define low- and high-luminosity GCs was chosen only to provide luminosity classes of similar sizes (see Table 1).
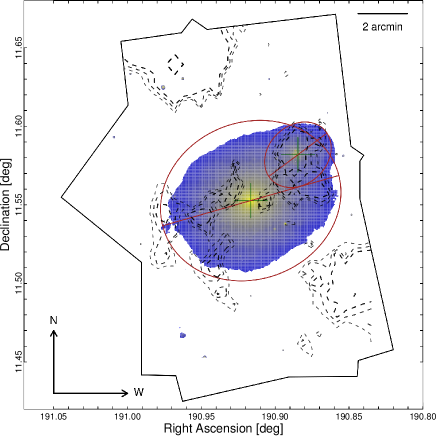
Figure 1 (left) shows the spatial distributions of the GCs in the plane of the sky. The HST pointings overlap marginally with the elliptical isophote of the neighboring spiral galaxy NGC4647. We have excluded all the GCs within the NGC4647 ellipse from the sample used to evaluate the observed density profile of GCs in NGC4649 (see Section 3), but we have kept them in the density maps.
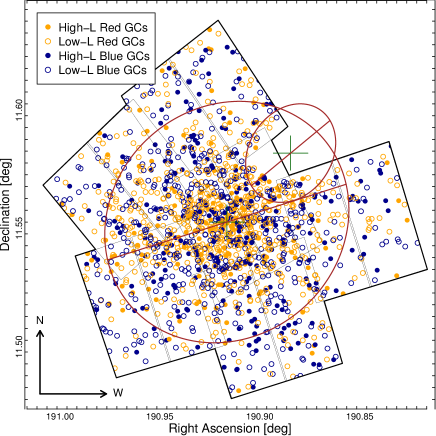
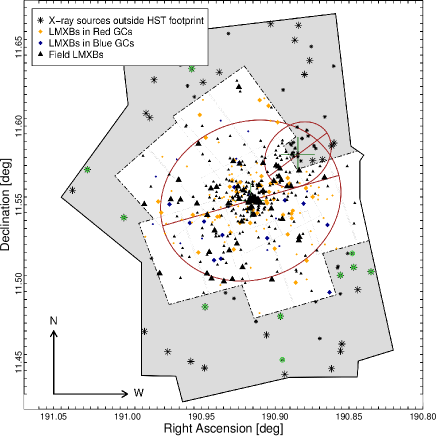
The LMXB sample is from the catalog of Luo et al. (2013), where identifications with GCs are based on Strader et al. (2012). This catalog was derived from six Chandra ACIS-S3 pointings of NGC4649, reaching a total exposure of 299 ks and yielding a total of 501 X-ray sources with 0.3-8.0 keV luminosities ranging from to ergs s-1. Out of the total 427 LMXBs within the HST combined footprint, 161 are GC-LMXBs and 266 are found in the stellar field of NGC4649 (field LMXBs). Moreover, 74 LMXBs were detected in the region external to the HST footprint (see Mineo et al. 2013). Of the X-ray sources detected in the area not overlapped by the HST observations used to extract the catalog of GCs used in this paper, twelve of them can be identified with GCs in the ground-based catalog of Lee et al. (2008); the other X-ray sources in this area are likely to be mostly background Active Galactic Nuclei (AGNs), based on the contamination estimates of Luo et al. (2013). To avoid the large uncertainties on the sample of X-ray sources detected at larger radii, in this paper we will derive the density reconstruction of only the GCs and field LMXBs located within the HST footprint. Only background AGNs are expected within the elliptical isophote of NGC4649; these are likely to contaminate the field LMXB sample, because the GC identification excludes this contamination in the sample of GC-LMXBs. We have also explored luminosity classes based on a threshold of erg s-1 for the LMXBs. The two luminosity classes comprise 339 and 162 sources respectively. The higher luminosity class may contain a larger proportion of black hole binaries or of younger LMXBs (Fragos et al. 2013a; Tzanavaris et al. 2013). The spatial distribution of the LMXBs is shown in Figure 1 (right). The number of members of each class of sources investigated in this paper is reported in Table 1.
| GCs222 In square brackets, the number of low-luminosity and high-luminosity GCs for red and blue classes, respectively. | 1603 | 841[642/198] | 762[493/269] | 467 | 1136 |
| LMXBs333In square brackets, the number of LMXBs associated to blue and red GCs, respectively. In parenthesis, the number of X-ray sources located outside the HST footprint. | 501 | 161[28/133] | 266(74) | 162 | 339 |
3. Method
We determined the 2D spatial distributions of GCs and LMXBs by applying a method based on the KNN density estimator (Dressler, 1980). We used simulations to evaluate the significance of the results. A detailed explanation of our application of the KNN method can be found in D’Abrusco et al. (2013).
The assumption behind the KNN method is that the density is locally constant. The uncertainty on the KNN density scales with the square root of , where is the index of the nearest neighbor used to calculate the density and the fractional accuracy of the method increases with increasing K at the expense of the spatial resolution. For each sample discussed in this paper, we calculated the 2D surface densities for ranging from 2 to 9, and a regular grid with spacing () and () for the GCs, and () and () for the LMXBs. These grids define 2D cells of “pixels”. This choice of grids is justified by the different areas covered by the HST and Chandra observations and produces similar average number of source per pixel for both GCs and LMXBs. This choice permits to compare meaningfully the statistical reliability of the features determined in density and residual maps for both classes of sources. The density in the boundary pixels was weighted according to the fraction of the pixel within the observed region.
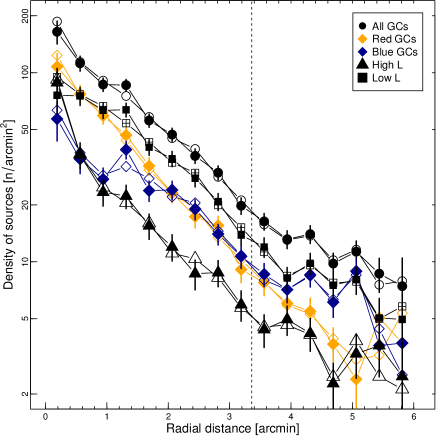
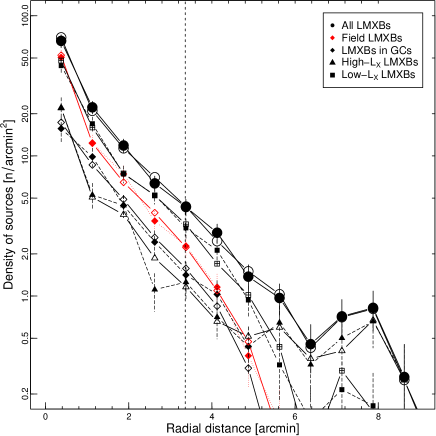
To assess the statistical significance of features suggested by the KNN density maps (hereafter “observed” density maps), we employed Monte-Carlo simulations, using the observed radial distributions of each of the classes of GCs and LMXBs investigated, as seeds. The azimuthal distributions were independently extracted from a uniformly random distribution between 0∘ and . A geometrical correction on the expected number of GCs per elliptical annulus was applied to take into account the eccentricity of the galaxy. We performed simulations for each of the samples described in Table 1, and analyzed the results as done with the observed data (see above). Figure 2 compares observed and simulated mean radial density profiles for the GC and LMXB samples, respectively.
To characterize the deviations from the average 2D trends of the GC and LMXB distributions, we calculated maps of residuals by subtracting pixel-by-pixel the mean simulated density map from the corresponding observed density map, and normalizing to the value of the density in the average simulated map.
The pixel-by-pixel distributions of the simulated KNN densities are well approximated by Gaussians, simplifying the calculation of the statistical significance of the residuals. To evaluate the latter, for each set of simulated density maps we calculated the fraction of pixels with values above the 90-th percentile of the densities in the observed maps (the “extreme” pixels). Since these extreme pixels in both observed density and residual maps tend to be spatially correlated, we also evaluated the fraction of simulations with at least one group of contiguous extreme pixels (with area equal to 18 pixels) as large as the observed. Since we did not impose any specific geometry to the groups of simulated contiguous extreme pixels, these fractions are upper limits to the fraction expected for a given spatial distribution of residuals. The results are given in Section 4.
As discussed above, the radial distributions of the simulated distributions of sources follow the observed radial distributions, while the azimuthal distribution is uniform in the interval. If the incompleteness of the observed distribution of sources is a function only of the radial distance from the center without azimuthal dependencies, it will affect in the same way both observed and simulated density maps. Accordingly, in this paper we have not included completeness corrections for either GC and LMXB samples because both populations are affected by incompleteness which only depends on the radial dependence from the center of the NGC4649 galaxy (see Mineo et al. 2013; Luo et al. 2013 for GCs and LMXBs incompleteness maps respectively).
| Density | ||||||
|---|---|---|---|---|---|---|
| All GCs (redblue) | 99.5%(1.8%) | 49.5%(1.2%) | 6%(0.3%) | 0%(0%) | 0%(0%) | 0%(0%) |
| Red GCs | 96%(3.1%) | 25.9%(2.5%) | 2.3%(1.4%) | 0%(0.3%) | 0%(0%) | 0%(0%) |
| Blue GCs | 100%(4.7%) | 60.5%(1.2%) | 4%(0%) | 1.2%(0%) | 0%(0%) | 0%(0%) |
| High-L GCs | 100%(3.4%) | 74%(0.9%) | 15%(0.2%) | 2.8%(0%) | 0%(0%) | 0%(0%) |
| Low-L GCs | 99.5%(1.3%) | 49%(0.3%) | 5.7%(0%) | 0%(0%) | 0%(0%) | 0%(0%) |
| All LMXBs | 97%(73%) | 86%(56.4%) | 68%(34.8%) | 45.5%(12.9%) | 33.5%(8%) | 21.5%(0.5%) |
| GC-LMXBs | 85.5%(54.6%) | 64.5%(33.1%) | 45.5%(12.2%) | 33.5%(3.5%) | 25.5%(1.4%) | 20.5%(0.3%) |
| Field LMXBs | 85%(34%) | 64%(28.8%) | 52%(17.5%) | 43%(11.8%) | 12%(5.4%) | 20%(0%) |
| High-L LMXBs | 99.5%(87.4%) | 94%(76.9%) | 88%(65.3%) | 71%(43.9%) | 60%(19.3%) | 53.5%(0.8%) |
| Low-L LMXBs | 61%(17.9%) | 28%(12.8%) | 15.5%(3.7%) | 7.5%(0.5%) | 4%(0%) | 3%(0%) |
| Residuals | ||||||
| All GCs (redblue) | 65.2%(10.5%) | 8.2%(4.8%) | 1.1%(0.7%) | 0%(0%) | 0%(0%) | 0%(0%) |
| Red GCs | 54.8%(8.9%) | 4.2%(1.1%) | 0.8%(0.5%) | 0%(0.1%) | 0%(0%) | 0%(0%) |
| Blue GCs | 71.8%(0.2%) | 9.1%(0%) | 1.7%(0%) | 0%(0.4%) | 0%(0%) | 0%(0%) |
| High-L GCs | 89.5%(12.2%) | 16%(1.9%) | 4.5%(0.6%) | 0.5%(0%) | 0%(0%) | 0%(0%) |
| Low-L GCs | 88.6%(7.2%) | 5.2%(5.4%) | 0%(1.1%) | 0%(0.4%) | 0%(0%) | 0%(0%) |
| All LMXBs | 78.2%(10.5%) | 51.7%(4.8%) | 22.1%(2.7%) | 13.5%(0%) | 2.3%(0%) | 0%(0%) |
| GC-LMXBs | 64%(8.9%) | 41.7%(3.1%) | 30.4%(1.5%) | 14.2%(0%) | 2.5%(0%) | 0.1%(0%) |
| Field LMXBs | 81%(12.2%) | 59.4%(9.3%) | 43.9%(4.7%) | 28.7%(2.4%) | 6.4%(1.3%) | 0.5%(0%) |
| High-L LMXBs | 85.9%(17.2%) | 78.4%(12.9%) | 52.1%(9.6%) | 34.7%(6.5%) | 21%(5%) | 9.7%(0.8%) |
| Low-L LMXBs | 57.4%(7.2%) | 43.8%(5.4%) | 28.5%(3.2%) | 13.9%(1.6%) | 3.2%(0%) | 0.1%(0%) |
4. Results of the KNN analysis
For each GC and LMXB sample, Table 2 summarizes the percentages of simulated maps with a number of extreme pixels exceeding that in the observed density and residual maps for values of ranging from 4 to 9. Given the size of the samples of GCs and LMXBs used in this paper, larger values of , while enhancing possible low-contrast large-scale features, would degrade the spatial resolution of the density and residual maps. The fraction of extreme pixels in the simulated density and residual maps decreases for increasingly larger values: for GCs, it is zero for ; for LMXBs, very small and zero values are obtained for in the case of residual maps, while significantly positive values occur even for for the density maps. However, once the spatial clustering of the extreme pixels is taken into account, the LMXBs density maps have negligible fractions of extreme simulated pixels when , making the asymmetries at these scales unlikely to be the results of random statistical fluctuations. In the following we will show and discuss the results obtained for for all GCs classes and for LMXBs. Table 3 gives the number of sources of each class located within pixels associated to over-density with significance greater than 1, 2, and 3 for the GC () and LMXB () samples. In Table 3, the fraction of sources located in the , and over-density pixels of the map and the number of sources in excess to the expected number (based on the radial profiles shown in Figure 2) are shown in parentheses and square brackets, respectively.
4.1. Density and Residual maps of GCs
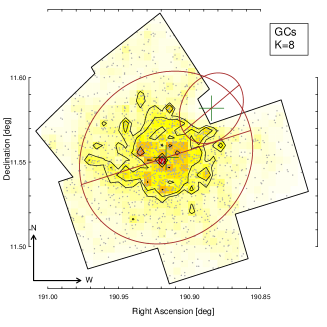
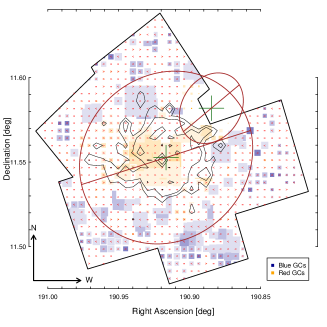
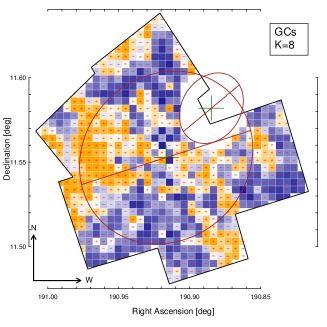
Figure 3 (left) shows the 2D KNN density map of the spatial distribution of the entire GC sample for . GCs are concentrated in the center of the galaxy, with an over-density elongated along the major axis of NGC4649. Figure 3 (center) shows the same density map where pixels are color-coded according to the average color of the GCs located in each pixel. As expected, high-density pixels, which tend to be more centrally located, contain on average redder GCs.
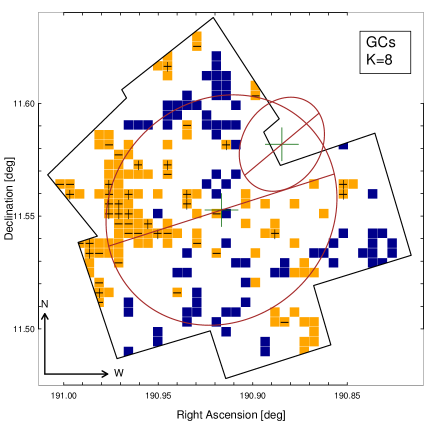
A slight excess () of red GCs is found in the over-density structure observed in the N-E quadrant of the galaxy and along the East section of the major axis. Figure 3 (right) shows the residual map, which emphasizes over-densities along the major axis, extending into the N-E quadrant. For , the number of all GCs located within the pixels associated to positive residuals is 438 (), 208 () and 127 () for 1, 2 and 3 significance respectively (Table 3). Figure 4 shows that the majority of the pixels associated to positive residual values with significance larger than 2 and 3 are located in the E and to the N-E of the main axis of NGC4649.
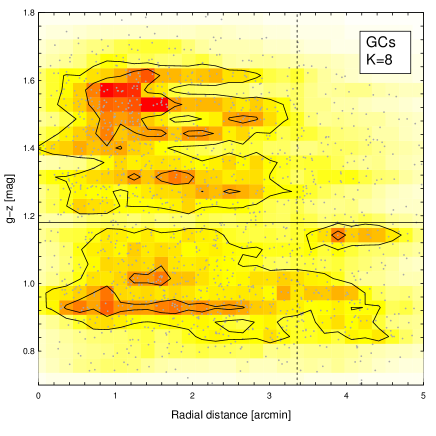
Figure 5 shows the density map in the radial distance vs plane. The bi-modality of the distribution of GCs in color is clear for which corresponds to the major axis of the isophote, in agreement with the finding of Strader et al. (2012). For the red, metal-rich GCs become less numerous, confirming that the average color in pixels outside the is significantly bluer than inner regions of the galaxy (see Figure 3, center).
| All GCs444Maps obtained for . | 438()[190] | 208()[109] | 127()[82] |
|---|---|---|---|
| Red GCs | 388()[258] | 184()[135] | 111()[82] |
| Blue GCs | 388()[266] | 161()[117] | 74()[57] |
| High-L GCs | 307()[240] | 109()[87] | 45()[37] |
| Low-L GCs | 430()[243] | 180()[111] | 82()[55] |
| All LMXBs555Maps obtained for . | 153()[74] | 72()[40] | 47()[31] |
| GC LMXBs | 60()[30] | 43()[25] | 31()[20] |
| Field LMXBs | 83()[38] | 39()[20] | 19()[12] |
| High-L LMXBs | 49()[19] | 22()[11] | 10()[5] |
| Low-L LMXBs | 120()[57] | 63()[37] | 41()[29] |
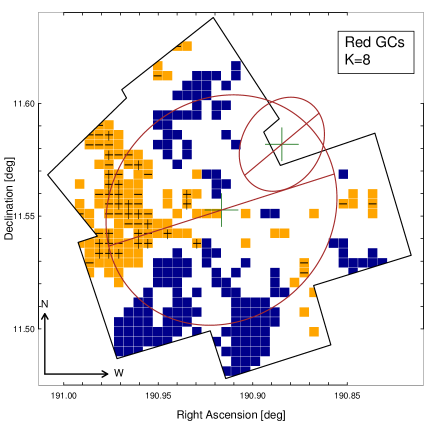
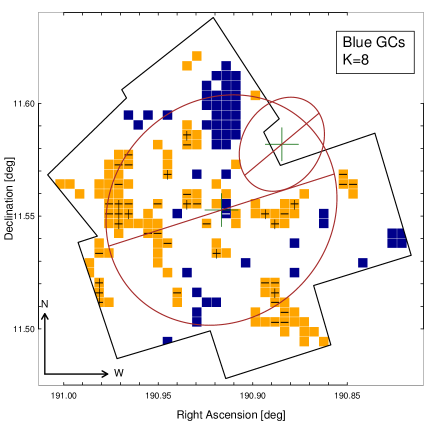
The density maps of red and blue GC subsamples do not show significant differences in the location of the main over-densities (upper panels in Figure 6), except for red GCs being more centrally concentrated (see also Figure 3, center). The residuals map derived from the red GCs distribution (lower left panel in Figure 6) highlights a large contiguous region of positive residuals in the N-E quadrant, with two smaller regions of positive residuals located in the S-W quadrant. The residual map of blue GCs (lower right panel in Figure 6) displays a more scattered distribution of positive residuals: a marginal enhancement corresponds to the region occupied by the large N-W positive residual structure seen in the red GCs map, but small significant clusters of positive residual pixels are located also in other regions.
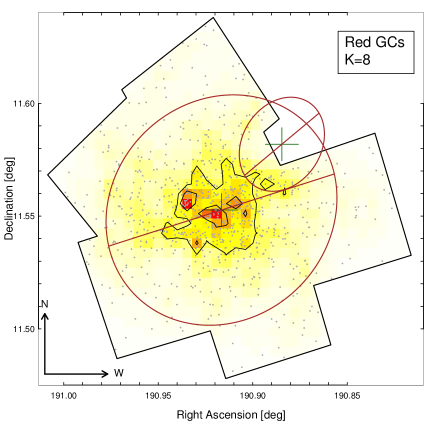
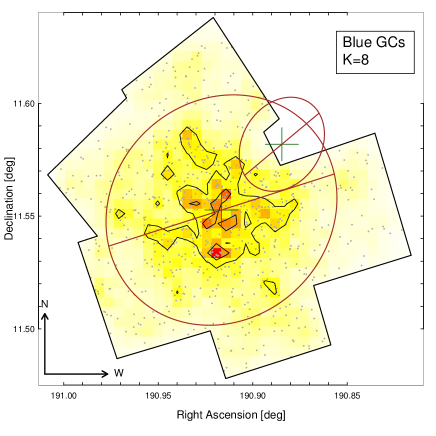
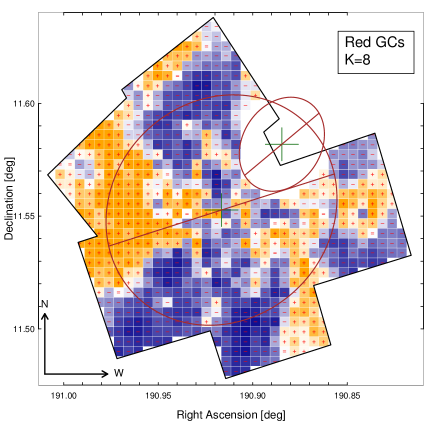
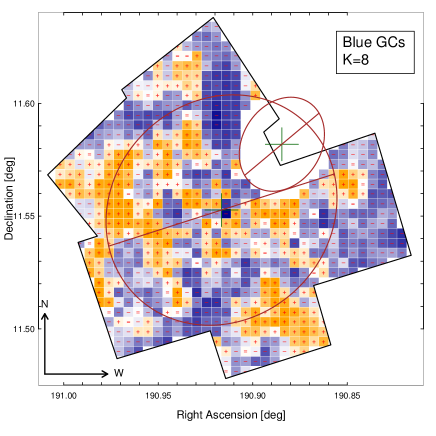
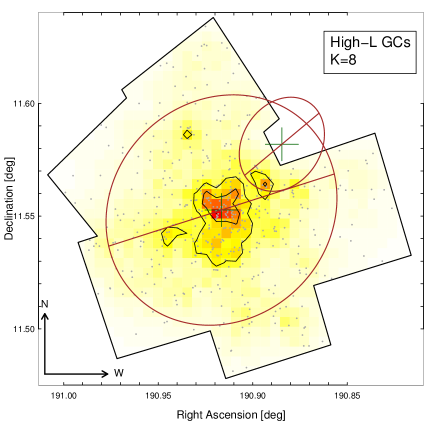
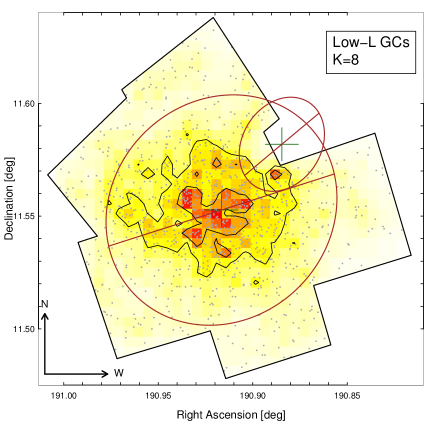
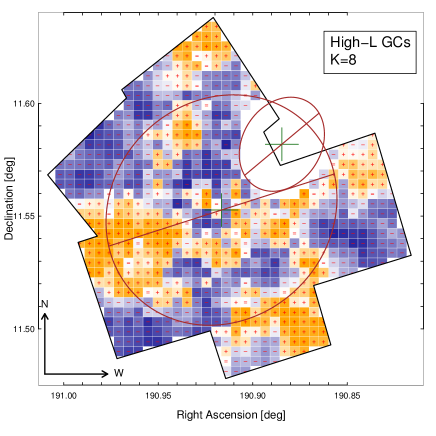
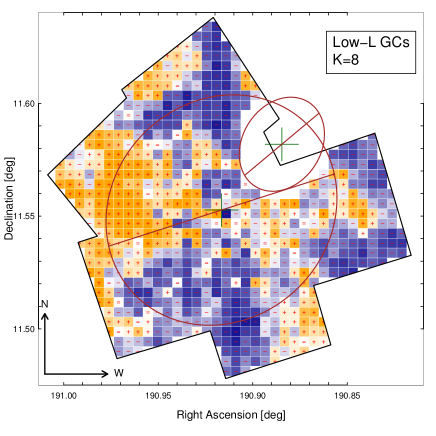
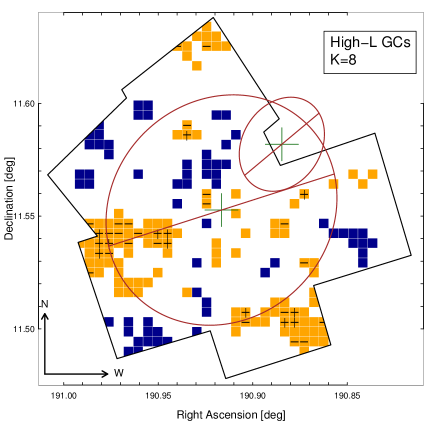
Figure 7 gives the corresponding results for the high and low luminosity GCs subsamples. The density distributions indicate that both luminosity classes peak in the center of the galaxy, with high-L GCs more centrally concentrated than low-L ones. The residual maps (lower panels in Figure 7) emphasize the differences between the two classes. The high-L GCs residual distribution is characterized by a significant cluster of spatially correlated pixels located along the E section of the major axis of the galaxy. Two other smaller structures are visible in the S-W quadrant within and outside of the isophote respectively. The residual map of the low-L GCs differs significantly from the high-L map in the E side: a large group of nearby pixels with highly significant positive residuals is located almost entirely in the N-E quadrant. This structures occupies a region devoid of positive high-L pixels and overlaps only partially with the high-L main over-density structure aligned along the major galaxy axis in the E direction.
Following D’Abrusco et al. (2013), we have verified that the differences between the spatial distributions of Red and Blue GCs, and high-L and low-L GCs are not the results of a particular choice of the thresholds values by reconstructing the density and residual maps of the two classes for several values of the thresholds, and checking that the qualitative results do not change. For the color classes, we have used ten regularly spaced threshold values around the threshold value in the interval . The results are consistent throughout this range of colors. For values outside this interval, the significance of the residual map for one of the two classes degrades rapidly because of the small number of GCs in that class. The same qualitative conclusions discussed above for the characterization of the spatial distributions of low and high luminosity classes of GCs in NGC4649 hold true using ten regularly spaced values of the magnitude threshold within the interval . Other values of the magnitude threshold have not been used since they would generate luminosity classes too unbalanced to correctly estimate the significance of the results.
4.2. Density and residual maps of LMXBs
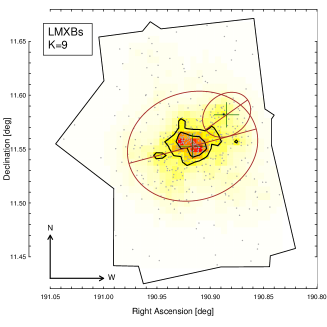
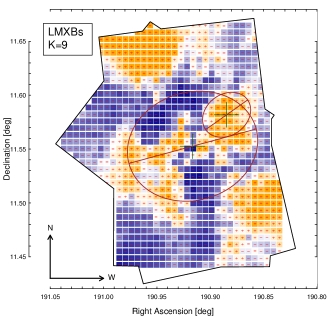
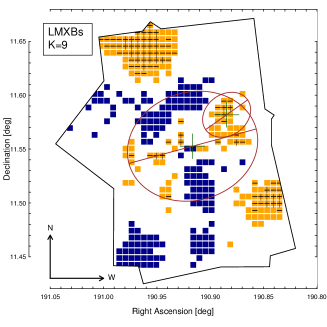
The distribution of LMXBs is centrally concentrated (Figure 8, left), except for an over-density located within the elliptical isophote of the companion spiral galaxy NGC4647 and a less significant enhancement in the S-E quadrant within the NGC4649 isophote. The residual map enhances these over-densities (Figure 8, center, right). A significant association of positive residuals pixels can be seen along the major axis of NGC4649. Two other significant regions composed of multiple spatially clustered positive residual pixels are visible in the N-E and S-W corners of the footprint of the Chandra observations. Although the footprint of the Strader et al. (2012) does not include the regions of the Chandra field occupied by these two structures, three X-ray sources in the N-E over-density and four in the S-W density enhancement have been associated by Luo et al. (2013) to GCs from the catalog of Lee et al. (2008). The remaining X-ray sources in the two structures do not have an optical counterpart that could be identified by our cross-correlation with the Nasa Extragalactic Database666http://ned.ipac.caltech.edu/ (NED), Simbad Astronomical Database777http://simbad.u-strasbg.fr/simbad/, Sloan Digital Sky Survey888http://www.sdss3.org/dr10/ (SDSS) DR10, Two Micron All Sky Survey999http://www.ipac.caltech.edu/2mass/ (2MASS) and Wide-Field Infrared Survey Explorer101010http://wise2.ipac.caltech.edu/docs/release/allwise/ (WISE) ALLWise archives. Nine Ultra-Luminous X-ray sources (ULXs) with ergs s-1 were identified by Luo et al. (2013), but they are not located within the boundaries of the N-E and S-W structures. The presence of LMXBs associated to GCs (Lee et al., 2008) suggests that these two over-densities could be the remnants of past interactions between NGC4649 and small accreted satellite galaxies. However, considering the background AGN density calculated in Luo et al. (2013), we cannot rule out contribution from background AGNs.
Differences are found in the distribution of residuals for field vs GCs-LMXBs and low and high X-ray luminosities LMXBs. These will be discussed in Section 5.
4.3. Comparison with the distribution of diffuse stellar light
We have searched for structures in the distribution of the diffuse stellar light of NGC4649 observed in the HST data used by Strader et al. (2012) that could be spatially overlapping with the over-density structures observed in the spatial distribution of GCs. We have fitted and subtracted elliptical isophotal models to the images of NGC4649 galaxy in both and filters, without finding significant residuals that may be indication of merging (cp. with the results discussed by Tal et al. (2009); Janowiecki et al. (2010)). Also, we searched for locally enhanced stellar formation in the color map of NGC4649 obtained by combining the HST g and z, using the method based on the distribution of the pixels images in the color-magnitude (CM) diagram (see de Grijs & Robertson, 2006). We do not observe significant differences in the distribution of pixels in the CM diagram derived for different azimuthal regions of the galaxy containing the GC over-density structures. The only feature in the pixel CM diagram is the “blue” cloud of pixels in the region of NGC4649 overlapping with NGC4647, already observed by (de Grijs & Robertson, 2006)). While our results do not suggest the existence of significant deviations from a smooth model of the diffuse light and color distributions in NGC4649, more detailed analysis will be necessary to confirm the lack of faint structures in the diffuse light 2D model of this galaxy.
In Figure 9 we plot the isodensity contours of the over-density structures observed in the spatial distribution of LMXBs in NGC4649 over the stellar mass map from (Mineo et al., 2013). This stellar mass map is smooth, with a steep positive gradient towards the core of NGC4649. The only significant enhancement is associated to the central region of the companion galaxy NGC4647, where some granularity, possibly due to the spiral arms, is visible (see Figure 10 in (Mineo et al., 2013)). The position of the positive residual structures on the E side of NGC4649 does not correlate with any feature in the stellar mass map, while on the W side the LMXBs over-density contours clearly follows the stellar mass density enhancement associated to the spiral galaxy NGC4647. The different spatial resolutions of the residual maps of the distribution of LMXBs in NGC4649 and of the stellar mass density map do not permit a direct comparison of the shape of the LMXBs over-density contours to the position of the granularities of the map though.
5. Discussion
Our analysis of the two-dimensional projected distribution of the GC and LMXB populations of the giant Virgo elliptical NGC4649 (M60) confirms a well-known feature of this GC system, that red GCs are more centrally concentrated than blue GCs, as usually observed in elliptical galaxies (e.g., Brodie & Strader 2006; see also Mineo et al. 2013 for NGC4649), but also finds unexpected significant and complex 2D asymmetries in their projected distributions.
5.1. The GC population of NGC4649
NGC4649 is the third most luminous galaxy in the Virgo Cluster, and resides in a galaxy-dense environment, where gravitational interactions and accretion of satellites may be frequent. Kinematics evidence, suggesting a merging and accretion past for this galaxy, was recently found in studies of Planetary Nebulae (PN) and GCs (Teodorescu et al., 2011; Das et al., 2011; Coccato et al., 2013). In particular, Das et al. (2011) show that at galactocentric radii larger than 12 kpc, PNs and GCs may belong to separate dynamical systems. A similar conclusion was reached by Coccato et al. (2013), who propose either tidal stripping of GCs for less massive companion galaxies, or a combination of multiple mergers and dwarf galaxy accretion events to explain the observed kinematics. Besides experiencing continuing evolution at the outer radii via interaction with and accretion of companions, NGC4649 itself may be the result of a major dry merger. This is suggested by recent kinematical measurements of the diffuse stellar light that revealed disk-like outer rotation, as it may have stemmed from a massive lenticular galaxy progenitor (Arnold et al., 2013).
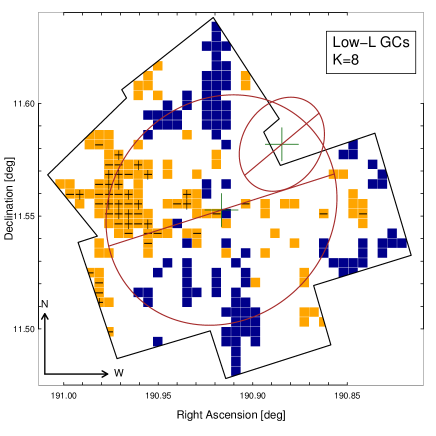
The anisotropies we find in the 2D distribution of GCs may be a different pointer to this complex evolution. We have found that in NGC4649, the 2D distribution of GCs shows strong positive residuals along the eastern major axis of the galaxy, with a northward arc-like curvature beginning at a galacto-centric radius of kpc and extending out to kpc. This large-scale feature is more prominent in the distribution of red GCs, but can still be seen in the 2D distribution of blue GCs, which is overall noisier. High-luminosity GCs tend to concentrate at the southern end of this feature, while low-luminosity GCs are found in the northern portion. These trends and differences are highlighted in Figure 10, which displays the most significant single pixels () of each residual distribution. The extreme pixel distributions of red GCs (upper left) and low-luminosity GCs (lower right) are similar, and differ from those of high-L GCs. The reason for this similarity resides in the choice of the particular magnitude threshold used to define luminosity classes (see discussion in Section 2 and Table 1). With the threshold, red and blue GCs comprise and of low-L GCs, respectively. Using as a threshold instead, the residual maps of low-L and high-L GCs are more similar, although high-L and low-L still are spatially segregated in the N side of the “arc”. However, this magnitude threshold yields 140 high-L GCs and 1463 low-L GCs.
The color and luminosity differences suggest that we may not simply be witnessing the disruption of a satellite dwarf galaxy, and observing the stream of its GC system. Perhaps some additional GC formation resulted from this merger, increasing the population of red, high-metallicity GCs. GC formation during galaxy merging has been suggested as an important mechanism for the assembly of GC systems, especially in the case of large elliptical galaxies (Ashman & Zepf, 1992), and is supported by high-resolution simulations of galaxy mergers (Bournaud et al., 2008). Numerous young massive stellar clusters, which may evolve into GCs, are for example seen in the advanced merger remnant NGC7252 (Bastian et al., 2013). This picture is being confirmed by other observational studies. A kinematical study of the GC system of the central galaxy of the Virgo Cluster, M87, shows the presence of significant sub-structures, pointing to active galaxy assembly (Strader et al., 2011). In the Virgo elliptical NGC4365, three separate rotating GC systems have been reported associated with the three color-families of GCs, in addition to a stream-like system (Blom et al., 2012).
With the exception of the large-scale arc structure observed in NGC4261 (D’Abrusco et al., 2013), little evidence is available in the literature about the 2D spatial distribution of GCs in early-type galaxies, let alone about the differences in the spatial distributions of GC color and luminosity classes due to major mergers. Romanowsky et al. (2012) discussed the existence of a phase space shell composed of GCs located in the inner halo of M87, which is possibly due to a significant merger, but there is no evidence of similar structures in the GC spatial distribution in M87. Based on these results, we deduce that the differences in the spatial distribution of high- and low-luminosity GCs in the N section of the NGC4649 arc suggests a more complex history involving both external minor accretion events and internal mechanisms that could influence the evolution of the NGC4649 GC system (i.e., dynamical friction and/or disk shocking). Overall, the emerging picture is a perturbed GC system, suggesting a still evolving NGC4649, perhaps caught in the moment of accreting some smaller satellite galaxy.
This interpretation is not straightforward because other supporting evidence is still lacking other than the overall kinematics of PN, GCs and the stellar component of NGC4649 (Das et al., 2011; Arnold et al., 2013). We have searched for the kinematical signature of gravitational interactions and accretion of satellites undergoing in NGC4649, by comparing the GC over-densities with the radial velocities for the sample of 121 GCs discussed by Lee et al. (2008) with spectroscopic observations. We do not find any obvious correlation. Moreover, Pierce et al. (2006) obtained spectra of 38 GCs in NGC4649 (all included in our sample) and did not find evidence that red GCs are significantly younger than blue GCs. However, the GC samples of Lee et al. (2008) and Pierce et al. (2006) are both sparse and do not provide the optimal coverage of the over-density feature.
The similarity of the radial density profiles of red and blue GCs in NGC4649 (per Figure 2, left) would be in principle consistent with NGC4649 being the result of a major dry merger (see Arnold et al., 2013; Shin & Kawata, 2009). However, our results suggest that the flattening of the radial density profiles of both color classes, instead than being the result of a global process with no azimuthal dependence, could be driven by the existence of major features in the spatial distribution of GCs. In the case of NGC4649, the arc extending from the center of the galaxy to the isophote and more significant for red GCs than for blue GCs, could be the responsible for the overall similarity of the radial density profiles of the two GC color classes.
5.2. The LMXB population of NGC4649
It has been recognized since their early discovery in the Milky Way that dynamical formation of LMXBs in GCs is highly efficient (Clark, 1975); some of these binaries could then be either kicked out from the parent cluster or be left in the stellar field after cluster disruption (Grindlay et al., 1984) (see also Kundu et al., 2002, for early-type galaxies). Therefore at least some field LMXBs could have been formed in GCs. However, LMXBs can also evolve from native binary systems in the stellar field (see review from Verbunt & van den Heuvel, 1995). The effectiveness of either or both formation channels for the LMXB populations of both the Milky Way and external galaxies is still a matter of debate. Based on statistical considerations on the properties of the LMXB populations detected with Chandra in early-type galaxies, there is some indication that field evolution is a viable formation channel (Juett, 2005; Irwin, 2005; Kim et al., 2009), and that the LMXBs detected in the stellar field may be of mixed origin (Kim et al., 2009; Mineo et al., 2013).
As is the case for GCs, LMXBs are also objects that can be detected individually in elliptical galaxies with the resolution of Chandra (see Fabbiano, 2006). Therefore, their spatial distribution may provide some constraints on their origin. In particular, native field LMXBs should - within statistics - trace the stellar surface brightness distribution of their parent galaxy. Although there has been some debate on the radial profiles of LMXBs and their comparison with those of the stellar surface brightness and of GCs (Kim et al., 2006; Kundu et al., 2007), in NGC4649 there is clear evidence (Mineo et al., 2013) that GC-LMXBs in red and blue GCs follow the same radial profiles as their parent GC populations, while field LMXBs in NGC4649 are radially distributed like the stellar surface brightness. However, within the limited sample statistics, LMXBs in red GCs are also distributed as the stellar light, with the exception of a marked lack of both red GCs and associated LMXBs in the centermost region. Therefore these results are still consistent with a mixed origin for the field LMXB population.
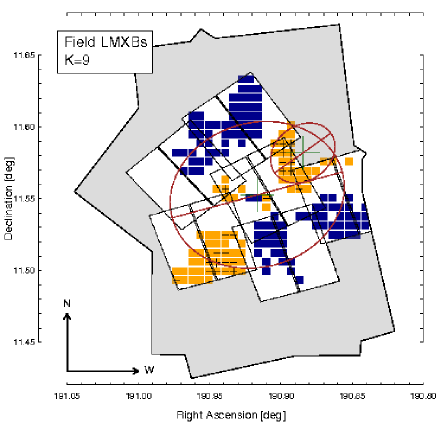
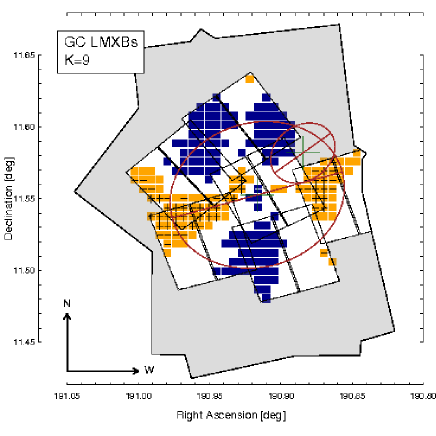
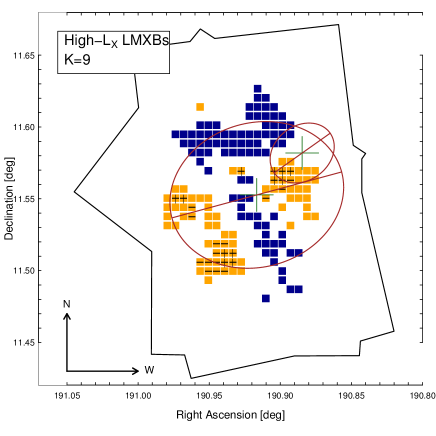
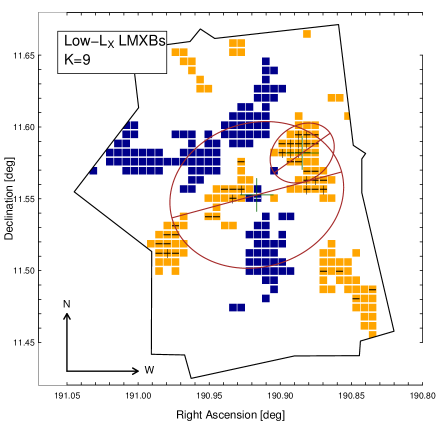
We have found (Section 4.2) that the 2D distribution of LMXBs shows a positive excess over a simple radial distribution with no azimuthal dependences, in the region near to the eastern major axis of NGC4649, where the excess feature of GCs is also observed (see Figure 11, which displays the higher significance individual pixels for the residual distribution of different classes of LMXBs). Not surprisingly, the excess residuals of the distribution of LMXBs in GC, which are overwhelmingly associated with red GCs (Luo et al., 2013; Mineo et al., 2013), resemble those of the red GCs. However, the 2D distribution of field LMXBs also shows large-scale anisotropy, which would not be expected if these sources were solely associated with native field binaries. The excess residuals appear to be adjacent to, but not overlapping, those seen in the 2D distribution of GC-LMXBs. This excess of field LMXBs is dominated by high luminosity LMXBs (). A second excess clump of these high-luminosity LMXBs is instead associated with the eastern end of the major axis; this over-density of high-luminosity LMXBs is composed by equal number of GC-LMXBs and field LMXBs (see right plot in Figure 1). Positive residuals in the low luminosity LMXB 2D distribution are found extending along the eastern major axis, mostly associated to the positions of field LMBXs (compare right plot in Figure 1); given their spatial distribution, though, these are also likely to have been originated in GCs.
Of the two over-densities visible in the residual map generated with all the LMXBs (Figure 8) in the N-E and S-W corners of the Chandra field, only the S-W structure can be seen in the residual map generated by low-LX LMXBs; neither is see in the high-LX residuals (Figure 11). The differences in the significance of these two LMXB over-density structures are due to the higher values of the radial density profile of high-L LMXBs at larger radii compared to that of low-L at large radii (see Figure 2), while both over-densities are composed of similar fractions of high and low luminosity X-ray sources. The N-E structure contains a total of 23 X-ray sources (12 low-luminosity and 11 high-luminosity), while the S-W region contains 45 total sources (27 low-luminosity and 18 high-luminosity).
The presence of this high-L excess of field sources, to the south of the GC (and GC-LMXB) excess feature, suggests that these sources cannot have been formed in GCs and ejected in the field, unless the streaming motion of the GCs and of the ejected LMXBs are subject to different accelerations. The escape velocity for a typical GC can be as low as 30 km s-1 (Morscher et al., 2013), where the range of line of sight velocities observed for GCs in massive elliptical galaxies extends from few to few thousands km s-1 (Strader et al., 2011). This suggests that lacking other forces, the LMXBs ejected should settle into a cloud surrounding their parent GCs. However, dynamical friction may cause the observed positional offset between the over-density of red GCs observed along the E side of the major axis (upper right plot in Figure 11) and the field LMXBs structure observed along the isophote south of the main GCs over-density (upper left plot in Figure 11). We assume a standard mass for the LMXBs-hosting GCs consistent with their average absolute magnitudes (Strader et al., 2012). We further assume a circular velocity km s-1 based on the results from Humphrey et al. (2008). Using as starting radial distance half the length of the major axis of the galaxy equivalent to kpc, we estimate the time required to recreate the angular and radial separation of the field LMXBs and GCs LMXBs over-densities with equation (7-26) of Binney & Tremaine (2008), that evaluates the time required for a GC moving on a circular orbit of radius with velocity to reach the center of the galaxy ( is assumed, based on typical values of the GC physical parameters):
| (1) |
We obtain a time scale of Gyr. This timespan is shorter than the average GC age of 10 Gyr estimated by Pierce et al. (2006), and within the range of single GCs measurements by these authors. Accurate kinematic measurements for GC population in NGC4649 would be needed to test this hypothesis. Also, we point out that our simple evaluation of the effects of the dynamical friction should only be considered indicative. A full set of dynamical simulations of the evolution of the GC system of NGC4649 as the results of satellite accretion and mergers is required. Alternatively, one could speculate that the merging event originating the GC over-density may have also resulted in a compressed gaseous stream from the disrupted satellite galaxy, with subsequent star and X-ray binary formation. The higher luminosity of the over-dense field X-ray sources would be consistent with a younger age than the overall LMXB population (Fragos et al. 2013a, b).
5.3. The X-ray binary population of NGC4647
NGC4647 is a spiral galaxy in Virgo that can be seen to the N-W of NGC4649. Based on its aspect and photometric properties, Lanz et al. (2013) conclude that it is tidally interacting with NGC4649. There is a concentration of X-ray sources (positive residuals) associated with this spiral galaxy. The high-luminosity X-ray sources concentrate in the southern half of NGC4647. This is the part of the galaxy showing a prominent asymmetric arm suggesting interaction with NGC4649, and exhibiting more intense star formation (Lanz et al., 2013; Mineo et al., 2013). These luminous sources are likely younger HMXBs, associated with the ongoing intense star formation (e.g. Mineo et al., 2012). Our results agree with the overall picture of tidal interaction between NGC4647 and NGC4649. NGC4647 may well be the next accreted satellite.
6. Summary and Conclusions
Our analysis of the 2D projected distribution of the GC and LMXB populations of the giant Virgo elliptical NGC4649 (M60) has led to the following results:
-
•
There are significant 2D asymmetries in the projected distributions of both GCs and LMXBs.
- •
-
•
The 2D distribution of GCs shows strong positive residuals along the major axis of NGC4649, especially on the E side, with an arc-like curvature towards the N, beginning at a galactocentric radius of kpc and extending out to kpc. This large-scale feature is more prominent in the distribution of red GCs, but can still be seen in the 2D distribution of blue GC, which is overall noisier. High-luminosity GCs tend to concentrate at the S end of the “arc”, while low-luminosity GCs are found in the Northern portion.
-
•
The 2D distribution of LMXBs also shows positive excess in the E major axis side of NGC4649.
-
•
The anisotropies of the distribution of LMXBs in GC, which are overwhelmingly associated with red GCs, resembles that of red GCs. However, field LMXBs also show large-scale anisotropies, with positive excess to the S of the red GC feature; this excess is composed of high luminosity LMXB (), which are also associated with the E end of the major axis (these are partially associated to the position of GC-LMXBs). Positive excess in low luminosity LMXB, mostly composed of field LMXBs, is found extending along the E major axis; given their position, we speculate that these sources are likely to have formed in GCs and subsequently ejected in the field.
-
•
There is a definite concentration of LMXBs (positive residuals) associated with the spiral galaxy NGC4647 in the N-W side of NGC4649. The higher X-ray luminosity portion of these sources tends to concentrate in the southern half of NGC4647.
These results have important implications for the evolution of NGC4649. In particular, they suggest accretion and merging of satellite galaxies, of which the GC anisotropic distribution is the fossil remnant. LMXB over-densities are found associated with those of red GCs, consistent with dynamic LMXB formation in these clusters. Surprisingly, there is also an over-density in the distribution of field LMXBs, to the south of the red GC over-density. This over density suggests that these LMXBs should be somewhat connected with the GC overdensity. The displacement, however, implies either (1) GC formation followed by ejection and dynamical friction drag on the parent GCs, or (2) field formation stimulated by compression of the ISM during a merging event.
We also clearly detect the over-density of X-ray sources connected with the X-Ray Binaries (XRB) population of the companion spiral galaxy NGC4647. We note that the XRBs sources located in the southern half of the NGC4647, where the star formation rate appears to be more intense (see Mineo et al. (2013)), are significantly more luminous that the X-ray sources observed in northern region of NGC4647, with . This result may suggest a younger XRB population. We speculate that this asymmetry may indicate the beginning of the tidal interaction of NGC4647 with NGC4649.
Our analysis and the kinematics of NGC4649 (Das et al., 2011; Coccato et al., 2013; Arnold et al., 2013) suggest a complex assembly history for this galaxy, including one major merger and a sequence of satellite accretion events, with possibly continuous tidal stripping of GCs and PNs from nearby low-luminosity galaxies. Explaining the origin of the over-density structures in the spatial distribution of GCs and of the luminosity and color segregations within such features in NGC4649 will require both detailed numerical simulations with a realistic model of the galaxy potential and extensive campaign for the spectroscopic observation required to reconstruct accurately the kinematics of the whole GC population. The detailed characterization of the 2D spatial distribution of GCs and LMXBs in NGC4649 that we have achieved will provide a new benchmark for future work aimed at the understanding of the dynamical evolution of this interesting system.
References
- Angelini et al. (2001) Angelini, L., Loewenstein, M., & Mushotzky, R. F. 2001, ApJ, 557, L35
- Arnold et al. (2013) Arnold, J. A., Romanowsky, A. J., Brodie, J. P., et al. 2013, arXiv:1310.2607
- Ashman & Zepf (1992) Ashman, K. M., & Zepf, S. E. 1992, ApJ, 384, 50
- Bastian et al. (2013) Bastian, N., Schweizer, F., Goudfrooij, P., Larsen, S. S., & Kissler-Patig, M. 2013, MNRAS, 431, 1252
- Belokurov et al. (2006) Belokurov, V., Zucker, D. B., Evans, N. W., et al. 2006, ApJ, 647, L111
- Binney & Tremaine (2008) Binney, J., & Tremaine, S. 2008, Galactic Dynamics: Second Edition, by James Binney and Scott Tremaine. ISBN 978-0-691-13026-2 (HB). Published by Princeton University Press, Princeton, NJ USA, 2008.,
- Blakeslee et al. (2009) Blakeslee, J. P., Jordán, A., Mei, S., et al. 2009, ApJ, 694, 556
- Blom et al. (2012) Blom, C., Forbes, D. A., Brodie, J. P., et al. 2012, MNRAS, 426, 1959
- Bonfini et al. (2012) Bonfini, P., Zezas, A., Birkinshaw, M., et al. 2012, MNRAS, 421, 2872
- Bournaud et al. (2008) Bournaud, F., Duc, P.-A., & Emsellem, E. 2008, MNRAS, 389, L8
- Brassington et al. (2009) Brassington, N. J., Fabbiano, G., Kim, D.-W., et al. 2009, ApJS, 181, 605
- Brodie & Strader (2006) Brodie, J. P., & Strader, J. 2006, ARA&A, 44, 193
- Clark (1975) Clark, G. W. 1975, ApJ, 199, L143
- Coccato et al. (2013) Coccato, L., Arnaboldi, M., & Gerhard, O. 2013, MNRAS, 436, 1322
- D’Abrusco et al. (2013) D’Abrusco, R., Fabbiano, G., Strader, J., et al. 2013, ApJ, 773, 87
- Das et al. (2011) Das, P., Gerhard, O., Mendez, R. H., Teodorescu, A. M., & de Lorenzi, F. 2011, MNRAS, 415, 1244
- de Grijs & Robertson (2006) de Grijs, R., & Robertson, A. R. I. 2006, A&A, 460, 493
- de Vaucouleurs et al. (1991) de Vaucouleurs, G., de Vaucouleurs, A., Corwin, H. G., Jr., et al. 1991, S&T, 82, 621
- Di Matteo et al. (2005) Di Matteo, T., Springel, V., & Hernquist, L. 2005, Nature, 433, 604
- Dressler (1980) Dressler, A. 1980, ApJ, 236, 351
- Fabbiano (2006) Fabbiano, G. 2006, ARA&A, 44, 323
- Fabbiano et al. (2010) Fabbiano, G., Brassington, N. J., Lentati, L., et al. 2010, ApJ, 725, 1824
- Forbes & Bridges (2010) Forbes, D. A., & Bridges, T. 2010, MNRAS, 404, 1203
- Fragos et al. (2013a) Fragos, T., Lehmer, B., Tremmel, M., et al. 2013a, ApJ, 764, 41
- Fragos et al. (2013b) Fragos, T., Lehmer, B. D., Naoz, S., Zezas, A., & Basu-Zych, A. R. 2013b, arXiv:1306.1405
- Gilfanov (2004) Gilfanov, M. 2004, MNRAS, 349, 146
- Gilli et al. (2007) Gilli, R., Comastri, A., & Hasinger, G. 2007, A&A, 463, 79
- Grindlay et al. (1984) Grindlay, J. E., Hertz, P., Steiner, J. E., Murray, S. S., & Lightman, A. P. 1984, ApJ, 282, L13
- Jordán et al. (2009) Jordán, A., Peng, E. W., Blakeslee, J. P., et al. 2009, ApJS, 180, 54
- Juett (2005) Juett, A. M. 2005, ApJ, 621, L25
- Humphrey et al. (2008) Humphrey, P. J., Buote, D. A., Brighenti, F., Gebhardt, K., & Mathews, W. G. 2008, ApJ, 683, 161
- Ibata et al. (1994) Ibata, R. A., Gilmore, G., & Irwin, M. J. 1994, Nature, 370, 194
- Irwin (2005) Irwin, J. A. 2005, ApJ, 631, 511
- Ivanova et al. (2012) Ivanova, N., Fragos, T., Kim, D.-W., et al. 2012, ApJ, 760, L24
- Janowiecki et al. (2010) Janowiecki, S., Mihos, J. C., Harding, P., et al. 2010, ApJ, 715, 972
- Kim & Fabbiano (2004) Kim, D.-W., & Fabbiano, G. 2004, ApJ, 613, 933
- Kim et al. (2006) Kim, E., Kim, D.-W., Fabbiano, G., et al. 2006, ApJ, 647, 276
- Kim et al. (2009) Kim, D.-W., Fabbiano, G., Brassington, N. J., et al. 2009, ApJ, 703, 829
- Kim & Fabbiano (2013) Kim, D.-W., & Fabbiano, G. 2013, arXiv:1304.6377
- Kundu et al. (2002) Kundu, A., Maccarone, T. J., & Zepf, S. E. 2002, ApJ, 574, L5
- Kundu et al. (2007) Kundu, A., Maccarone, T. J., & Zepf, S. E. 2007, ApJ, 662, 525
- Lanz et al. (2013) Lanz, L., Zezas, A., Brassington, N., et al. 2013, ApJ, 768, 90
- Lee et al. (2008) Lee, M. G., Hwang, H. S., Park, H. S., et al. 2008, ApJ, 674, 857
- Luo et al. (2013) Luo, B., Fabbiano, G., Strader, J., et al. 2013, ApJS, 204, 14
- McConnachie et al. (2009) McConnachie, A. W., Irwin, M. J., Ibata, R. A., et al. 2009, Nature, 461, 66
- Mineo et al. (2012) Mineo, S., Gilfanov, M., & Sunyaev, R. 2012, MNRAS, 419, 2095
- Mineo et al. (2013) Mineo, S., Fabbiano, G., D’Abrusco, R., et al. 2013, arXiv:1306.6490
- Morscher et al. (2013) Morscher, M., Umbreit, S., Farr, W. M., & Rasio, F. A. 2013, ApJ, 763, L15
- Navarro et al. (2010) Navarro, J. F., Ludlow, A., Springel, V., et al. 2010, MNRAS, 402, 21
- Navarro et al. (1994) Navarro, J. F., Frenk, C. S., & White, S. D. M. 1994, MNRAS, 267, L1
- Paolillo et al. (2011) Paolillo, M., Puzia, T. H., Goudfrooij, P., et al. 2011, ApJ, 736, 90
- Peñarrubia et al. (2009) Peñarrubia, J., Walker, M. G., & Gilmore, G. 2009, MNRAS, 399, 1275
- Pierce et al. (2006) Pierce, M., Bridges, T., Forbes, D. A., et al. 2006, MNRAS, 368, 325
- Romanowsky et al. (2012) Romanowsky, A. J., Strader, J., Brodie, J. P., et al. 2012, ApJ, 748, 29
- Salinas et al. (2012) Salinas, R., Jílková, L., Carraro, G., Catelan, M., & Amigo, P. 2012, MNRAS, 421, 960
- Schweizer & Seitzer (1998) Schweizer, F., & Seitzer, P. 1998, AJ, 116, 2206
- Shin & Kawata (2009) Shin, M.-S., & Kawata, D. 2009, ApJ, 691, 83
- Strader et al. (2011) Strader, J., Romanowsky, A. J., Brodie, J. P., et al. 2011, ApJS, 197, 33
- Strader et al. (2012) Strader, J., Fabbiano, G., Luo, B., et al. 2012, ApJ, 760, 87
- Tal et al. (2009) Tal, T., van Dokkum, P. G., Nelan, J., & Bezanson, R. 2009, AJ, 138, 1417
- Teodorescu et al. (2011) Teodorescu, A. M., Méndez, R. H., Bernardi, F., et al. 2011, ApJ, 736, 65
- Tzanavaris et al. (2013) Tzanavaris, P., Fragos, T., Tremmel, M., et al. 2013, ApJ, 774, 136
- Verbunt & van den Heuvel (1995) Verbunt, F., & van den Heuvel, E. P. J. 1995, X-ray Binaries, 457
- White & Rees (1978) White, S. D. M., & Rees, M. J. 1978, MNRAS, 183, 341
- Zibetti et al. (2009) Zibetti, S., Charlot, S., & Rix, H.-W. 2009, MNRAS, 400, 1181