11email: Olivier.Chesneau@oca.eu22institutetext: Leiden Observatory, Leiden University Postbus 9513, 2300RA Leiden, The Netherlands 33institutetext: FNRS, Département AGO, Université de Liège, Allée du 6 Août 17, Bat. B5C, B-4000 Liège, Belgium 44institutetext: Steward Observatory, University of Arizona, 933 North Cherry Avenue, Tucson, AZ 85721, USA 55institutetext: European Southern Observatory, Alonso de Cordova 3107, Casilla 19001, Vitacura, Santiago 19, Chile 66institutetext: Aix Marseille Université, CNRS, LAM (Laboratoire d’Astrophysique de Marseille) UMR 7326, 13388, Marseille, France 77institutetext: Departamento de Física y Astronomá, Universidad de Valparaíso, Chile 88institutetext: South African Astronomical Observatory, PO Box 9, 7935 Observatory, South Africa; Astronomy, Cosmology and Gravitation Centre, Astronomy Department, University of Cape Town, 7700 Rondebosch, South Africa 99institutetext: Geneva Observatory, Geneva University, Chemin des Maillettes 51, 1290, Sauverny, Switzerland 1010institutetext: Royal Observatory of Belgium, Ringlaan 3, 1180, Brussels, Belgium 1111institutetext: American Association of Variable Star Observers, 49 Bay State Road, Cambridge, MA 02138, USA 1212institutetext: School of Physics & Astronomy, University of Leeds, Woodhouse Lane, Leeds, LS2 9JT, UK 1313institutetext: Las Cumbres Observatory Global Telescope Network, Goleta, CA, 93117, USA 1414institutetext: Department of Electrical Engineering and Center of Astro Engineering, Pontificia Universidad Catolica de Chile, Av. Vicuña Mackenna 4860 Santiago, Chile
The yellow hypergiant HR 5171 A: Resolving a massive interacting binary in the common envelope phase††thanks: Based on observations made with ESO telescopes at the La Silla / Paranal Observatory under program ID 088.D-0129 and from Gemini/South Observatory under program GS-2011A-C-4.
Abstract
Context. Only a few stars are caught in the very brief and often crucial stages when they quickly traverse the Hertzsprung-Russell diagram, and none has yet been spatially resolved in the mass transfer phase.
Aims. We initiated long-term optical interferometry monitoring of the diameters of massive and unstable yellow hypergiants (YHG) with the goal of detecting both the long-term evolution of their radius and shorter term formation of a possible pseudo-photosphere related to proposed large mass-loss events.
Methods. We observed HR 5171 A with AMBER/VLTI. We also examined archival photometric data in the visual and near-IR spanning more than 60 years, as well as sparse spectroscopic data.
Results. HR 5171 A exhibits a complex appearance. Our AMBER data reveal a surprisingly large star for a YHG R∗=1315260R⊙ (or 6.1 AU) at the distance of 3.60.5kpc. The source is surrounded by an extended nebulosity, and these data also show a large level of asymmetry in the brightness distribution of the system, which we attribute to a newly discovered companion star located in front of the primary star. The companion’s signature is also detected in the visual photometry, which indicates an orbital period of Porb=13046d. Modeling the light curve with the NIGHTFALL program provides clear evidence that the system is a contact or possibly over-contact eclipsing binary. A total current system mass of M⊙ and a high mass ratio 10 is inferred for the system.
Conclusions. The low-mass companion of HR 5171 A is very close to the primary star that is embedded within its dense wind. Tight constraints on the inclination and of the primary are lacking, which prevents us from determining its influence precisely on the mass-loss phenomenon, but the system is probably experiencing a wind Roche-Lobe overflow. Depending on the amount of angular momentum that can be transferred to the stellar envelope, HR 5171 A may become a fast-rotating B[e]/Luminous Blue Variable (LBV)/Wolf-Rayet star. In any case, HR 5171 A highlights the possible importance of binaries for interpreting the unstable YHGs and for massive star evolution in general.
Key Words.:
Techniques: high angular resolution; (Stars:) individual: HR 5171A, V382 Car; Stars: binaries: close; Stars: circumstellar matter; Stars: massive; Stars: mass-loss1 Introduction
Yellow hypergiants (YHGs) are visually bright evolved sources that have extreme luminosities of log(L/L⊙) = 5.6-5.8, which exhibit episodes of strong mass loss (de Jager, 1998; Oudmaijer et al., 2009; Nieuwenhuijzen et al., 2012). Owing to their large variability, both photometric and spectroscopic, and their spectacular spectral type evolution for some targets, these sources may deserve to be described as “Luminous Yellow Variables” in a similar manner to the so-called luminous blue variables (LBVs). About ten of these stars have been clearly identified in our Galaxy so far. In some cases, uncertainty in their distance estimation renders their classification as highly luminous sources difficult, and confusion may exist between classical yellow supergiants (YSGs) and these more extreme yellow hypergiant (YHGs). Their spectra show many lines that originate in stellar winds and, in particular, the presence of the infrared Ca ii triplet, as well as infrared excess from dust (2013arXiv1305.6051H). They also show an overabundance of Na that is supposed to provide indirect evidence of a post-red supergiant nature, because Na is produced in the Ne-Na cycle in the high-temperature core of red supergiants. Because of their transitory nature, YHGs provide a critical challenge for evolutionary modeling, so they are of great interest for extragalactic studies (Neugent et al., 2012; Drout et al., 2012).
These stars are also subject to important activity that is characterized by time variations in the line profiles and striking switches between emission and absorption in the 2.3m CO bands (e.g., $ρ$ Cas on the scale of months as reported in Gorlova et al., 2006). These violent changes are suggested to be the result of outbursts, which are caused by pulsations occurring during a period of instability. Occasionally or even permanently, the wind density is such that it may lead to the formation of a modest-to-strong pseudo-photosphere that might alter the star’s apparent position on the H-R diagram, as seen in Wolf-Rayet stars and LBVs. Smith et al. (2004) speculate that the YHGs might be the ‘missing LBVs’ in the Hertzsprung Russell (HR) diagram, since their true surface temperature is masked by the screening of the wind.
The instability of YHGs has traditionally been attributed to the star having the first adiabatic index below 4/3, leading to potentially strong pulsational activity (Stothers, 2012; Nieuwenhuijzen & de Jager, 1995). Lobel (2001) has provided the theoretical framework of the Ledoux’s stability integral atmospheric stability criterion in cool massive stars. Another possibility, not discussed thus far in the literature, is to invoke the additional influence of a companion star that may perturb a loosely bound envelope.
The evolution of such stars across the Herzprung-Russell (HR) diagram has so far been monitored thanks to photometric and spectroscopic data taken on a roughly annual basis. The advent of routine optical interferometry in the southern and northern hemispheres presents an opportunity to monitor the evolution of the angular diameter of the YHGs and also their blue counterparts, the luminous blue variables that experience the so-called S Doradus phase (Groh et al., 2009b). The large variations in the photometric characteristics and spectral type exhibited by these stars should have measurable consequences on their apparent diameters. In this paper, we focus our work on one source, HR 5171 A. We also observed the YSG V382 Car (HD 96918), which we used as a reference for the interferometric data on HR 5171 A, owing to their similar -band magnitudes, 1.6 versus 0.9 mag, respectively, and similar expected extension in the sky in the range of 2-3 mas.
HR 5171 A (V766 Cen, HD 119796, HIP 67261) is one of the first objects identified as YHG in our galaxy (Humphreys et al., 1971; Warren, 1973; van Genderen, 1992) with a spectral type between G8Ia+ and K3Ia+, but it remains a poorly studied object. This star and its widely separated B0 Ib companion HR 5171 B, located 9.4” away, dominate the energy balance in their local environment, causing a large photodissociation region known as Gum48d (Karr et al., 2009; Schuster, 2007). HR 5171 A lies in the center of the HII region and was most likely the dominant ionizing source until its recent post-main-sequence evolution took place. It is not clear whether the companion is bound at such a large separation, yet given their apparently similar distances, their isolated location on the sky, and their short lifetime, it is probable that they both originate in the same molecular complex. The distance is reasonably well constrained by several independent estimates to be D = 3.60.5kpc (Karr et al., 2009; Schuster et al., 2006; van Genderen, 1992; Humphreys et al., 1971). At such a large distance, the estimated luminosity is logL/L⊙5.7-6, making HR 5171 A as bright as the famous IRC+10420 (Driebe et al., 2009; Oudmaijer et al., 1996).
The cool temperature and the potentially high mass-loss rate of HR 5171 A have led to the formation of a complex circumstellar environment. It exhibits a large infrared excess due to dust with a strong silicate absorption, although no scattered light was observed around HR 5171 A at visual wavelengths with deep HST images (Schuster et al., 2006).
Our AMBER/VLTI observations, described below, revealed the extremely interesting binary nature of HR 5171 A, which prompted us to thoroughly reinvestigate all published photometric and spectroscopic datasets and to search for possible unpublished data. The analysis of such a large dataset cannot be exhaustive so we focus here on establishing the binary nature of the source by investigating its spectral evolution and the complex mass-loss history documented by visual and near-infrared photometry and spectroscopy.
The paper is organized as follows. Section.2 describes the observations, consisting primarily of AMBER/VLTI observations. This was complemented by archival optical and near-IR data, a few archival and recent spectra, together with a coronagraphic image of the source in the near-IR. Sections.3, 4 and 5 focus on the analysis of the near-IR interferometric, photometric and spectroscopic data, respectively. Finally, in Sect. 6 we discuss the implications of discovering such a low-mass companion for the fate of this star, and the potential impact of still undiscovered companions in the yellow or red supergiant stages.
2 Observations
2.1 AMBER/VLTI interferometric observations
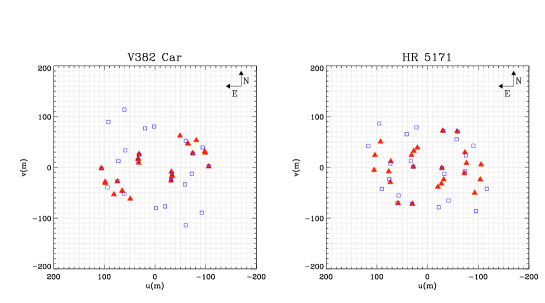
V382 Car and HR 5171 A were observed during 1.5 nights in March 2012 at the Paranal Observatory. The VLTI 1.8m auxiliary telescopes (ATs) and the AMBER beam recombiner (Petrov et al., 2007) were used. On March 8 (JD = 2 455 994), observations were carried out using the low spectral resolution mode (R=30) and providing a simultaneous record of the , and bands. On March 9 an additional half night of observations was carried out in medium spectral mode (R=1500) centered at 2.3 m and covering the 2.17 m Br line and the 2.3-2.4 m CO bands. All data were recorded using the FINITO fringe tracker that stabilizes optical path differences due to atmospheric turbulence. The fringe tracker allows using a longer exposure time and a significantly improves the signal-to-noise ratio and overall data quality. The stars HD 96566 (spectral type G8III, =1.500.04mas) and HD 116243 (spectral type G6II, =1.370.04mas) were used as interferometric calibrators and their diameters obtained from the SearchCal software (Bonneau et al., 2006). The observations log is presented in Table 3 and the () plan coverage for all targets is plotted in Fig. 1. We reduced the data using the standard AMBER data reduction software amdlib v3.0.3b1 (Tatulli et al., 2007; Chelli et al., 2009). The average raw complex visibility and closure phase were determined using several selection criteria. The interferometric calibration was then performed using custom-made scripts described by Millour et al. (2008).
2.2 Optical photometry
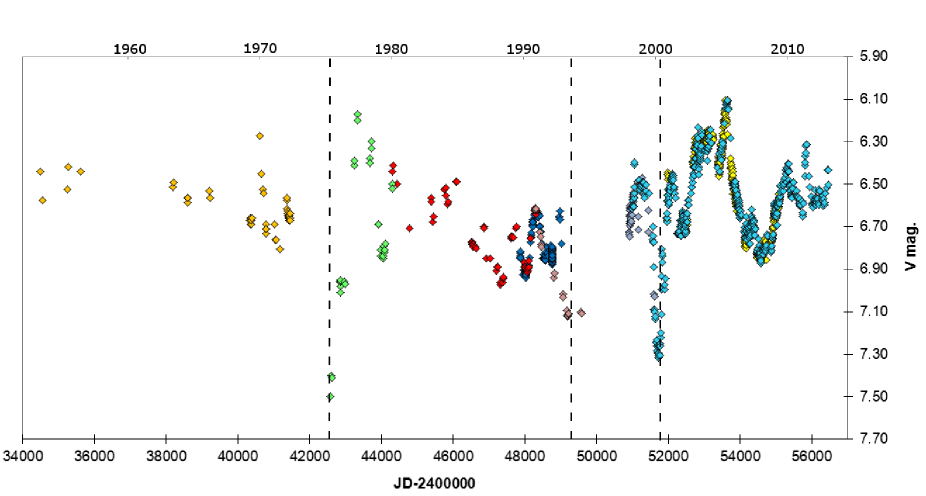
The photometric observations of HR 5171 A are shown in Fig. 3 and the log of the observations together with some statistical information can be found in Table 4.
The observations consist of several photometric data sets: a historical one gathered by van Genderen (1992), consisting of Johnson and Walraven photometry, three unpublished observations made in 1977 (JD 2443248.5, 2443252.5 and 2443269.5, Pel 2013, priv.comm.), Hipparcos (Hp) photometry retrieved from van Leeuwen et al. (1998), unpublished Stroemgren photomery by the Long-Term Photometry of Variables group (LTPV) initiated by Sterken (1983), unpublished -band photometry by Liller, unpublished ASAS-3 photometry (Pojmanski, 2002), and recent unpublished -band photometric observations from Otero. After correcting for the contribution of HR 5171 B, Liller’s -band observations were made fainter by 0.39 mag to match the scale. The reason is probably the use of a non standard filter.
Owing to the extremely red color of HR 5171 A and its high interstellar and circumstellar reddening, a transformation from the color index () to the of the standard system is unreliable. It appeared that in order to match the color indices obtained with a genuine UBV photometer, 0.1 mag should be added to the computed (van Genderen, 1992). No obvious difference was apparent between computed and obtained with an photometer. To match the magnitude scale, the Hp magnitudes were corrected by adding 0.15 mag (van Leeuwen et al., 1998). The coincident overlap of part of the time series with and Hipparcos data allowed us to derive the following corrections: add -0.07 mag to to get , and add +0.72 mag to to get ().
However, all these corrections should be considered with caution. The number of overlapping data points obtained in the different photometric systems is usually small. Additionally, the color dependence of transformation formulae and of the empirically derived corrections should not be underestimated due to the variable color of HR 5171 A.
The temporal sampling of Hipparcos measurements is very irregular. Therefore we averaged the measurements secured within the same day, thereby improving the resulting data appearance. Until JD 2453000, the ASAS-3 light curve suffered from saturation and cannot be used with confidence, but after this date the scheduling of observations changed from a single three-minute exposure to three one-minute exposures. Stars as bright as sixth magnitude became unsaturated. The agreement with the visual photometry from Sebastian Otero is excellent, illustrating the quality of these amateur observations. From the van Genderen data, we selected the densest subset from JD 2446500 to 2448315 during which the mean magnitude of HR 5171 A was relatively stable. The datasets that included the = 10.01 mag companion 9.4”away were corrected so all the magnitudes correspond to the G8-K0 hypergiant without the contribution of the B0 supergiant.
The -band data were complemented by -band photometry as much as possible. Unfortunately, only sparse -band observations have been retrieved to complement the extensive dataset published in van Genderen (1992). We retrieved a single epoch of contemporaneous and -band measurements in the AAVSO archives (obs: G. Di Scala at JD = 2452456.09045).
We also searched for some historical measurements of the visual magnitude of HR 5171 A. The visual magnitude reported in 1875 by Gould (1879) is 6.8 mag, converted to = 6.51 mag. This agrees with Thome (1932) who reports 7.0 mag, and with the photovisual magnitude of 6.23 mag from the Henry Draper catalog (Cannon, 1936).
2.3 Infrared photometry
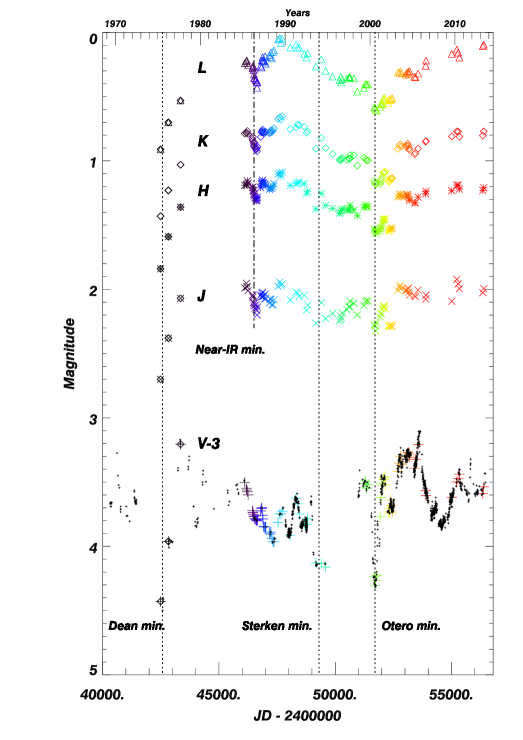
We present unpublished near-infrared () data in Table 4 and shown in Fig. 4. They were obtained from 1975 until the present with the MkII infrared photometer, through a 36” aperture, on the 0.75m telescope at the South African Astronomical Observatory (SAAO) at Sutherland. The magnitudes are on the SAAO system as defined by Carter (1990) and are accurate to mag at and mag at . No corrections have been applied for the contribution of HR 5171 B, which is mostly negligible. We also present some recent mid-IR data in Sect.D in the Appendix.
2.4 Spectroscopic data
Visual-wavelength spectra of HR 5171 A are unfortunately quite rare, although they can help characterize the spectral type of HR 5171 A and the of the primary star more precisely. High-resolution archival AAT/UCLES spectra taken in 1992 and 1994 were retrieved from the Anglo-Australian Telescope (AAT) archives222http://apm5.ast.cam.ac.uk/arc-bin/wdb/aat_database/observation_log/make. They were taken with UCLES, a cross-dispersed Echelle spectrograph located at the coudé focus of the AAT offering high resolution combined with good wavelength coverage. The 31.6 lines/mm setting gives almost continuous wavelength coverage at bluer wavelengths, with a short slit length (6-15 arcsec). The data were reduced using IRAF. The quality of the wavelength calibration of the 1992 spectrum was tested using nearby observation of the star $κ$ TrA and was compared with archival UVES/VLT data. The wavelength calibration of the 1994 data was more difficult to perform because no suitable ThAr reference could be found in the archive. The 1992 UCLES/AAT spectrum covers the range 531-810nm, and the two 1994 spectra cover the range 457-697nm. The width of telluric lines has a minimum of 0.0168 nm at 687.8 nm, which is about 7.3 , providing a lower limit to the instrumental resolution of R = 41000.
Low- and medium-resolution spectra were acquired at SAAO in 2013 with the Grating Spectrograph at the 1.9 m Radcliffe telescope. Several spectra centered at were obtained with gratings 5 and 7 yielding a spectral resolution of about R = 1000 and R = 6000 over spectral bands of 370 and 80nm, respectively. The low-resolution spectra were calibrated with a CuAr lamp and the medium-resolution ones with a CuNe lamp. A standard star, LTT7379 (G0) was also observed to provide accurate spectrophotometry333http://www.eso.org/sci/observing/tools/standards/spectra/ltt7379.html.
Radial-velocity monitoring of the source would provide crucial information about the binary. The only radial velocity data reported in the literature are from Balona (1982). The radial velocities were obtained by cross-correlating the spectra of several yellow super- and hypergiants with a G2II template ($δ$ TrA) and he estimated his error to be 2.5 . Thirty-eight spectra of HR 5171 A were secured over 837 days, between JD=2443940 (March 7, 1979) and 2444777 (June 21, 1981). Balona (1982) reports a strong peak at a period of 263.2 d, and a radial velocity variation of 9 .
We initiated spectral monitoring with Pucheros (Vanzi et al., 2012), an optical spectrograph of the Pontificia Universidad Catolica de Chile (PUC). It is a fiber-fed echelle that provides spectral resolution R = 20,000 in the visible (390-730 nm) and a radial velocity accuracy of 0.1 . The instrument is installed at the 50 cm telescope of the PUC Observatory located near Santiago, Chile (altitude of 1450m). The first observations were executed on April 11, 2013. Five spectra were taken, each one with 20 min of integration time, providing a combined spectrum with S/N of about 200.
2.5 NICI/Gemini South coronagraphic observations
Observations of HR 5171 A were performed with the NICI imager (Chun et al., 2008) on the Gemini South telescope in February 2011 under program ID GS-2011A-C-4 (P.I. N. Smith). The dataset consists of a series of 0.4s and 7.6s coronagraphic exposures with filters probing the narrow -band continuum (Kcont_G0710, 2.2718m, =1.55%) and the [Fe ii] line in the -band (FeII_G0712, 1.644m, =1.55%). The Focal Mask F0.9” (G5711) was used. The mask is completely opaque with a minimum transmission of about one part in 300. Stars centered below the mask are therefore dimmed by approximately 6.2 magnitudes.
3 Fitting by geometrical models
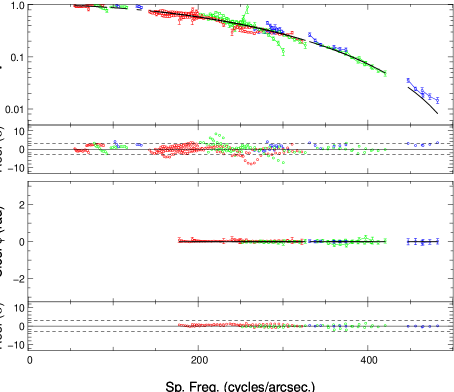
We analyzed the AMBER data with the LITpro software and our own routine fitOmatic (described in the next section and also in Millour et al., 2009). The two packages yield identical results for V382 Car. Both show that the source is best described as a simple uniform disk (UD) model with a diameter of 2.29 mas and an internal accuracy of 5% (reduced =3.4). We did not discard the noisier J band data in the analysis, since it provides important information at higher angular resolution. We performed some tests on the presence of diffuse extended emission, or of the existence of asymmetries in the data. The V382 Car data are compatible with the absence of such emission down to the 6% flux (accuracy limit) and an elongation greater than 0.5% is also excluded. In Fig. 5 (left), we show an illustration of the data fit with our best UD model, which can later be compared with HR 5171 A (right). The interferometric observations indicate a lack of significant emission around the star. This can be understood if V382 Car is a normal YSG rather than a more extreme YHG, since a significant contribution from the wind would be expected around a YHG. This classification is also consistent with its lack of infrared excess.
The HR 5171 A AMBER dataset shows clear differences compared to V382 Car.
-
•
First, the source is larger in angular size, indicated by the systematically lower visibilities at the same spatial frequencies.
-
•
Second, the visibilities at various spatial frequencies deviate strongly from the expected shape of a UD.
-
•
Third, a closure phase signal is observed rising at high spatial frequencies.
-
•
Fourth, all visibilities and closure phases show significant variations with wavelength, which are correlated with spectral features, particularly at the end of the K-band owing to the CO first-overtone absorption bands. The source is much more extended at these wavelengths due to increased opacity from a thick CO nebula.
The medium-resolution data reinforce this view of complex and spectrally rich information in the dispersed visibilities and phases. These data are shown and discussed more extensively in the appendix (Sect.B). To exploit this spectrally rich dataset, we used our software fitOmatic, a general-purpose model-fitting tool for optical long-baseline interferometry. In fitOmatic, the gradient descent algorithm is taken directly from LITpro. The main difference with the publicly available tool LITpro is the use of wavelength-dependent parameters and a global optimization method inspired by simulated annealing algorithms. These two additions allow some flexibility in the fitting process when dealing with chromatic variations, as in HR 5171 A. With fitOmatic, we test for the effect of wavelength-dependent flux ratios between the different geometrical models used.
We first tried to fit the HR 5171 A data with simple models such as a UD or a Gaussian Disk (GD) with a varying radius as a function of wavelength. Both fits were of poor quality, providing inconsistent variations in the parameters with wavelength. A fit with a uniform disk plus a Gaussian Disk, with wavelength-invariant diameters, but with varying flux ratios provided qualitatively better results for the visibilities, though the quality of the fit remained poor because none of these spherical models could by construction account for the smoothly varying closure phase as a function of spatial frequencies, which indicates an asymmetric source.
We incorporated this asymmetry in our models by adding an offset point source with a mean flux fraction that converged to about 12% of the total flux at 2.1m. Allowing this point source to be resolved (modeled as a UD) marginally improved the result of the fit but the angular resolution is insufficient to provide tight constraints on the secondary diameter apart from an upper limit. Table 1 lists all the models tested together with the reduced value obtained.
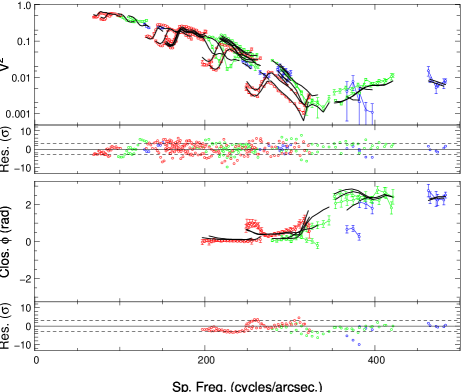
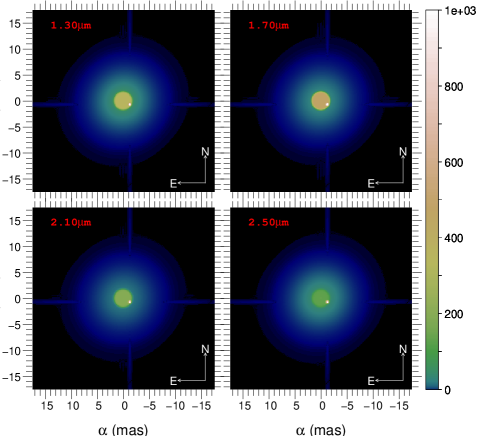
Therefore, our best interpretation of this dataset (see Fig. 5) provides a uniform disk diameter for the primary of 3.390.2 mas (12.60.5 AU for a distance D=3.6 kpc), surrounded by an extended envelope with a Gaussian full width at half maximum (FWHM) of 4.760.2 mas (170.7 AU) in the continuum. The close companion is visible in the limb of the primary, separated from the center by 1.450.07 mas (5.150.25 AU), and its flux ratio is 12 3% (2.3 mag) of the total flux at 2.1m(see the model appearance at various wavelengths in Fig.6). The secondary in the model would be smaller than 2.0 mas in diameter, but this parameter is weakly constrained with our restricted coverage444Baselines longer than 150m are clearly needed..
Assuming that the source is indeed described well by three components (i.e. the uniform disk, the Gaussian disk and the offset point source with achromatic sizes and positions), one can analyze their relative fluxes that were fitted for each independent spectral channel. Once these relative fluxes have been obtained, it is straightforward to get the spectrum of each component:
where is the total flux (i.e. the spectrum of the source). We extracted the spectra of the three geometrical components relative to the normalized total flux and discuss the results in Sect.6.1
| Geometrical | Achromatic | Flux ratio in percent | Reduced | ||
| model | parameters | 1.65 m | 2.10 m | 2.33 m | |
| UD+GD | 3.67/4.65 mas | 80/20 % | 50/50 % | 35/65% | 30 |
| UD+GD | 3.39/4.76 mas | 58/35/7 % | 58/33/9 % | 30/62/8 % | 8.6 |
| +offset PS | :1.45 mas, =-121∘ | ||||
| UD+GD | 3.39/4.76 mas | 57/34/9 % | 58/30/12 % | 29/60/11 % | 8.2 |
| :1.45 mas, =-121∘ | |||||
| +offset UD | 1.8 mas | ||||
4 Photometry
The detection of a companion passing in front of the primary prompted us to re-investigate the archival visual light curve of this bright star. HR 5171 A exhibits complex variations in the visible, as shown in Fig.3. The multicolor photometry was extensively described in several studies and, in particular, in van Genderen (1992). A large multicolor dataset has also been gathered from the blue to the near-IR, see Sect. 4.2.
4.1 Light curve analysis
A statistical analysis of the full visual curve yields a mean at =6.54 mag and a rms of 0.23 mag. However, this result depends on the period of observations, and we also performed the same analysis for each dataset. The results are shown in Table 4. This simple statistical analysis is important because it reveals several periods lasting several years of either relative quietness or enhanced activities. One can identify several minima, which we called the Dean (2442584, 1975), Sterken (2449330, 1993), and Otero (2451800, 2000) minima, separated by 6716d and 2470d, respectively. These minima are all characterized by a magnitude increase to 7.5, 7.2, and 7.3 mag for the Dean, Sterken, and Otero minima, respectively. The minima lasted about one year but seem to be followed by longer changes, an interpretation supported by the temporal behavior of the colors (Fig. 7, discussed in Sect.4.2). A brightness peak was observed a few years after the Dean and Otero minima, reaching a magnitude of 6.1-6.2 mag. The recent years probed by the ASAS and Otero observations (2000-2013) show that HR 5171 A was more active by a factor 2 compared to the periods between 1950 and 1970 (Table 4), and also between 1980 and 1992 that appear relatively stable by contrast.
The near-IR light curves shown in Fig. 4 provide a clarification of the -band photometric behavior. The Dean minimum is very deep and observed in each band, from to , suggestive of a cooling of the envelope or/and an important optically thick ejection of material in the line of sight. The Otero minimum is less marked, but the imprint of the event can be seen in the , and bands as a sudden 0.2 mag decrease in magnitude. The Sterken minimum is only noticeable in the infrared by a small decrease in the flux (0.1mag) followed by a rapid return to the the previous level. We also note that the infrared data suggest at least one minimum in addition to the three described above 555There might be many much less striking peaks, but is impossible to localize them with this limited dataset. An important decrease of the near-IR fluxes appeared around JD2446500 (1986), an event (called ’near-IR minimum’ in Fig. 4) associated with a surprisingly weak V minimum.
A long-term evolution on the scale of several thousand days is observed. The decrease in the -band flux between 1980 and 2000 (see Figs. 3 and 4) is probably observed , and bands, more significant between 1990 and 2000, but the lack of observations between Sterken and Otero minima prevents a definite answer. An anticorrelation would suggest a varying column density of dust in the line-of-sight causing absorption in the band and excess emission in the band. The -band photometry exhibits smaller variations with rms of 0.1 mag compared to rms of 0.15 mag in and , and larger than 0.2 mag in the band.
Turning to the earliest data recorded between 1953 and 1966, we note that the rms of -band magnitudes reported in Table 4 is only 0.1 mag, as low as from Hipparcos. These two time intervals are relatively very quiet, unlike the current epoch when the source is more active (rms larger than 0.2 mag in the band).
4.2 Color analysis
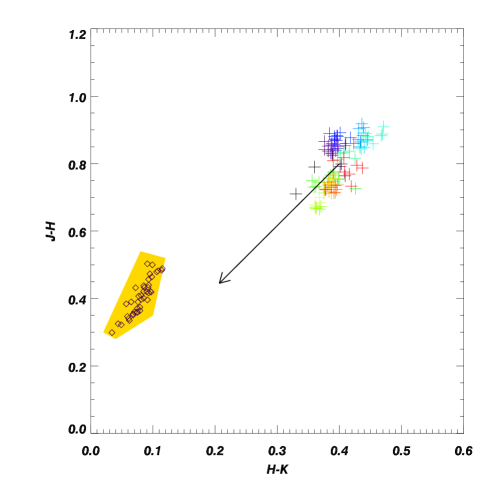
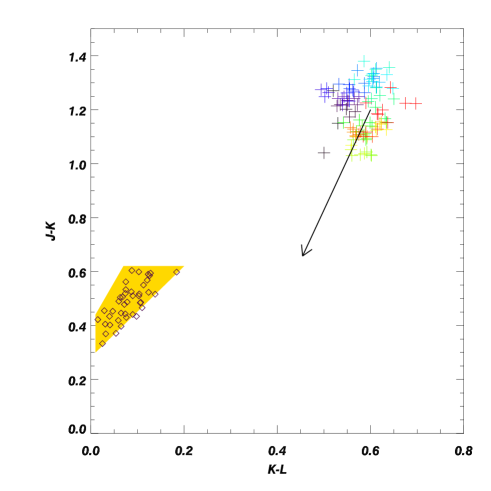
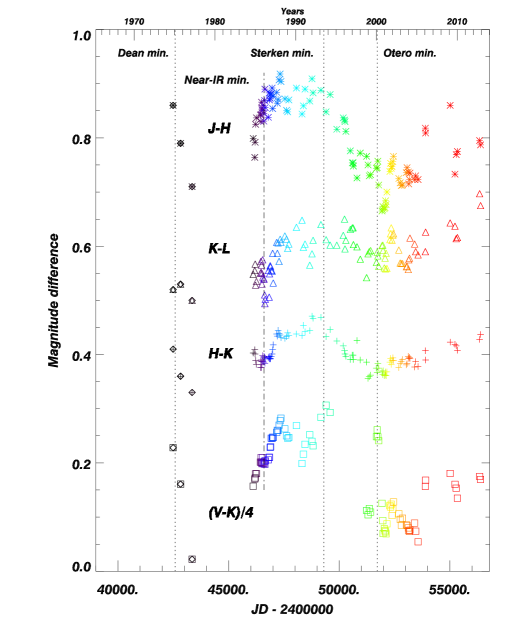
The time evolution of near-IR and visible colors indexes is shown in Fig.7. The near-IR colors were computed from the self-consistent SAAO dataset. The were computed by selecting several subsets of the visual and -band curves obtained at similar epochs and interpolating. The dataset is self consistent, mainly coming from the dataset reported in van Genderen (1992). We also constructed two near-IR color-color-diagrams, (H-K) versus (J-H) and (K-L) versus (J-K), that are shown in Fig. 17 and briefly discussed in Sect.D.
The mean color are =5.780.028 mag, =0.800.090 mag, =0.400.027 mag, and =0.590.039 mag. While the -band curve appears complex and seemingly erratic, the colors show a much more coherent behavior. One can see in Fig.7 that , , and vary with time in the same manner. The high rms for the curve probably reflects the importance of the screening by dusty material in the line of sight. The rms is minimal for and then increases for .
During the Dean minimum, all color indices were very red. Thereafter HR 5171 A became bluer until the high light maximum at JD2443300 (the , , , and are at that time the bluest of all data points, until now). Then between 1985-1993 the reddening increased, after which the color indices became bluer again following the Sterken mimimum and lasting until 2000. However, a causal connection between these two phenomena is uncertain. The Otero minimum seems to be followed by a period of decreased reddening lasting up to the present.
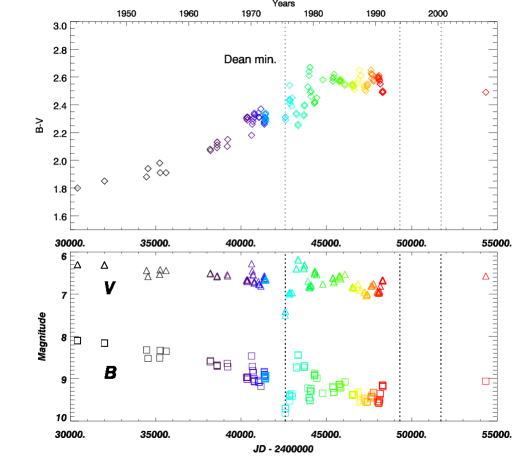
In this context, the presented in Fig.7 gives an important insight. The dataset covers more than 60 yr of data, and a roughly monotonic temporal evolution is observed that contrasts with the evolution of the other colors. The curve can be separated into two main periods: a gradual increase from 1942 to 1982 from 1.8 to 2.6, then an apparent stabilization, although measurements are unfortunately missing between 1990 and 2010. We also found in Fallon (1983) and in Jackson & Stoy (1958) two indices of 1.8 and 1.85 obtained in 1942.29 and 1946.5, respectively, which prolong the observed trend (diamonds in Fig. 7). The curve suggests a deep-seated phenomenon that can be interpreted in two ways: a spectral type change or a large variation in the circumstellar extinction. The curve can be compared with the one shown in Fig. 11 of Nieuwenhuijzen et al. (2012) which exhibits a similar change in the B-V for the YHG HR 8752 but in the opposite direction. This important evolution of is not accompanied by an increase in the -band magnitude as would be expected for increasing circumstellar extinction. Assuming the classical relationship between and with a factor R=3.1, a similar trend should be accompanied by a magnitude increase of at least 2.2 mag, which is not observed. It also appears that the 1942-1966 light and color curves are more stable than observed subsequently (see statistics in Table 4). The long-term trend of a increase stops apparently around 1982 and then stabilizes around =2.6 mag for at least 10 yr, and this is approximately the current value. Interestingly, the Dean minimum, which appeared as one of the key events of the past 40 yr, has a much lower impact on than the long-term trend. It reinforces our interpretation that the cause of the gradual evolution is related more to a gradual change in the underlying star than a variation in the reddening, even though it is certain that the circumstellar material also has strong effects on the color curves that cannot be ignored (see Sect. 5.3 and Sect. 6.2). Attributing the full amplitude of the phenomenon (i.e. =0.8 mag) to a spectral type change implies a significant change of spectral type, from G0/G2 to K1/K3. This information is very important in the context of the binary system evolution if one considers that such a large spectral type change implies an increase (nearly a doubling!) in the radius of the primary star (Nieuwenhuijzen, Van Genderen et al., in preparation). In this context, one can hypothesize that the relative stability of the -band magnitudes observed in the 1950s and 60s is a consequence of the smaller diameter of the primary, hence its lower sensitivity to the influence of the orbiting companion.
4.3 Detection of a periodic signal in the band and the radial velocities
We performed a Fourier analysis of the visual photometry aiming to detect a potential periodical signal. The different sets were analyzed separately with the Period04666 http://www.univie.ac.at/tops/Period04/ package (Lenz & Breger, 2005).
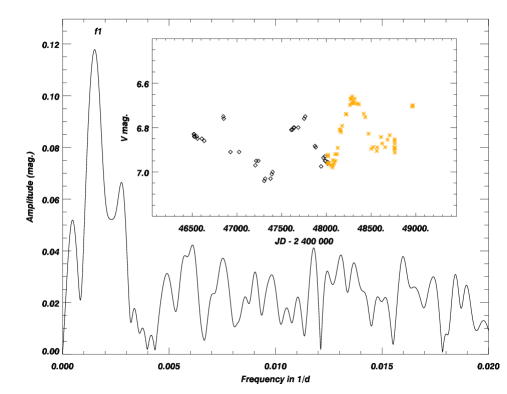
We first used data from the ‘quiet’ period ranging between 1985 and 1992, which have a good temporal coverage and are of good quality. A clear peak at a frequency of 0.001522d-1 (=657 d) was detected first in the Hipparcos dataset (see Fig.8) with an amplitude a=0.126 mag. For each detected frequency, the amplitude and the phase were calculated by a least-squares sine fit. We then enlarged the dataset to include the period of relatively quiet behavior between the Dean and the Sterken minima (i.e. JD 2443240-2448966). This analysis provides a peak at frequency 0.00152433d-1 determined with an accuracy of about 2% (corresponding to =65613d).
Photometry from recent years, including ASAS and Otero data, exhibits more active behavior compared to the Hipparcos dataset. The Fourier transform of the ASAS data yields a strong peak at f0.00038d-1 (P3300d, a=0.246 mag) that affects an accurate determination of the peaks that are present nearby. Three peaks are also identified at f=0.001542d-1 (a=0.074 mag), f=0.00102d-1 (a=0.0393 mag), and f=0.02751 (a=0.0372 mag). We imposed the f=0.0015d-1 frequency in these data set and fitted the residuals with a little series of sinusoids. Then we came back to the original observations and prewhitened them with these sinusoids. The residuals correspond to the cleaned observations. This prewhitening yields a specific peak around F0.0015d-1 with an amplitude of a=0.122 mag, similar to the one found in the 1985-1992 dataset.
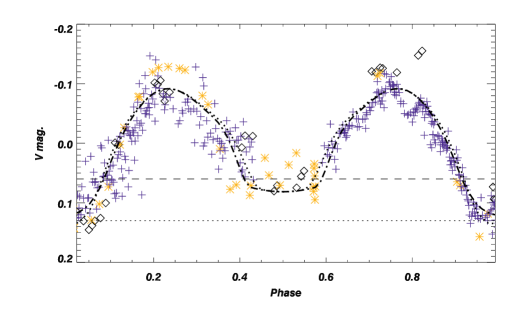
It was noticed that if the light curve is phased with the period, an important residual remains at the phases of observed lowest fluxes. This behavior is particularly clear in the Hipparcos dataset where the first dip appears lower than the second one. A careful inspection of the Fourier diagrams revealed a half frequency peak. Phasing the data with the frequency f=0.000761d-1 (=1314d) improves considerably the quality of the fit that exhibits a striking ’double-wave’ pattern showed in Fig.8. The phased light curve is reminiscent of an eclipsing system in contact or overcontact (Wilson, 1994), in line with the finding of the interferometric observations that the source is seen in front of the primary. In this case, it is expected that the strong peak detected (namely ) corresponds to half the orbital period Porb and hereafter we will consider that =Porb.
One may wonder whether the P1 period originates in a slow pulsation and not from the companion. In many pulsating stars, the amplitude of the pulsation depends on the wavelength. If the P1 period were associated to a pulsation we should detect this frequency dependence in our data. When the data are fully or partly analyzed, a frequency peak close to 0.0015 with an amplitude between 0.1 and 0.12 mag is systematically detected. As a test, such an analysis was performed on the data. While present in the and datasets, the 0.0015 frequency is missing in the color index data.
The 38 radial velocities published by Balona (1982) cover 1190 days. Structured variations that are significantly larger than the noise were observed, and the author reports the discovery of a strong peak at a period of 263.2 days (f=0.003799 d-1) from the dataset. We performed a Fourier analysis with Period04 that revealed the presence of two peaks of similar amplitudes at f=0.003789 d-1 and 0.001467 d-1, the latter one corresponding to a period P682 days, close to P1. Least squares fits gave K=3.87 and K=3.96 for the amplitudes of the two peaks, respectively, so our analysis suggests that a radial velocity signal with a period similar to the one inferred from the visual light curve. In any case, the radial velocities variations imply that the companion has a low mass compared to the primary or that the inclination of the system is very low, although the latter hypothesis is inconsistent with the detection of eclipses.
By comparing the date of the zero point of the radial velocities with the minimum of the Hipparcos light curve (JD=244733540), we improved the precision on the period slightly. We obtained a value P1=6523 d, corresponding to an orbital period Porb=13046d. It is worth noting that the peak corresponding to a period of 263d detected by Balona (1982) represents one fifth of Porb. In addition, van Genderen (1992) identified two periods in their photometric data: a 430d period during the relatively quiet epochs ranging from 1969 to 1972 (before the Dean minimum), and then a 494 d period afterward. These periods were obtained by identifying extrema in the complex and active light curves, and they are affected by uncertainties potentially as large as 30d. The harmonic at one third of Porb has a period of 435d.
The inferred ephemeris with Porb=13046d days is given by
.
The light curves covering six orbital periods were used to test the phasing of the variations. First, a secondary eclipse at phase =0.5, when the slightly hotter secondary is in front of the primary, occurred during the Hipparcos observations at JD=244802930. Second, the AMBER observations represent a reference point where the secondary is observed at the beginning or the end of the secondary eclipse, hence observed near phase 0.4 or 0.6 (see Fig. 8). Using this ephemeris, the AMBER observations were made at phase 0.630.04, i.e., at the end of the secondary eclipse. Third, we used the ephemeris to test and predict the latest maxima of the visual light curve. Some maxima were identified, but this technique remains highly uncertain since the light curve is currently severely affected by the activity of the primary.
4.4 Modeling of the light curve
From the phased light curve shown in Fig.8, one can infer that the distorted surface of the supergiant modulates the visible flux by 17 5%, and from the mid-period eclipse the contribution of the companion is estimated to be about 7 2% of the visible flux. This flux contrast is close to the one inferred in the near-IR by the AMBER/VLTI observation. The emissivity of the companion is greater than that of the primary, indicating a hotter star. Under the assumption that the emissive surfaces in the visible and near-IR are rather similar, this implies that the companion surface temperature is only hotter by 150-400K than the primary star’s temperature of 3500-4500K. We also note that the secondary eclipse, when the secondary passes in front, is long, about 0.15P0, implying a strong inclination for the system.
As a consistency check, we performed an independent analysis based solely on the phased light curve with the NIGHTFALL code777http://www.hs.uni-hamburg.de/DE/Ins/Per/Wichmann/Nightfall.html. This software (Wichmann, 2011) is based on a generalized Wilson-Devinney method assuming a standard Roche geometry. NIGHTFALL is based on a physical model that takes the non-spherical shape of stars in close binary systems into account, as well as mutual irradiance of both stars, and it can handle a wide range of configurations including overcontact systems. We performed a fit of the light curve by minimizing the free parameters and exploring the various solutions found. We first assumed a circular orbit and fixed the period to (i.e., 1333d). We then used various sets of initial parameters such as a strong inclination (from 45∘ up to 90∘), a total mass for the system ranging from 30 to 120 M⊙ and an identical initial temperature for the two stars of 4000K. Regardless of the total mass adopted, the results are very similar. The lower mass range is only compatible with large inclinations while a wider range of inclination accounts for the light curve with a mass around 120M⊙ . The full set of solutions favors a primary with a large radius (i.e. 1000R⊙ ) in contact or over-contact with the secondary, involving a filling factor ranging from 0.99 to 1.04. Two examples of good models are shown in Fig. 8 and their parameters are listed in Table 2. The inferred properties for the primary and secondary are fully consistent with the limits imposed by AMBER/VLTI measurements. The lower inclinations close to 45∘ yield mass ratios between 0.8 and 0.5 and a large temperature difference for the two components (Tsec/T). However, such models predict radial velocities for the primary larger than 20 which are not compatible with the observed range of variations, which is less than 10 Ḟurthermore, a long-duration secondary eclipse with a plateau is clearly observed in the phased curve, despite the limited S/N, favoring the interpretation with a large inclination. If one includes the constraint from the interferometric measurements that the secondary must have a radius at most one third of the primary, then a restricted range of parameters is found. A family of good models involves a high inclination (i60∘), a large mass ratio (12), and a low-temperature difference between the primary and the secondary (300K).
Improved constraints on the system parameters would require more complete radial velocity monitoring, and we advocate coupled interferometric and radial velocity monitoring in the future. The NIGHTFALL modeling of the phased visual light curve is consistent with the information provided by the interferometric observations, giving further confidence on the interpretation that the system is a contact or over-contact binary.
| Param. | Best 1 | Best 2 | min | max |
| i | 90 ∘ | 75 ∘ | 60 ∘ | 90 ∘ |
| Fil.Fac. | 1.03 | 0.99 | 0.98 | 1.04 |
| Mprim | 60M⊙ | 74M⊙ | 20M⊙ | 120M⊙ |
| 22. | 13. | 7 | 25 | |
| Msec | 3M⊙ | 6M⊙ | 2M⊙ | 15M⊙ |
| Sep2 | 2028 R⊙ | 2195 R⊙ | 1800 R⊙ | 2600 R⊙ |
| L12 | 1570 R⊙ | 1599 R⊙ | 1400 R⊙ | 1800 R⊙ |
| Prim. Mean radius | 1180 R⊙ | 1290 R⊙ | 1000 R⊙ | 1500 R⊙ |
| Sec. Mean radius | 312 R⊙ | 401 R⊙ | 200 R⊙ | 550 R⊙ |
| Tprim | 4717 K | 4927 K | 4400 K | 5200 K |
| Tsec/Tprim | 1.02 | 1.06 | 1.01 | 1.25 |
-
1
Separation of the components (circular orbit assumed).
-
2
Position of first Lagrangian point, from primary center
5 Spectral analysis

5.1 Spectral type
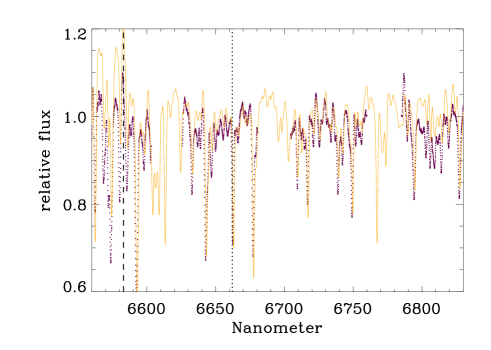
The determination of an accurate spectral type using photometric data for such a variable and reddened object is difficult. The first published spectral classification of HR 5171 A was reported by Humphreys et al. (1971) to be G8Ia+, but that was corrected by Keenan & Pitts (1980) to K0Ia+. The spectrum of HR 5171 A was extensively studied by Warren (1973), providing the first accurate determination of the effective temperature, Teff=4900K. None of the AAT and 2013 SAAO spectra mentioned above showed any TiO lines. The AAT spectra secured between 1992 and 1994 are nearly identical. A comparison with Kurucz models yields a best match with log() = 0 and Teff=5000 K for both spectra. The spectra were also compared to templates providing similar results. We include representative wavelength regions in Fig.9.
5.2 Rotational velocity
Thanks to the high spectral resolution of his spectra, Warren (1973) noticed that the lines are much broader (50-100 ) than in an ordinary supergiant (8 ). The stellar lines in the AAT spectra are obviously resolved well. A simple Gaussian fitting procedure performed on several lines including the Fe I lines around 600nm (such as 606.5nm) provides FWHM estimates of 499 .
However, hypergiant spectra exhibit broad absorption lines attributed to large scale turbulence motion that may reach supersonic velocities while the stellar rotational broadening is considered small (Lobel et al., 2003; de Jager, 1998). The discovery of a close-by companion raises a question about on whether the broadening in HR 5171 A has a rotational or turbulent origin.
We therefore performed a Fourier transform (FT) analysis, following standard techniques (Gray, 1992). This technique is considered a robust way to disentangle Doppler broadening from other sources. From this analysis, values of =5715 were estimated from these lines, the large error bar reflecting the rms of the measurements (the S/N of the AAT spectra is about 100). A value of 50 , interpreted as the Doppler velocity at the uniform disk radius inferred from the AMBER observations would imply a period of P/sin(i)=1326 days, in fair agreement with our detected period and derivation of a large inclination. The same technique applied to the Pucheros spectra at slightly lower resolution but higher S/N (200) provide less scattered results with a mean value of =404 . Nonetheless, Simón-Díaz et al. (2010) showed that the determination of the by the FT technique is subject to important biases when the macroturbulence is significantly greater than the . We used the unblended Fe I 557.2nm line as a good indicator of variable wind opacity to perform a comparison of the AAT spectrum of HR 5171 A with a spectrum from $ρ$ Cas and HR 8752. HR 5171 A appears as spectroscopically very similar to these other extreme stars, raising doubt about our analysis. It is therefore very difficult to infer this key quantity from spectroscopy alone. Important is that AMBER/VLTI is able to detect this rotation in the differential phases without being biased by the pulsation signal (Domiciano de Souza et al., 2004; Chelli & Petrov, 1995), provided that the source is larger than 20 - 30 (resolving power R = 12000).
5.3 Influence of the circumstellar environment
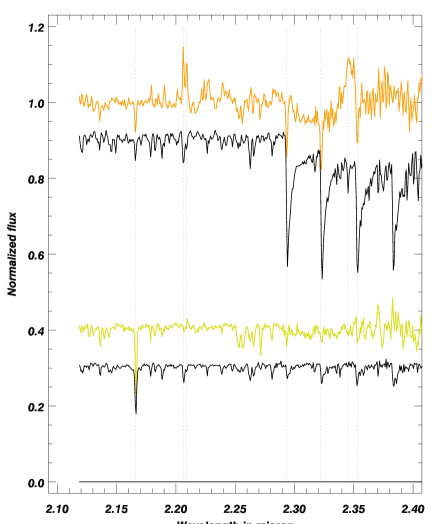
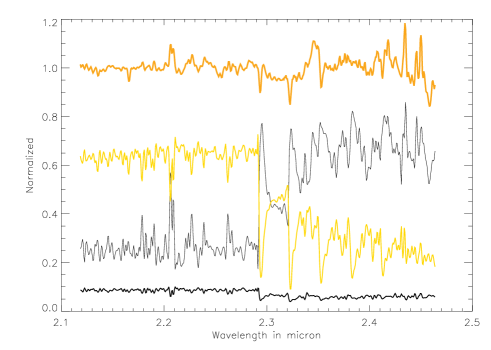
In the near-IR spectra shown in Fig. 2, one can note the similarity between the G0Ib near-IR template (HD 185018) and the AMBER spectrum of V382 Car, whereas we observe numerous differences between the G8Ib template (HD 208606) and HR 5171 A. The AMBER spectrum from HR 5171 A is characterized by a strong sodium line Na I 2.2 m in emission and narrow CO bandheads that are partly filled by emission. A similar NaI 2.2 m emission is also reported and discussed by Oudmaijer & de Wit (2013) on other YHGs, such as $ρ$ Cas (Gorlova et al., 2006) or IRC$+$10420 (Oudmaijer & de Wit, 2013). This line betrays the presence of an extended region where the continuum forms inside the dense wind from the YHG, which veils the hydrostatic photosphere and may explain the unusual reddening and surprising decoupling between the photometric and spectroscopic data.
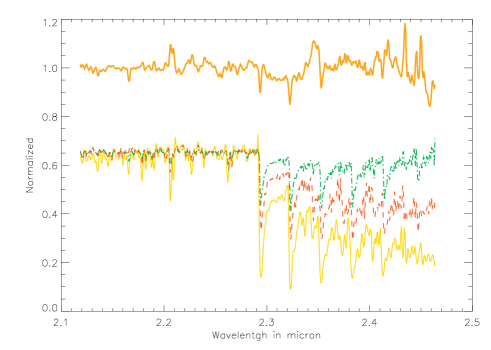
A UD is necessary to explain the zero visibility observed in the interferometric data that implies the presence of a sharp (photospheric) border, but the particular shape of the visibility curve also implies an extended and dense environment. This envelope is also indicated by the striking visibility signal observed in the CO lines and the NaI2.2 m doublet (Fig.15), whereas no signal is observed in the Br line. A comparison with the same data for V382 Car shows that all the lines from HR 5171 A observed in this spectral region form in an extended environment compared to the continuum, except for Br, which seems to be the only photospheric line in this spectral domain.The interferometric model presented in Sect.3 is the combination of an uniform disk, a Gaussian disk and an offset point source, whose sizes and positions were achromatically estimated in the fitting routine and whose relative fluxes are estimated for each spectral channel (see Sect. 3). These relative fluxes are shown in Fig. 10. The UD spectrum exhibits deep absorptions in the CO bands, increasing with wavelength more rapidly than in the spectrum of Betelgeuse, used as template. This suggests that the envelope renders any spectral classification dubious. The spectrum from the Gaussian is characterized by the same lines, now strongly in emission as may be expected from an extended envelope. It must be stressed that although qualitatively interesting, this approach can hardly provide robust quantitative information. The spectral separation procedure relies on an accurate knowledge of the flux-calibrated spectrum of the total source at that the time of the observations and the spatial distribution of the emission, implying a full spectrally dependent image reconstruction, such as performed only once on the case of the SgB[e] HD 62623 (Millour et al., 2011). The formation of CO bands emission is very complex, and certainly their study by the technique described here would imply a (time-consuming) dedicated imaging campaign.
We also found that the [N ii] 6548 and 6583 emission lines of HR 5171 A in the AAT-UCLES spectrum of 14 Jun 1994 are spatially extended. The spatial scale is 0.16 arcsec per spatial pixel, and the [N ii] 6548 line is detected up to three pixels (0.5”), while the [N ii] 6583 line is seen up to five pixels away from the continuum peak (0.8”). Extended [N ii] 6583 emission is also observed in HD 168625 and in HR 8752 (Lobel et al., 2013). It is interesting that both HR 8752 and HD 168625 are supergiant binaries. Interestingly, HD 168625 is also an LBV candidate with a triple ring nebula (Smith, 2007) resembling the one around SN 1987A.
To summarize, the interferometric data show that the extended envelope has a strong influence on the spectral appearance, complicating spectral classification. This envelope acts as a ‘pseudo-photosphere’ in the sense that it imprints a signature that may have strongly influenced the spectral diagnoses published so far.
6 Discussion
6.1 HR 5171 A: an over-contact interacting binary
The first surprise that came out of the AMBER/VLTI observations was the large angular diameter for such a distant source, which implied a radius of 1310260 R⊙ (6 AU). Recent models predict that the most extended red supergiants reach 1000-1500 R⊙ , and have initial masses not exceeding 20-25 M⊙ (Ekström et al., 2012), while the radius of a YSG is expected to be 400-700 R⊙ . HR 5171 A appears as extended as bright red supergiants (Arroyo-Torres et al., 2013), such as VY CMa (Wittkowski et al., 2012; Smith et al., 2001, 1420120R⊙ ) and has a radius 50% larger than the radius of Betelgeuse (Haubois et al., 2009, 88590R⊙ ). Such a large radius for a G8 YHG seems inconsistent with a single star evolution unless HR 5171 A just left the red supergiant stage.
The phased light curve and the subsequent NIGHTFALL modeling lead independently to a large diameter for the primary and secondary in the context of a contact or over-contact massive binary system. From Kepler’s third law and for a very-low mass companion of period 3.57 yr orbiting as close as 1.3 R∗, we infer the lowest current mass of the system to be 225 M⊙ . Taking into account the Nightfall modeling constraints on the separation of the components and the optical interferometry constraints on the primary apparent diameter (and their uncertainties), we estimated the total mass of the system to be M⊙ (at D=3.60.5kpc).
The long-term evolution of the curve that ended in the 80s suggests that contact may have happened relatively recently, coinciding with a period of increased activity. Such a large change in color suggests a dramatic change in spectral type in a few tens of years, which is not at odds with what is known already for these extreme objects (Nieuwenhuijzen et al., 2012; Klochkova et al., 1997; de Jager, 1998). Unfortunately, we have to rely on very few spectra for the spectral type characterization, covering three epochs 1971-1973, 1992-1994, and 2013. The (limited) analysis of the spectra shows that the spectral type and effective temperature inferred were relatively similar (a comparison is shown in Fig. 9). The spectral determination remains crude and largely complicated by the veiling issue. The analysis of the near-IR spatially resolved spectra from AMBER (Fig. 10) shows that the veiling is very strong. An alternative, intermediate scenario would imply a strong increase in the mass-loss rate, the creation of a relatively thin, extended gaseous envelope affecting the visual band only marginally, but strongly influencing the color index. We discuss this issue further in the following section.
6.2 Activity and mass loss
The photometric behavior of HR 5171 A is very similar to the activity of the archetypal YHG $ρ$ Cas (Gorlova et al., 2006; Lobel et al., 2003). The near-IR and visual light curves show long-term variations and shorter term minima. If one takes the Dean minimum as the starting point for this analysis, one can interpret the behavior of the photometric and color curves as an outburst that propelled part of the primary envelope into the circumbinary environment. The veiling lasted more than 20 years as seen by the decrease in the or curves until a new deep minimum was observed around 2000 (the Otero minimum) that apparently initiated a new cycle. The Otero minimum is nearly identical to the millennium outburst -minimum of $ρ$ Cas, interpreted by Lobel et al. (2003) as resulting from a shell ejection or outburst event after which the star continued with its usual pulsation variability. The gradual increase in the color index seems to be only slightly affected by the Dean minimum, suggesting that the star’s activity is a second-order perturbation. Unfortunately, some B band photometry is missing to probe the later stages (e.g., Otero minimum). What is the connection between the short-term deep minima and the near-IR colors? During the 1999-2000 outburst, the effective temperature of $ρ$ Cas apparently decreased by more than 3000 K and an increase of its mass-loss rate from 10-5 to M⊙ yr-1 was inferred (Lobel et al., 2003). The analysis of the SED suggests that a 800 K decrease can explain the differences observed between a minimum and the normal state. Intensive spectroscopic and interferometric monitoring would be needed during the next visual mimimum of HR 5171 A to better understand the mechanism of these mass-loss events.
The similarities of the photometric behavior and spectral appearance of HR 5171 A with other YHG suggest that its activity and mass-loss rate are due to the same process, namely the chaotic strong pulsations intimately related to the mean adiabatic index deep in the atmosphere. The key question related to the discovery of a low-mass companion is to determine its influence on the mass-loss process. Even a comparatively low-mass secondary can dramatically influence a massive — yet loosely bound and unstable — envelope through tides and atmospheric/wind friction. As the more massive star evolves and expands, the Roche lobe limits the size of the primary, and parts of the envelope become unbound in a process that is currently poorly known. In particular, it is by no means granted that this process is smooth and steady. The complex and variable light curve suggests large ejection events. The primary is forced to have a surface temperature set by the uncoupled core luminosity and the size of the Roche lobe. Binarity may therefore be a key component for other YHGs as well.
Even with the large dataset presented here, the issue of the rotation of the primary is far from trivial. We first suspected evidence of significant rotation from the large widths of lines in the spectrum, but a comparison to other YHGs suggests that the large turbulence for these exceptional sources can easily hide a relatively large (e.g. 10-30 ) . We note also that the presence of the companion is not accompanied by detectable X-ray emission (see Sect.C). Does this imply that the mass-transfer process is relatively smooth and the X-rays cannot emerge from the dense envelope? These observations are correlated to the lack of any emission in the optical and near-IR from hydrogen recombination lines.
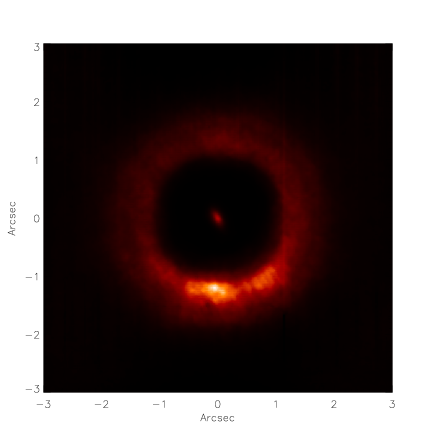
Recent NICI/Gemini-South coronagraphic images obtained in the near-IR reveal a faint extended nebula with a radius out to 1.8”(Rsh=6500 AU at D=3.6kpc) around the system (Fig. 11). This implies that a significant amount of mass has been lost during past centuries. Using HST, Schuster et al. (2006) report a lack of diffuse emission in the range 0.9-1.4”down to very low levels (5-7.5 mag). Using the assumptions in Fig. 4 of their paper, we infer a dynamical time for these radii in the range 300-1000 yr (corresponding to expansion velocities of 100 and 35 , respectively). This observation is in line with the estimates from early studies from Apruzese (1975) based on the first mid-IR observations of this source. A model involving a shell at 100 R∗ was considered as not tenable for explaining the IR flux observed at 25-60 micron, and a 1000 R∗ shell was preferred by the authors. At the distance =3.6kpc, this would represent a shell of 1.4”radius, in agreement with the more extended [Fe ii] emission seen in the Gemini/NICI images. Does the presence of the companion imply a long-term cycle with periods of activity and a high mass-loss rate followed by quiescent periods lasting a few tens of years, during which time the diameter of the primary is decreased and the mass-loss rate is much lower?
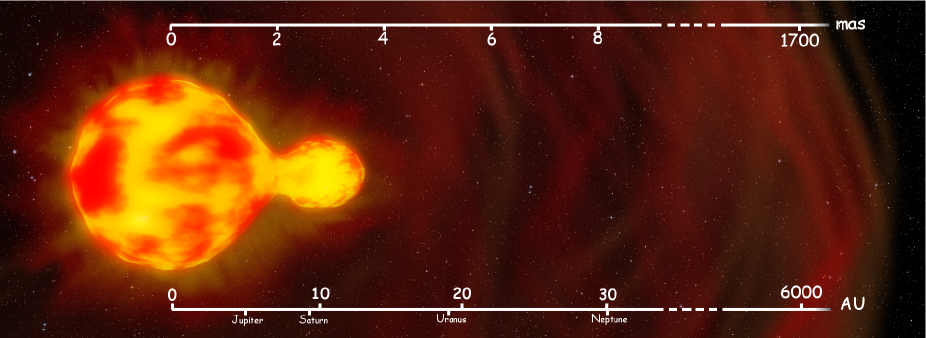
In Fig. 12, we present a sketch that summarizes our view of HR 5171 A following our best constraints on the system. The system is presented at maximum elongation for the sake of clarity, and observations at these particular orbital phases are needed to have the best view of the contact between the two components of the system.
6.3 Hypergiants and binarity
Mounting evidence indicates that binarity has a decisive effect on the fates of massive stars and, in particular, on their rotation rate (de Mink et al., 2013; Sana et al., 2012; Kochanek, 2009). Binary mass transfer via Roche lobe overflow (RLOF) has long been considered a key channel for producing stripped-envelope Wolf-Rayet stars, and the statistics of supernovae sub-types confirm the importance of the binary channel in producing stripped-envelope supernovae (Smith et al., 2011b). Similar conclusions are reached through the modeling of the light curves and spectra of SNe IIb, Ib, and Ic (Dessart et al., 2012, 2011; Ensman & Woosley, 1988). Despite the crucial influence of strong binary interaction in the late evolution of massive stars, very few examples of the phenomenon have been identified, and this system is, to our knowledge, unique. Since the mass transfer phase of massive binaries is very brief (104 yr or so), these systems caught in that phase are extremely rare and each one of them is very valuable for studying the physics of the process.
Considering the current parameters for the HR 5171 A system compared to binary evolution models suggests the following scenario. During the main sequence, HR 5171 A was a detached binary system. When the most massive star became a YHG, with a bloated and intrinsically unstable envelope, the separation was still too large for the two components to merge or to exchange a large amount of mass. The primary envelope is now quite cool and large, possibly under the decisive influence of the companion. The convective layers span most of the star’s radius, and assuming convective motions at 10-20 , some material can reach the interior regions in 2-3 yr, which is a time shorter than the orbital period. The Kelvin-Helmholtz time for these stellar envelopes is comparatively short, a few tens of years. Can the convective envelope efficiently transfer the incoming angular momentum from the secondary deep into the primary star’s interior? What is the competing influence of angular momentum loss due to the mass lost by the system? YHGs are extremely unstable and their observations show that a large pulsationnal activity can explain their high mass-loss rate even without invoking the influence of a companion.
The system is probably undergoing Wind Roche-Lobe Overflow (Abate et al., 2013, WRLOF), i.e., the primary under-fills its Roche lobe, but a significant fraction of its wind fills it up and is gravitationally channeled to the secondary. This process is by nature non-conservative; i.e., a lot of mass is lost in the process. Since the primary is close to Roche-lobe filling, its spin should be tidally synchronized with the orbit rotation (Langer, private communication), but an accurate measurement of the rotation of the primary is pending.
The fate of the system depends on the orbital evolution. At present, the orbit could shrink (if some mass flows onto the secondary) or widen (due to the mass lost by the system). If it shrinks, the system could still develop into dynamical common envelope interaction, and the binary could evolve into a short-period WR+x system, where x is either a main sequence stars or a compact star. As such, it would have a small chance of forming a long-duration gamma-ray burst (Detmers et al., 2008). If the orbit widens, it would remain a long period system (Langer, private communication). If the common envelope is avoided but a significant amount of angular momentum transferred, then the primary star could evolve to the blue and become an LBV spinning close to the critical speed. This provides a possible way for fast-rotating LBVs such as AG Carinae (Groh et al., 2009b) and HR Carinae (Groh et al., 2009a) to come from binary evolution. Martayan et al. (2012) review the binarity of LBV stars, noting that three of them are in close binaries, including the famous Car. A circumbinary disk may also be in formation currently and one can wonder whether HR 5171 A may evolve to become a rapidly rotating B[e] star. The B[e] phenomenon is characterized by a B-type central star surrounded by a disk at the origin of the large infrared excess and the forbidden lines observed. This broad definition leads to a heterogeneous group (Lamers et al., 1998), but despite this, there is a growing amount of evidence that the evolved supergiants stars exhibiting the B[e] phenomenon (named SgB[e]) are most probably binaries having recently experienced mass-exchange (Millour et al., 2013; 2013arXiv1305.0459C; Kraus et al., 2013; Wang et al., 2012; Kraus et al., 2012; Wheelwright et al., 2012; Millour et al., 2009). As an example, HD 62623 is an interacting binary harboring an AIab[e] supergiant and a less massive star (20) orbiting very close in a 150d period. The interaction is at the origin of the fast rotation of the primary, with a circumbinary disk of plasma (Millour et al., 2011) surrounded at larger scales by a dense dusty disk (Meilland et al., 2010).
Only a few other interacting systems are known and for those the interaction occurs at much closer separation and the period is much shorter. Recently, a unique system harboring two YSGs was detected in a variability survey of M81. Prieto et al. (2008) discovered it to be an over-contact binary composed of two YSG orbiting with a period of P=271d, and they also noticed such a system in the SMC with F0 supergiants in period P=181d. The most studied massive system experiencing RLOF is RY Scuti (Smith et al., 2011a), but this interaction occurred at a much earlier phase of the binary system’s evolution since the period is only 11 days, and the primary is still in a blue supergiant phase. A key difference between these sources is that the envelope of HR 5171 A is convective. For RY Scuti the RLOF induces wind focusing and short mass-transfer events that form a dense disk around the mass gainer (Grundstrom et al., 2007, see their Fig. 10). HR 5171 A is to our knowledge the first system caught in this stage to have a resolved common envelope. Interestingly, the strong infrared silicate emission feature in HR 5171A is most similar to that seen in RY Scuti (Grasdalen et al., 1979).
It is possible that some of the other famous and unstable yellow hypergiants are experiencing (or have experienced) a similar binary interaction. IRC+10420 is a yellow hypergiant assumed to be in a post-red supergiant stage owing to its large-scale cool envelope, and the star has a current radius estimated to about 1/3 that of HR 5171 A. The environment around IRC+10420 is also known to be dusty and bipolar, with significant equatorial material (Oudmaijer & de Wit, 2013; Tiffany et al., 2010). The low inclination configuration significantly reduces the chances of detecting a faint periodic signal in the radial velocity or light curves or to detect rapid rotation. The influence of a putative companion can only be inferred by careful monitoring via optical interferometry that we advocate for the few objects of this extreme class. The yellow hypergiant HR 8752, whose appearance is very similar to those of HR 5171 A is also known to have a hot companion (Nieuwenhuijzen et al., 2012; Stickland & Harmer, 1978). No periodic radial signature has been reported and the companion’s influence may have been overlooked. The newly discovered Yellow Hypergiant Hen 3-1379 (IRAS 17163-3907) created two large shells, apparently circular (Hutsemékers et al., 2013; Lagadec et al., 2011). There is no direct nor indirect evidence of binarity for this poorly studied source, but this hypothesis deserves to be carefully checked by high contrast and high angular resolution observations.
7 Conclusions
Using the AMBER/VLTI observations of the YSG V382 Car as a reference star, we showed that the YHG HR 5171 A has a very extended photosphere of 1315260R⊙ (at the distance of 3.60.5pc) surrounded by a diffuse environment. A companion was discovered as a bright spot in front of the primary disk. Analysis of the visual band light curve confirmed the eclipsing-binary nature of the system, with a detected orbital period of of 13046days.
HR 5171 A is an important system caught in the act of mass transfer and envelope-stripping. In this particular case, the system is close enough to us that it can be resolved from ground-based optical interferometry.
This system is undoubtedly very interesting and should be investigated in more detail. Analysis of the curve suggests that the system began to interact strongly in the 1980s, following a large increase in the primary radius. The mass of the system is high with some uncertainties related to the exceptional configuration of the system with such a large primary star. Some time will be needed to infer the orbit from radial velocities coupled to optical interferometric monitoring. The envelope around the source has a complex shape, and the interferometric imaging of such a complex target is best performed with a four-telescope recombiner such as PIONIER/VLTI. We also aim to better constrain the angular momentum stored in the primary’s extended envelope by better estimating the of the source. It is extremely difficult to infer this information from spectroscopy alone, whereas unambiguous information can be obtained using an interferometer with high spectral resolution capabilities. AMBER/VLTI is the only instrument of this kind in the southern hemisphere.
Another point that was not studied here is the spatial appearance of the source in the mid-IR. This wavelength range is of some importance for determining whether part of the material lost by the system settles in a circumbinary disk. The MIDI/VLTI instrument is almost decommissioned, but the second-generation instrument MATISSE/VLTI (Lopez et al., 2008), currently in construction phase, will be perfectly suited to this task.
Some important questions were raised in this study. Can we observe the long-term evolution of the diameter of YHGs that are ’bouncing against the cool border of the Yellow Hypergiant Void’ while they are believed to evolve on a blue loop in the upper H-R diagram? By what factor does the diameter of a YHG increase during an short-term outburst? Is it related to the existence of a time-dependent pseudo-photosphere? Interferometry is bringing a new window for the temporal monitoring of such stars. Similar monitoring has recently been undertaken in the northern hemisphere with the VEGA/CHARA visible recombiner (Mourard et al., 2009), complementing the VLTI capability.
Acknowledgements.
We thank the ESO staff at Garching, Santiago de Chile, and Cerro Paranal (Chile), for operating the VLTI. We also thank N. Langer, S. de Mink, O. Absil, J.-Ph. Berger, D. Bonneau, J-L Halbwachs, A. Jorissen, J-B. LeBouquin, T. Lanz, C. Martayan, F. Martin, H. Nieuwenhuijzen and F. Vakili for fruitful discussions. We thank the observers of the LTPV group: A. Schoenmakers, J. van Loon, A. Jorissen, O. Stahl, S. de Koff, and E. Waelde. J. Manfroid and C. Sterken were responsible for the excellent reduction programs. M. Feast and P. Whitelock are grateful to the National Research Foundation of South Africa for their research grants. We would like to thank the following people for contributing infrared observations of HR5171: Robin Catchpole, Ian Glass, David Laney, Tom Lloyd Evans, Greg Roberts, Bruce Robertson, Jonathan Spencer-Jones, Francois van Wyk, and particularly Fred Marang. A. van Genderen is grateful to F. van Leeuwen for many fruitful discussions on the Hipparcos observations of HR5171A, and to E.H. Olsen for bringing very useful information on the photometric system. S. Kanaan and M. Curé acknowledges the support of GEMINI-CONICYT project N 32090006, CONICYT-FONDECYT project N 3120037, CONICYT Capital Humano Avanzado project N 7912010046 and centro de astrof sica de Valpara so. LV acknowledges the support of Fondecyt N 1130849. SK and LV tanks the PURE team composed from N. Espinoza, R. Brahm, and A. Jordan. YN thanks the FNRS and Prodex Integral/XMM contracts. This research made use of the Jean-Marie Mariotti Center SearchCal and LITpro services 888Available at http://www.jmmc.fr codeveloped by LAGRANGE and LAOG/IPAG, and of the CDS Astronomical Databases SIMBAD and VIZIER 999Available at http://cdsweb.u-strasbg.fr/. We acknowledge with thanks the variable star observations from the AAVSO International Database contributed by observers worldwide and used in this research. We thank an anonymous referee for pertinent suggestions that improved the readability of this paper.References
- Abate et al. (2013) Abate, C., Pols, O. R., Izzard, R. G., Mohamed, S. S., & de Mink, S. E. 2013, A&A, 552, A26
- Apruzese (1975) Apruzese, J. P. 1975, ApJ, 196, 761
- Arroyo-Torres et al. (2013) Arroyo-Torres, B., Wittkowski, M., Marcaide, J. M., & Hauschildt, P. H. 2013, A&A, 554, A76
- Balona (1982) Balona, L. A. 1982, MNRAS, 201, 105
- Bonneau et al. (2006) Bonneau, D., Clausse, J.-M., Delfosse, X., et al. 2006, A&A, 456, 789
- Cannon (1936) Cannon, A. J. 1936, Annals of Harvard College Observatory, 100, 1
- Carter (1990) Carter, B. S. 1990, MNRAS, 242, 1
- Chelli & Petrov (1995) Chelli, A. & Petrov, R. G. 1995, A&AS, 109, 389
- Chelli et al. (2009) Chelli, A., Utrera, O. H., & Duvert, G. 2009, A&A, 502, 705
- Chun et al. (2008) Chun, M., Toomey, D., Wahhaj, Z., et al. 2008, in Society of Photo-Optical Instrumentation Engineers (SPIE) Conference Series, Vol. 7015, Society of Photo-Optical Instrumentation Engineers (SPIE) Conference Series
- Cutri & et al. (2012) Cutri, R. M. & et al. 2012, VizieR Online Data Catalog, 2311, 0
- de Jager (1998) de Jager, C. 1998, A&A Rev., 8, 145
- de Mink et al. (2013) de Mink, S. E., Langer, N., Izzard, R. G., Sana, H., & de Koter, A. 2013, ApJ, 764, 166
- Dean (1980) Dean, J. F. 1980, Information Bulletin on Variable Stars, 1796, 1
- Dessart et al. (2012) Dessart, L., Hillier, D. J., Li, C., & Woosley, S. 2012, MNRAS, 424, 2139
- Dessart et al. (2011) Dessart, L., Hillier, D. J., Livne, E., et al. 2011, MNRAS, 414, 2985
- Detmers et al. (2008) Detmers, R. G., Langer, N., Podsiadlowski, P., & Izzard, R. G. 2008, A&A, 484, 831
- Domiciano de Souza et al. (2004) Domiciano de Souza, A., Zorec, J., Jankov, S., et al. 2004, A&A, 418, 781
- Driebe et al. (2009) Driebe, T., Groh, J. H., Hofmann, K.-H., et al. 2009, A&A, 507, 301
- Drout et al. (2012) Drout, M. R., Massey, P., & Meynet, G. 2012, ApJ, 750, 97
- Egan et al. (2003) Egan, M. P., Price, S. D., Kraemer, K. E., et al. 2003, VizieR Online Data Catalog, 5114, 0
- Ekström et al. (2012) Ekström, S., Georgy, C., Eggenberger, P., et al. 2012, A&A, 537, A146
- Ensman & Woosley (1988) Ensman, L. M. & Woosley, S. E. 1988, ApJ, 333, 754
- Fallon (1983) Fallon, F. W. 1983, Transactions of the Astronomical Observatory of Yale University, 32, 1
- Gorlova et al. (2006) Gorlova, N., Lobel, A., Burgasser, A. J., et al. 2006, ApJ, 651, 1130
- Gould (1879) Gould, B. A. 1879, Resultados del Observatorio Nacional Argentino, 1
- Grasdalen et al. (1979) Grasdalen, G. L., Hackwell, J. A., Gehrz, R. D., & McClain, D. 1979, ApJ, 234, L129
- Gray (1992) Gray, D. F. 1992, The observation and analysis of stellar photospheres.
- Groh et al. (2009a) Groh, J. H., Damineli, A., Hillier, D. J., et al. 2009a, ApJ, 705, L25
- Groh et al. (2009b) Groh, J. H., Hillier, D. J., Damineli, A., et al. 2009b, ApJ, 698, 1698
- Grundstrom et al. (2007) Grundstrom, E. D., Gies, D. R., Hillwig, T. C., et al. 2007, ApJ, 667, 505
- Harvey (1972) Harvey, G. M. 1972, Monthly Notes of the Astronomical Society of South Africa, 31, 81
- Haubois et al. (2009) Haubois, X., Perrin, G., Lacour, S., et al. 2009, A&A, 508, 923
- Humphreys et al. (1971) Humphreys, R. M., Strecker, D. W., & Ney, E. P. 1971, ApJ, 167, L35
- Hutsemékers et al. (2013) Hutsemékers, D., Cox, N. L. J., & Vamvatira-Nakou, C. 2013, A&A, 552, L6
- Ishihara et al. (2010) Ishihara, D., Onaka, T., Kataza, H., et al. 2010, A&A, 514, A1
- Jackson & Stoy (1958) Jackson, J. & Stoy, R. H. 1958, Annals of the Cape Observatory, 20, 0
- Karr et al. (2009) Karr, J. L., Manoj, P., & Ohashi, N. 2009, ApJ, 697, 133
- Keenan & Pitts (1980) Keenan, P. C. & Pitts, R. E. 1980, ApJS, 42, 541
- Klochkova et al. (1997) Klochkova, V. G., Chentsov, E. L., & Panchuk, V. E. 1997, MNRAS, 292, 19
- Kochanek (2009) Kochanek, C. S. 2009, ApJ, 707, 1578
- Kraus et al. (2013) Kraus, M., Oksala, M. E., Nickeler, D. H., et al. 2013, A&A, 549, A28
- Kraus et al. (2012) Kraus, S., Calvet, N., Hartmann, L., et al. 2012, ApJ, 746, L2
- Lagadec et al. (2011) Lagadec, E., Zijlstra, A. A., Oudmaijer, R. D., et al. 2011, A&A, 534, L10
- Lamers et al. (1998) Lamers, H. J. G. L. M., Zickgraf, F.-J., de Winter, D., Houziaux, L., & Zorec, J. 1998, A&A, 340, 117
- Laney & Stobie (1992) Laney, C. D. & Stobie, R. S. 1992, in Astronomical Society of the Pacific Conference Series, Vol. 30, Variable Stars and Galaxies, in honor of M. W. Feast on his retirement, ed. B. Warner, 119
- Laney & Stobie (1993) Laney, C. D. & Stobie, R. S. 1993, MNRAS, 263, 921
- Lenz & Breger (2005) Lenz, P. & Breger, M. 2005, Communications in Asteroseismology, 146, 53
- Lobel (2001) Lobel, A. 2001, ApJ, 558, 780
- Lobel et al. (2013) Lobel, A., de Jager, K., & Nieuwenhuijzen, H. 2013, in Astronomical Society of the Pacific Conference Series, Vol. 470, Astronomical Society of the Pacific Conference Series, ed. G. Pugliese, A. de Koter, & M. Wijburg, 167
- Lobel et al. (2003) Lobel, A., Dupree, A. K., Stefanik, R. P., et al. 2003, ApJ, 583, 923
- Lopez et al. (2008) Lopez, B., Antonelli, P., Wolf, S., et al. 2008, in Society of Photo-Optical Instrumentation Engineers (SPIE) Conference Series, Vol. 7013, Society of Photo-Optical Instrumentation Engineers (SPIE) Conference Series
- Manfroid et al. (1991) Manfroid, J., Sterken, C., Bruch, A., et al. 1991, A&AS, 87, 481
- Martayan et al. (2012) Martayan, C., Lobel, A., Baade, D., et al. 2012, in Astronomical Society of the Pacific Conference Series, Vol. 464, Circumstellar Dynamics at High Resolution, ed. A. C. Carciofi & T. Rivinius, 293
- Meilland et al. (2010) Meilland, A., Kanaan, S., Borges Fernandes, M., et al. 2010, A&A, 512, A73
- Millour et al. (2009) Millour, F., Chesneau, O., Borges Fernandes, M., et al. 2009, A&A, 507, 317
- Millour et al. (2011) Millour, F., Meilland, A., Chesneau, O., et al. 2011, A&A, 526, A107
- Millour et al. (2013) Millour, F., Meilland, A., Stee, P., & Chesneau, O. 2013, in Lecture Notes in Physics, Berlin Springer Verlag, Vol. 857, Lecture Notes in Physics, Berlin Springer Verlag, ed. J.-P. Rozelot & C. . Neiner, 149
- Millour et al. (2008) Millour, F., Valat, B., Petrov, R. G., & Vannier, M. 2008, in Society of Photo-Optical Instrumentation Engineers (SPIE) Conference Series, Vol. 7013, Society of Photo-Optical Instrumentation Engineers (SPIE) Conference Series
- Mourard et al. (2009) Mourard, D., Clausse, J. M., Marcotto, A., et al. 2009, A&A, 508, 1073
- Nazé (2009) Nazé, Y. 2009, A&A, 506, 1055
- Nazé et al. (2012) Nazé, Y., Rauw, G., & Hutsemékers, D. 2012, A&A, 538, A47
- Neugent et al. (2012) Neugent, K. F., Massey, P., Skiff, B., & Meynet, G. 2012, ApJ, 749, 177
- Nieuwenhuijzen & de Jager (1995) Nieuwenhuijzen, H. & de Jager, C. 1995, A&A, 302, 811
- Nieuwenhuijzen et al. (2012) Nieuwenhuijzen, H., De Jager, C., Kolka, I., et al. 2012, A&A, 546, A105
- Odenwald (1986) Odenwald, S. F. 1986, ApJ, 307, 711
- Oskinova et al. (2003) Oskinova, L. M., Ignace, R., Hamann, W.-R., Pollock, A. M. T., & Brown, J. C. 2003, A&A, 402, 755
- Oudmaijer et al. (2009) Oudmaijer, R. D., Davies, B., de Wit, W.-J., & Patel, M. 2009, in Astronomical Society of the Pacific Conference Series, Vol. 412, The Biggest, Baddest, Coolest Stars, ed. D. G. Luttermoser, B. J. Smith, & R. E. Stencel, 17
- Oudmaijer & de Wit (2013) Oudmaijer, R. D. & de Wit, W. J. 2013, A&A, 551, A69
- Oudmaijer et al. (1996) Oudmaijer, R. D., Groenewegen, M. A. T., Matthews, H. E., Blommaert, J. A. D. L., & Sahu, K. C. 1996, MNRAS, 280, 1062
- Petrov et al. (2007) Petrov, R. G., Malbet, F., Weigelt, G., et al. 2007, A&A, 464, 1
- Pojmanski (2002) Pojmanski, G. 2002, Acta Astron., 52, 397
- Prieto et al. (2008) Prieto, J. L., Stanek, K. Z., Kochanek, C. S., et al. 2008, ApJ, 673, L59
- Rayner et al. (2009) Rayner, J. T., Cushing, M. C., & Vacca, W. D. 2009, ApJS, 185, 289
- Sana et al. (2012) Sana, H., de Mink, S. E., de Koter, A., et al. 2012, Science, 337, 444
- Schuster (2007) Schuster, M. T. 2007, PhD thesis, University of Minnesota
- Schuster et al. (2006) Schuster, M. T., Humphreys, R. M., & Marengo, M. 2006, AJ, 131, 603
- Simón-Díaz et al. (2010) Simón-Díaz, S., Herrero, A., Uytterhoeven, K., et al. 2010, ApJ, 720, L174
- Smith (2007) Smith, N. 2007, AJ, 133, 1034
- Smith et al. (2011a) Smith, N., Gehrz, R. D., Campbell, R., et al. 2011a, MNRAS, 418, 1959
- Smith et al. (2001) Smith, N., Humphreys, R. M., Davidson, K., et al. 2001, AJ, 121, 1111
- Smith et al. (2011b) Smith, N., Li, W., Filippenko, A. V., & Chornock, R. 2011b, MNRAS, 412, 1522
- Smith et al. (2004) Smith, N., Vink, J. S., & de Koter, A. 2004, ApJ, 615, 475
- Sterken (1983) Sterken, C. 1983, The Messenger, 33, 10
- Sterken et al. (1993) Sterken, C., Manfroid, J., Anton, K., et al. 1993, A&AS, 102, 79
- Stickland (1985) Stickland, D. J. 1985, The Observatory, 105, 229
- Stickland & Harmer (1978) Stickland, D. J. & Harmer, D. L. 1978, A&A, 70, L53
- Stothers (2012) Stothers, R. B. 2012, ApJ, 751, 151
- Tatulli et al. (2007) Tatulli, E., Millour, F., Chelli, A., et al. 2007, A&A, 464, 29
- Thome (1932) Thome, J. M. 1932, Cordoba Durchmusterung. Brightness and position of every fixed star down to the 10. magnitude comprised in the belt of the heavens between 22 and 90 degrees of southern declination - Vol.21 A: -52 deg. to -62 deg. - Vol.21 B: -62 deg. to -90 deg.
- Tiffany et al. (2010) Tiffany, C., Humphreys, R. M., Jones, T. J., & Davidson, K. 2010, AJ, 140, 339
- van Genderen (1992) van Genderen, A. M. 1992, A&A, 257, 177
- van Leeuwen et al. (1998) van Leeuwen, F., van Genderen, A. M., & Zegelaar, I. 1998, A&AS, 128, 117
- Vanzi et al. (2012) Vanzi, L., Chacon, J., Helminiak, K. G., et al. 2012, MNRAS, 424, 2770
- Wang et al. (2012) Wang, Y., Weigelt, G., Kreplin, A., et al. 2012, A&A, 545, L10
- Warren (1973) Warren, P. R. 1973, MNRAS, 161, 427
- Wheelwright et al. (2012) Wheelwright, H. E., de Wit, W. J., Weigelt, G., Oudmaijer, R. D., & Ilee, J. D. 2012, A&A, 543, A77
- Wichmann (2011) Wichmann, R. 2011, Nightfall: Animated Views of Eclipsing Binary Stars, astrophysics Source Code Library
- Wilson (1994) Wilson, R. E. 1994, PASP, 106, 921
- Wittkowski et al. (2012) Wittkowski, M., Hauschildt, P. H., Arroyo-Torres, B., & Marcaide, J. M. 2012, A&A, 540, L12
- Yamamura et al. (2010) Yamamura, I., Makiuti, S., Ikeda, N., et al. 2010, VizieR Online Data Catalog, 2298, 0
Appendix A Observation logs
| Observation | Projected baseline1 | Mode | DIT2 | CT3 | Seeing | Object | |||
|---|---|---|---|---|---|---|---|---|---|
| Date | Time | Triplet | B(m) | P.A. (o) | (s) | (ms) | (”) | ||
| 2012-03-08 | 03:03:47 | K0-A1-G1 | 128.7/73.9/81.7 | -132.1/84.0/-164.4 | LR-K-F4 | 0.05 | 4.5 | 1.37 | V382 Car |
| 2012-03-08 | 04:10:17 | K0-A1-G1 | 129.0/67.7/80.3 | -152.0/60.4/-178.8 | LR-K-F | 0.05 | 6.6 | 0.90 | HR 5171 |
| 2012-03-08 | 04:52:51 | K0-A1-G1 | 124.2/79.1/77.4 | -109.8/107.2/-147.8 | LR-K-F | 0.05 | 9.6 | 1.00 | V382 Car |
| 2012-03-08 | 05:31:29 | K0-A1-G1 | 128.4/73.4/79.4 | -134.1/80.2/-165.6 | LR-K-F | 0.05 | 9.5 | 1.01 | HR 5171 |
| 2012-03-08 | 06:58:20 | I1-A1-G1 | 99.9/79.7/35.6 | -64.8/134.1/-111.1 | LR-K-F | 0.05 | 16.5 | 0.85 | V382 Car |
| 2012-03-08 | 07:46:53 | I1-A1-G1 | 106.0/79.2/40.2 | -88.8/110.1/-128.3 | LR-K-F | 0.05 | 17.2 | 1.02 | HR 5171 |
| 2012-03-08 | 08:34:07 | I1-A1-G1 | 92.0/78.1/28.4 | -40.3/156.6/-93.0 | LR-K-F | 0.05 | 17.0 | 0.80 | V382 Car |
| 2012-03-08 | 09:20:49 | I1-A1-G1 | 101.9/80.0/35.8 | -67.3/130.7/-111.2 | LR-K-F | 0.05 | 22.1 | 0.99 | HR 5171 |
| 2012-03-09 | 05:05:13 | I1-A1-G1 | 105.9/79.5/41.1 | -89.1/110.6/-129.8 | MR-K-F | 1.00 | 7.8 | 0.72 | V382 Car |
| 2012-03-09 | 05:28:39 | I1-A1-G1 | 105.7/73.6/43.6 | -118.5/80.8/-152.4 | MR-K-F | 1.00 | 6.4 | 0.81 | HR 5171 |
| 2012-03-09 | 06:11:02 | I1-A1-G1 | 102.7/80.0/37.9 | -73.9/125.3/-118.0 | MR-K-F | 1.00 | 7.1 | 0.67 | V382 Car |
| 2012-03-09 | 06:38:46 | I1-A1-G1 | 106.7/77.2/42.2 | -103.0/96.2/-139.9 | MR-K-F | 1.00 | 6.9 | 0.69 | HR 5171 |
| 2012-03-09 | 07:27:36 | I1-A1-G1 | 97.3/79.2/33.3 | -56.7/141.6/-105.2 | MR-K-F | 1.00 | 5.1 | 0.88 | V382 Car |
| 2012-03-09 | 07:50:38 | I1-A1-G1 | 105.8/79.4/39.9 | -87.0/111.8/-126.9 | MR-K-F | 1.00 | 6.7 | 1.04 | HR 5171 |
| 2012-03-09 | 08:55:19 | I1-A1-G1 | 103.1/80.0/37.0 | -72.4/125.9/-115.1 | MR-K-F | 1.00 | 5.0 | 1.20 | V382 Car |
| 2012-03-09 | 08:34:23 | I1-A1-G1 | 91.8/78.1/28.1 | -39.4/157.3/-92.3 | MR-K-F | 1.00 | 6.7 | 1.05 | HR 5171 |
-
1
Projected baseline length B and position angle P.A.
-
2
Detector integration time
-
3
Atmospheric coherence time
-
4
LR-K-F: AMBER low-resolution mode (R = 30) in the K band, using the fringe tracker. MR-K-F: same with medium-resolution mode (R = 1500)
| Reference | Data | First data | Lastest data | V magnitude | |||||||
| Nb. | MJD1 | date | MJD1 | date | Coding | median | mean | rms | min | max | |
| Harvey2 | 54 | 34497 | 1953-04-28 | 41460 | 1972-05-22 | Orange | 6.64 | 6.62 | 0.10 | 6.27 | 6.80 |
| Dean3 | 30 | 42584 | 1975-06-20 | 44299 | 1980-02-29 | Green | 6.81 | 6.75 | 0.34 | 6.17 | 7.50 |
| Van Genderen34 | 64 | 43248 | 1977-04-14 | 48315 | 1991-02-27 | Red | 6.75 | 6.72 | 0.15 | 6.41 | 6.97 |
| Hipparcos5 | 326 | 47871 | 1989-12-10 | 49011 | 1993-01-23 | Dark blue | 6.84 | 6.81 | 0.09 | 6.59 | 6.93 |
| LTPV group6 | 21 | 48283 | 1991-01-26 | 49568 | 1994-08-03 | Brown | 7.08 | 7.00 | 0.19 | 6.67 | 7.17 |
| Liller7 | 45 | 50899 | 1998-03-26 | 51602 | 2000-02-27 | Gray | 6.22 | 6.22 | 0.13 | 6.05 | 6.65 |
| ASAS8 | 351 | 52980 | 2003-12-06 | 55088 | 2009-09-13 | Yellow | 6.61 | 6.56 | 0.21 | 6.11 | 6.87 |
| Otero9 | 510 | 50989 | 1998-06-24 | 56331 | 2013-02-07 | Light blue | 6.59 | 6.61 | 0.22 | 6.10 | 7.32 |
| J magnitude | |||||||||||
| SAAO | 109 | 42491 | 1975-03-20 | 56390 | 2013-04-07 | 2.11 | 2.09 | 0.11 | 1.92 | 2.70 | |
| H magnitude | |||||||||||
| SAAO | 109 | // | // | // | // | 1.31 | 1.27 | 0.14 | 1.09 | 1.84 | |
| K magnitude | |||||||||||
| SAAO | 109 | // | // | // | // | 0.91 | 0.89 | 0.15 | 0.65 | 1.43 | |
| L magnitude | |||||||||||
| SAAO | 106 | // | // | // | // | 0.33 | 0.31 | 0.16 | 0.05 | 0.91 | |
-
1
MJD = JD - 2400000
- 2
- 3
-
4
From van Genderen (1992), including three unpublished VBLUW observations made in 1977 (JD 2443248.5; 2443252.5 and 2443269.5, Pel, 2013, priv.comm.)
-
5
Hipparcos data published in van Leeuwen et al. (1998, see Sect.2.2).
- 6
-
7
Private communication to van Genderen from W. Liller. Observations performed with a CCD and a 20 cm private telescope (see Sect.2.2).
-
8
From http://www.astrouw.edu.pl/asas/ Pojmanski (2002)
-
9
This study, http://varsao.com.ar/Curva_V766_Cen.htm
Appendix B Medium-resolution AMBER/VLTI data
The medium-resolution data from AMBER are very rich and deserve to be shown in detail. The atmospheric conditions during the observing run were excellent and the standard deviations of the dispersed differential and closure phases are better than 2∘. We show in Fig. 13 and in Fig. 15 the differential visibilities from five individual observations in the CO and Br region, respectively. The dataset consists of three dispersed raw visibilities from a calibrator, and two sets of three dispersed visibilities from V382 Car and HR 5171 A (out of five recorded each). The differential and closure phases are shown in Fig. 14 and Fig. 16 in the CO and Br region, respectively.
The comparison of the visibilities from these two sources shows the strong impact of the extended environment of HR 5171 A on the observations. We note also that a signal is observed in the visibilities from V382 Car through the CO lines, but only at the longest baselines. This signal indicates a thin molecular environment at a close distance from the photosphere. This must be some CO emission filling an already existing CO absorption since there is no significant signature of this CO in the spectrum. The strong phase signal of the CO lines shows the spatial complexity of HR 5171 A. We recall that a UD surrounded by a centered GD should yield a zero phase signal. One can also see that a significant closure phase signal is observed only in data from HR 5171 A. Furthermore, the signal was observed to strongly increase from one observation to the next during the night, following the Earth rotation of the projected baselines, clear evidence of binarity, but also an indication that the envelope of molecular gas also has a complex shape, not accounted for our geometrical model. No signal is observed in the Br region (visibilities and phases). A weak phase signal close to the noise limit is observed in the NaI2.2m sodium line of HR 5171 A.
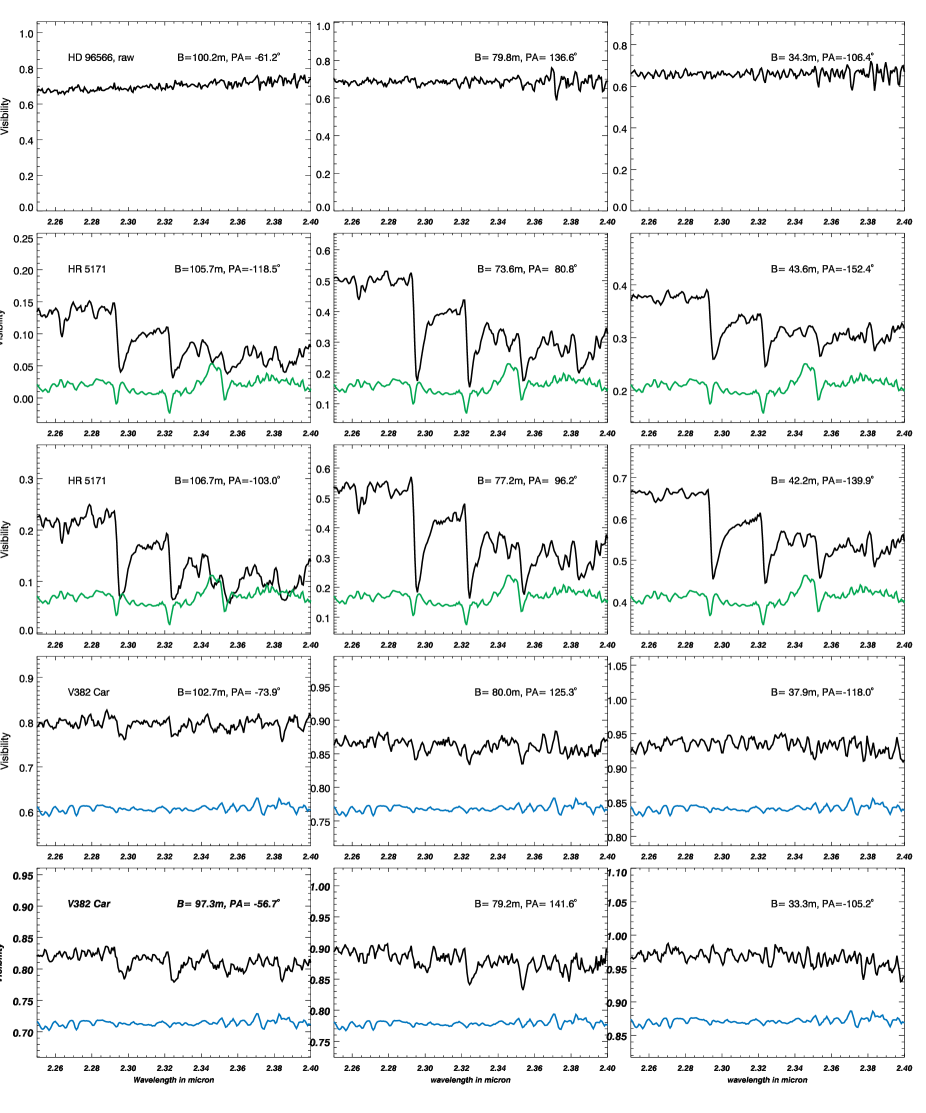
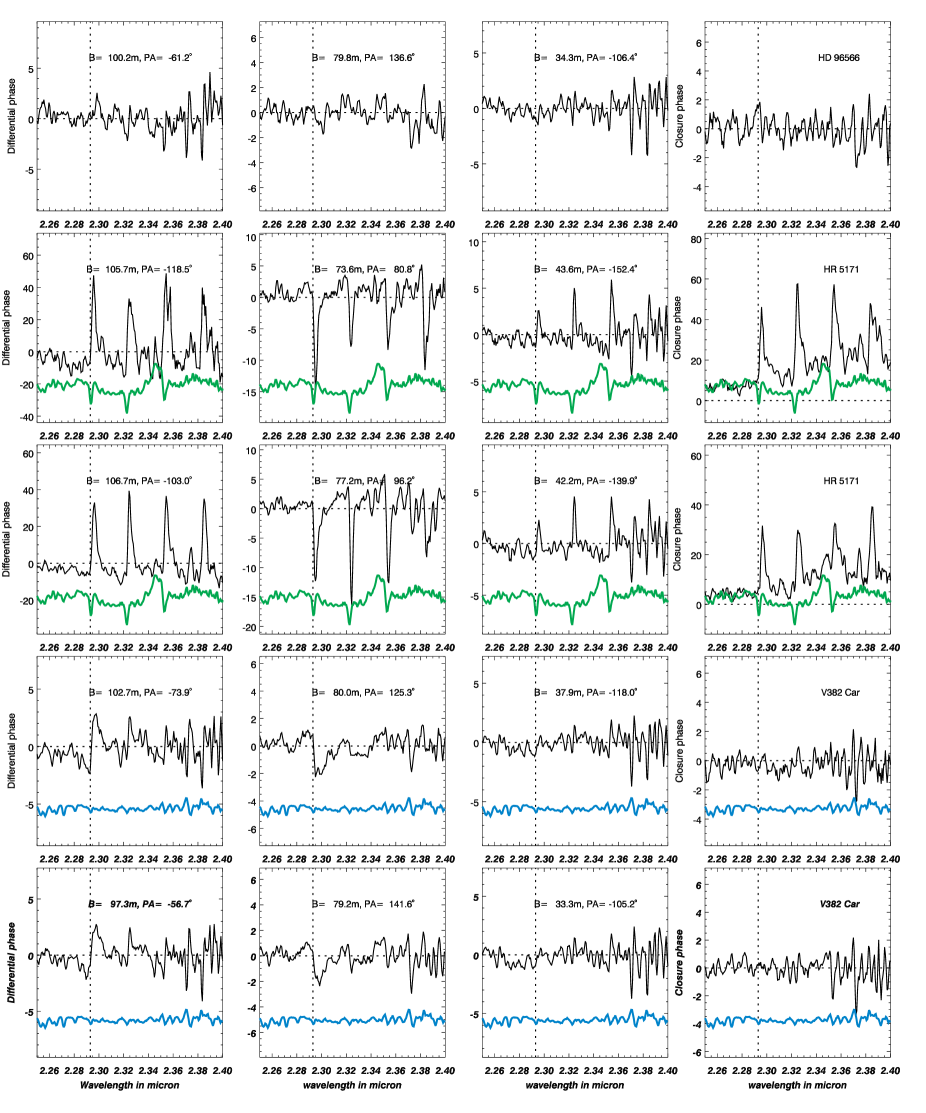
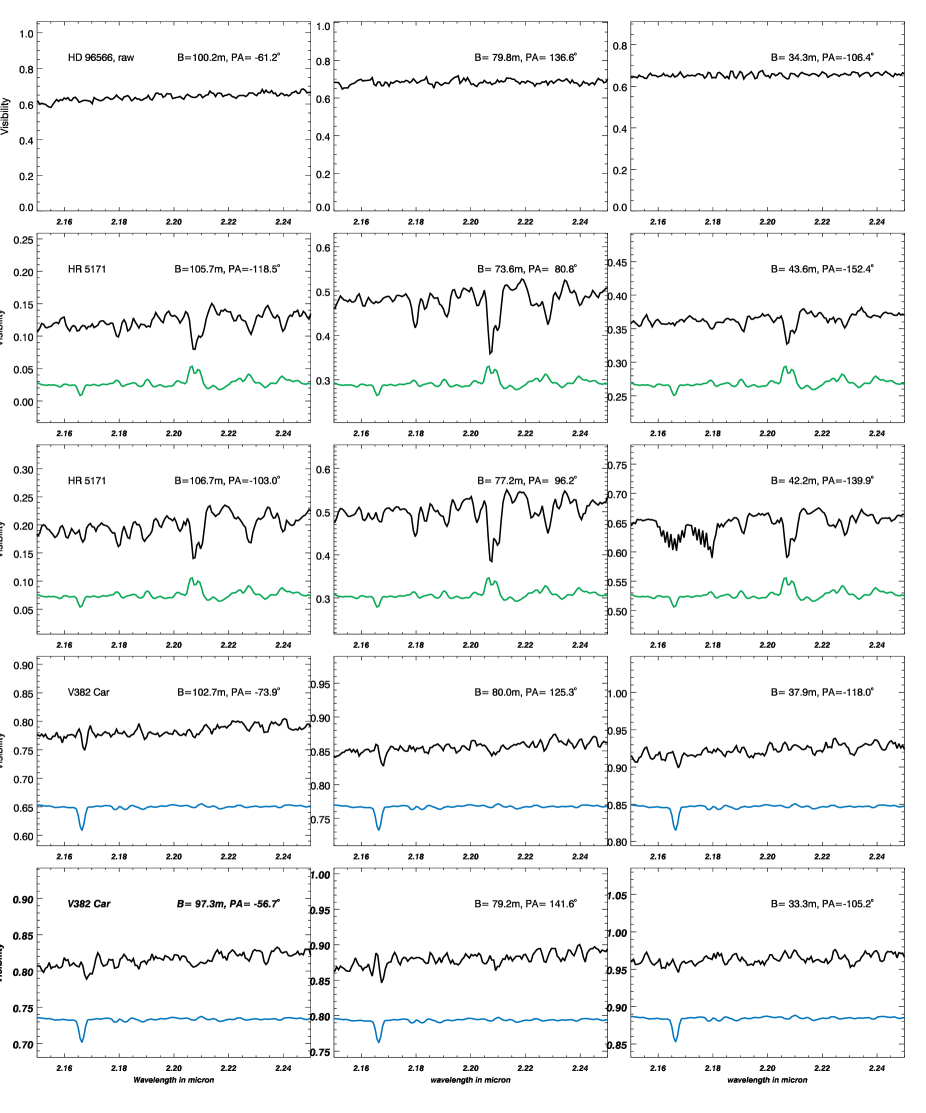
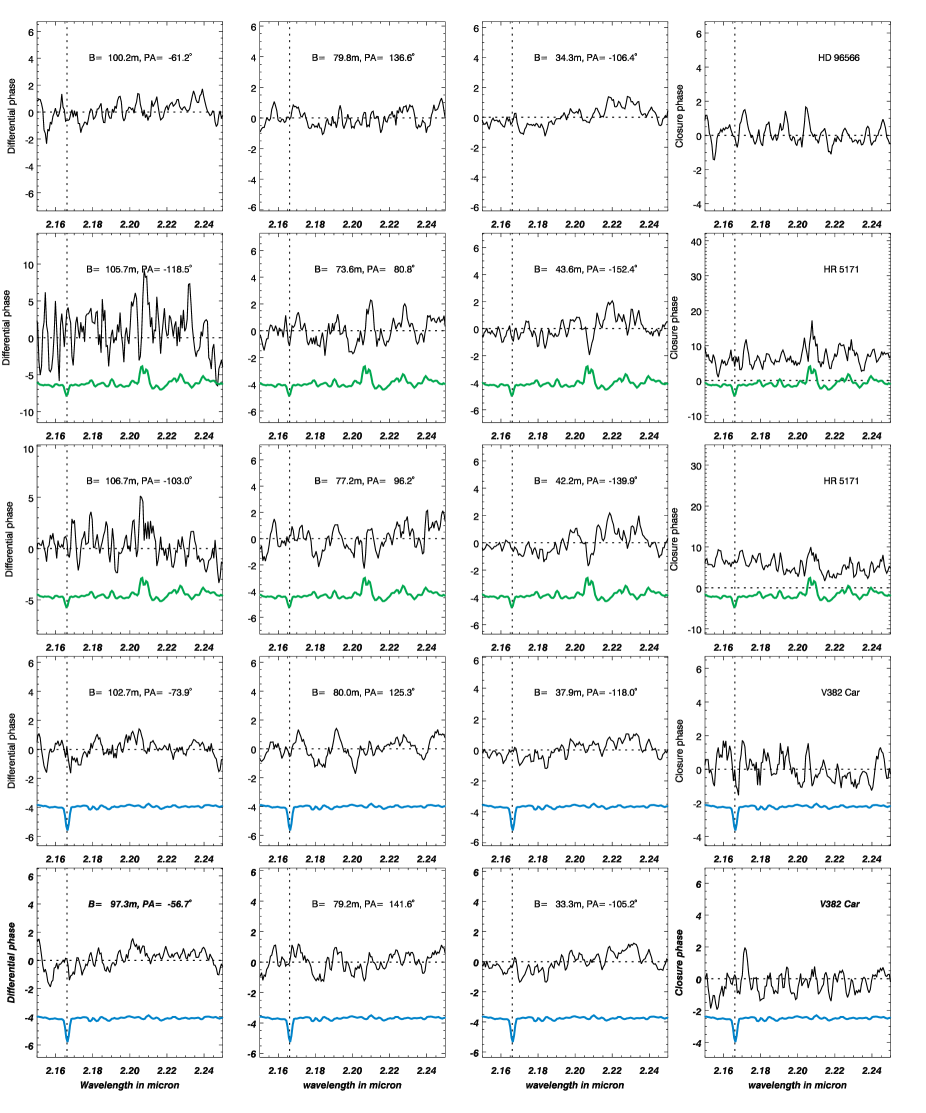
Appendix C Archival X-ray data
HR 5171 A and HR 5171 B were observed serendipitously by XMM-Newton during 40ks in Aug. 2001 (Rev number = 0315, thick filter used for the EPIC cameras). This archival dataset (ObsID=0087940201) was downloaded and processed using SAS v12.0.0 and calibration files available on July 1, 2012, following the recommendations of the XMM team101010SAS threads, see
http://xmm.esac.esa.int/sas/current/documentation/threads/ . A background flare affects the beginning of the observation, which was discarded. HR 5171 appears as a single faint source near the top edge of the field-of-view of the MOS2 and pn cameras. It is also near a gap in the pn dataset. The source detection was performed using the task edetect_chain on the three EPIC datasets and in two energy bands (soft=S=0.3–2.0 keV, hard=H=2.0–10.0 keV energy band). The best-fit position for this source is 13:47:10.138,-62:35:16.11, i.e. at 8.6” to the NW of HR 5171 A, a position compatible with that of HR 5171 B. The X-ray detection is also compatible with current knowledge on the X-ray emission of massive stars : O- and early-B stars, such as HR 5171 B, are moderate X-ray emitters. We infer the equivalent on-axis count rates are 0.008 ct/s for MOS2 and 0.02 ct/s for pn, which correspond111111conversion performed with HEASARC PIMMs, see http://heasarc.gsfc.nasa.gov/Tools/w3pimms.html to fluxes of 1.5-2.55 erg.cm-2 s-1 considering a plasma temperature of 0.6 keV. These values yield , a value typical of massive OB stars. In contrast, the evolved objects with strong winds, such as the LBVs or WCs, are generally not detected (Nazé 2009; Nazé et al. 2012; Oskinova et al. 2003). It is thus unsurprising that HR 5171 A is not detected. There is also no evidence of a companion or any evidence of energetic radiations from the interaction between the two components in this spectral range. In August 2001 the orbital phase was about 0.66, a potentially favorable configuration for observing any emission from the companion.
Appendix D Infrared photometry
HR 5171 A shows dust excess (Humphreys et al. 1971; Apruzese 1975; Odenwald 1986; Stickland 1985). Since the early 70s, HR 5171 A has regularly been observed by space-borne infrared instruments, and we report these measurements in Table 5. The aperture of these instruments is larger than several arcseconds. Since HR 5171 A cleaned up a large cavity, one can reasonably be confident that no other infrared source contributes significantly to the infrared flux. The flux from the B0Ia supergiant HR 5171 B is also negligible at these wavelengths. Some significant variability of the source is observed by comparing the MSX and WISE measurements obtained yr apart in filters with relatively close characteristics. The recent WISE fluxes are systematically lower at wavelengths shorter than 12m. Nonetheless, the large variations observed between instruments with filters covering the N band can be explained by the variations of the transmission that include different contributions of the very strong silicate features at 10 m.
The colors of HR 5171 A are compared to those of YSGs, i.e. Cepheid variables in Figs. 17. They are very similar in , but HR 5171 A has distinctly redder colors in , probably from the influence of circumstellar dust.
| Instrument | Filter | Flux | Date | |
|---|---|---|---|---|
| [micron] | [Jy] | |||
| RAFLGL | 12.2 | - | 692 | 1971 |
| RAFLGL | 20 | - | 789 | 1971 |
| IRAS | - | 12 | 605 | 1983 |
| IRAS | - | 25 | 531 | 1983 |
| MSX1 | 4.29 | B1 | 17915 | 1996/1997 |
| MSX | 4.25 | B2 | 23020 | 1996/1997 |
| MSX | 8.9 | A | 1767 | 1996/1997 |
| MSX | 12.1 | C | 67934 | 1996/1997 |
| MSX | 14.6 | D | 51631 | 1996/1997 |
| MSX | 21.3 | E | 70349 | 1996/1997 |
| AKARI2 | 18 | S18 | 1121182 | 2006/2007 |
| AKARI3 | 65 | S65 | 9513 | 2006/2007 |
| AKARI | 90 | S90 | 375 | 2006/2007 |
| AKARI | 140 | S140 | 116 | 2006/2007 |
| WISE4 | 3.4 | W1 | 955 | 2010 |
| WISE | 4.6 | W2 | 676 | 2010 |
| WISE | 12 | W3 | 29139 | 2010 |
| WISE | 22 | W4 | 8067 | 2010 |