Glass-like phonon scattering from a spontaneous nanostructure in AgSbTe2
Abstract
Materials with very low thermal conductivity are of high interest for both thermoelectric and optical phase-change applications. Synthetic nanostructuring is most promising to suppress thermal conductivity by scattering phonons, but challenges remain in producing bulk samples. We show that in crystalline AgSbTe2, a spontaneously-forming nanostructure leads to a suppression of thermal conductivity to a glass-like level. Our mapping of the phonon mean-free-paths provides a novel bottom-up microscopic account of thermal conductivity, and also reveals intrinsic anisotropies associated with the nanostructure. Ground-state degeneracy in AgSbTe2 leads to the natural formation of nanoscale domains with different orderings on the cation sublattice, and correlated atomic displacements, which efficiently scatter phonons. This mechanism is general and points to a new avenue in nano-scale engineering of materials, to achieve low thermal conductivities for efficient thermoelectric converters and phase-change memory devices.
Nanostructured materials are among the strongest candidates for thermoelectric applications, as they offer a route to suppress thermal conductivity without hindering electrical properties Minnich-2009 ; Chen-2003 . The performance of thermoelectric materials is controlled by their figure-of-merit, , where is the Seebeck coefficient, is the electrical conductivity, and is the total thermal conductivity Wood ; Goldsmid-book-2010 ; Snyder-2008 . Thus, high thermoelectric efficiency requires the lowest possible , while preserving a strong power factor, . Low thermal conductivity is also key in optical phase-change (PC) materials, which encode information in bits of either amorphous or crystalline state Wuttig-review . Because bit-state switching is triggered by melt-quenching, low thermal conductivity is important to decrease the heating power required to operate a PC memory chip Matsunaga-2011 ; Schneider-2010 .
The semiconductor compound AgSbTe2 is attractive for both thermoelectric and PC applications, because of its anomalously low, glass-like thermal conductivity [11; 12; 13; 14; 15; 10]. Its thermal conductivity is dominated by the lattice component, , corresponding to propagation of phonons Jovovic-2008 . The in AgSbTe2 is about three times lower than that of rock-salt PbTe at K, and almost an order of magnitude lower at K, as it is nearly independent of temperature. It was reported that in AgSbTe2 reaches the theoretical minimum, corresponding to phonon mean-free-paths limited to interatomic distances Wolfe-1960 ; Morelli-2008 . This glass-like is key to achieve a high thermoelectric figure-of-merit, at 720 K in pure form, and when alloyed with PbTe in LAST Jovovic-2008 ; Hsu-Science-2004 ; CRC-handbook . A detailed microscopic understanding of the origin of the anomalously low thermal conductivity in AgSbTe2 has, however, remained elusive. Several factors have been pointed out, including strong anharmonicity Morelli-2008 ; Nielsen-2013 , and phonon scattering by differences in local force-constants of Ag+ and Sb3+ cations Ye-2008 . In addition, the phase-change character of AgSbTe2 Detemple-2003 may reveal a relative instability originating from resonant bonding characteristics Wuttig-2008a ; Wuttig-2008b . Yet, no quantitative microscopic understanding of has emerged, in part because phonon measurements were unavailable.
Recent developments in inelastic neutron scattering (INS) enable a full mapping of the dynamic structure factor, , for all phonon branches, across the entire Brillouin zone Delaire-PbTe-2011 ; Delaire-FeSi-2011 ; Pang-2013 . Here, we show how these developments offer an opportunity to derive a definitive microscopic account of the lattice thermal conductivity, thereby complementing more conventional experimental techniques. Our INS measurements of AgSbTe2 provide critical insights into phonon scattering processes, from which we derive an unprecedented microscopic picture of thermal conductivity. Combining this novel approach with transmission electron microscopy (TEM), we demonstrate that this compound achieves glass-like thermal conductivity through the formation of a spontaneous nanostructure, which hinders the propagation of heat. The nanostructure in AgSbTe2 originates from the ordering of cations into nano-scale domains with a correlation length nm. This spontaneous nanostructure efficiently scatters phonons, without the need for artificial nanostructuring. This mechanism should be of very high interest, as it points to an important direction for designing new materials with very-low thermal conductivity.
Despite the apparent simplicity in chemical formulation, the crystal structure of AgSbTe2 shows a surprising degree of complexity. The –phase of AgSbTe2 forms slightly off stoichiometry in the pseudo-binary Ag2Te – Sb2Te3 phase diagram Maier-1963 ; Marin-1985 ; Sugar-Medlin-2009 , and one can express the composition in terms of the deviation from stoichiometry, , as (Ag2Te)(1-x)/2(Sb2Te3) Ag1-xSb1+xTe2+x. The –phase of AgSbTe2 was long believed to crystallize in a cubic rock-salt structure with random Ag/Sb distribution on the cation sublattice Geller-1959 . However, a more recent single-crystal x-ray diffraction study proposed several possible ordered superstructures Quarez-JACS2005 , although these superstructures were not observed in subsequent TEM work Sugar-Medlin-2009 ; Sharma-2010 ; Sugar-Medlin-2011 . First-principles calculations of the ground-state structure also predicted several ordered superstructures with very close energies in both AgSbX2 and AgBiX2 (XS, Se, Te) Nielsen-2013 ; Hoang-PRL2007 ; Barabash-PRL2008 ; Barabash-PRB2010 . In addition, it was shown with TEM that the ordering in AgBiS2 and AgBiSe2 tends to form nano-scale domains Manolikas-1977 . Our present results show that Ag and Sb in AgSbTe2 also tend to order at the nanoscale, and that the resulting nanostructure efficiently scatters phonons.
Large single crystals of –phase AgSbTe2 were grown from melts with (masses reaching g), while stoichiometric crystals () were smaller (g). Powder samples were synthesized for . Both neutron powder diffraction (NPD) and electron probe micro-analysis (EPMA) confirm that samples with contain a secondary Ag2Te phase ( 8 volume fraction for ). No Ag2Te was observed in the samples, on the other hand (with NPD, EPMA, and TEM). The EPMA compositions of the –phase are Ag22.2Sb26.8Te51, Ag21.5Sb27.2Te51.2, and Ag18.5Sb29.3Te52.2 for nominal , respectively. Hereafter, we refer to all samples as AgSbTe2, because these –phase-dominated samples are found to behave similarly.
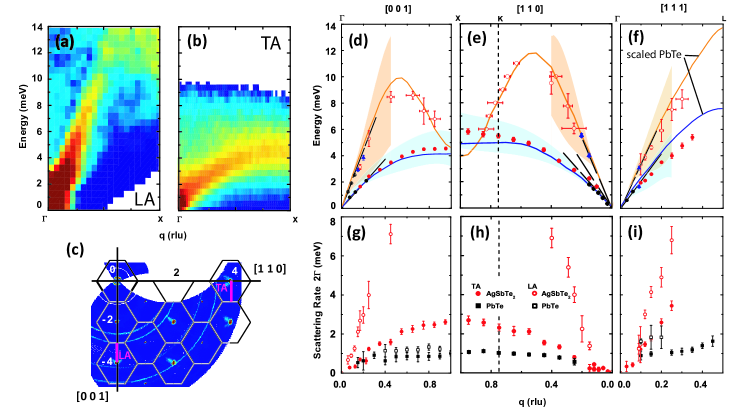
INS measurements were performed on single-crystals and powders, using both time-of-flight (ARCS ARCS and CNCS CNCS ) and triple-axis (HB3, HB1A, CTAX) spectrometers at Oak Ridge National Laboratory. Details are given in the Supplementary Information (SI). Fig. 1 summarizes our INS results on –phase single-crystalline AgSbTe2 (composition Ag18.5Sb29.3Te52.2), concentrating on heat-carrying acoustic phonon dispersions along high-symmetry directions. The phonon linewidths, , are inversely related to lifetimes, . As may be seen in this figure, all acoustic modes are strikingly broad in energy, corresponding to very short phonon lifetimes. While the transverse acoustic (TA) phonon branches and the lower part of the longitudinal acoustic (LA) branches are broad, but still well defined, the top of LA branches and the optical branches form a broad continuum of total width meV. This precluded fitting peaks to extract optical dispersions, but it indicates that optical modes and LA modes of higher energy have only a marginal contribution to the lattice thermal conductivity (very short lifetimes). The phonon energies and linewidths were similar in the different ingots measured ().
| Branch | RUS (m/s) | INS (m/s) | Wm-1K-1 |
|---|---|---|---|
| TA | |||
| [001] | 1,356 14 | 1,407 7 | 0.24 |
| [110] | 1,356 14 | 1,302 8 | 0.53 |
| [111] | 1,711 18 | 1,746 22 | 0.20 |
| LA | |||
| [001] | 3,158 160 | 3,073 33 | 0.13 |
| [110] | 2,879 144 | 2,824 55 | 0.21 |
| [111] | 2,766 138 | 2,687 33 | 0.12 |
.
The slopes of the phonon dispersions for long wavelengths (low ) are in excellent agreement with our resonant ultrasound (RUS) measurements of sound velocities (dashed straight lines in Fig. 1-d,e,f and Table 1). Our results for sound velocities are considerably lower than the polycrystalline estimate reported in the literature Wolfe-1960 . The smooth dispersion curves in Fig. 1-d,e,f were obtained from the acoustic phonon dispersions of PbTe, with energies scaled by the ratio of average masses, . The good agreement between the scaled PbTe phonon dispersions and the dispersions of AgSbTe2 indicates that the average force-constants in both materials are comparable overall, although phonon dispersions of AgSbTe2 are relatively softer along the direction.
The linewidths (FWHM) of acoustic phonons, , obtained after correction for the instrumental resolution (details in SI), are compared to those of single-crystalline PbTe Delaire-PbTe-2011 in Fig. 1-g,h,i. The transverse acoustic phonons in PbTe have much narrower linewidths than in AgSbTe2. This was confirmed with measurements on both ARCS and CNCS, which gave very similar phonon linewidths, (SI). This is consistent with being three times larger in PbTe than in AgSbTe2 at K, despite lower group velocities in PbTe. We also note that the TA linewidths in AgSbTe2 are especially broad along .
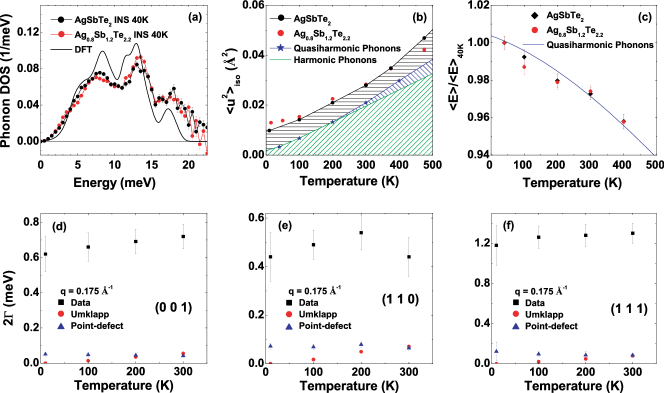
In Fig. 2, we present results for the temperature dependence of phonon energies and linewidths in AgSbTe2 (). Our results show that, while some anharmonicity is present, it is not the dominant source of phonon scattering. In particular, as may be seen in Fig. 2-d,e,f, the TA phonon linewidths show no temperature dependence between K and K, within experimental uncertainty. This indicates that the dominant scattering mechanism for TA phonon scattering is independent of temperature, ruling out anharmonicity. Rather, the nanostructure is the main source of phonon scattering in this regime, although anharmonicity could become more significant for K.
The phonon density of states (DOS) measured with INS on powders ( and ) is shown in Fig. 2-a. Both samples have the same DOS within experimental uncertainties, indicating that the Ag2Te impurity phase for only has a small effect (as does the difference in –phase composition). The DOS exhibits three broad peaks centered around 7, 13, and 17 meV, and phonon cutoff of about 20 meV, in good agreement with our first-principles calculations (see below). Because the masses and cross-sections are similar for Ag, Sb, and Te, the spectrum obtained from INS does not significantly distort the phonon DOS. The average phonon energy ratio, compared with PbTe, (K), is very close to the inverse square-root of the mass ratio , again indicating that the underlying force-constants are comparable, on average, in the two materials.
We observe a softening of the phonon DOS from 40 to 400 K (SI), which is an expected effect of moderate anharmonicity. The amount of softening is well accounted for by thermal expansion, however, thus being compatible with the quasiharmonic (QH) model. Figure 2-c shows the relative change in in both powder samples, as a function of temperature, as well as the expected QH behavior derived from the NPD measurements, and the Grüneisen parameter from Ref. 13. As can be seen on this figure, the temperature dependence of phonon energies in the powder samples follows the QH model quite well up to 400 K. The QH model also provided a very good account for the heat capacity measured up to K (see SI). The optical peaks in the phonon DOS showed some broadening with increasing (SI), which may indicate more anharmonicity of the optic modes, possibly because of overlap with the top of LA branches.
In Fig. 2-b, we compare the temperature dependence of the isotropic average thermal displacement measured with NPD, , to the vibrational component derived from the measured phonon DOS. The component due to harmonic vibrations, , is systematically lower than the total atomic displacement, with a constant offset, Å2 for K. The softening of the phonon DOS with increasing , resulting in the quasiharmonic value , does not account for this effect. Rather, the offset reveals static displacements, which are a temperature-independent source of phonon scattering. These static displacements originate from atomic relaxations in and between ordered nanodomains.
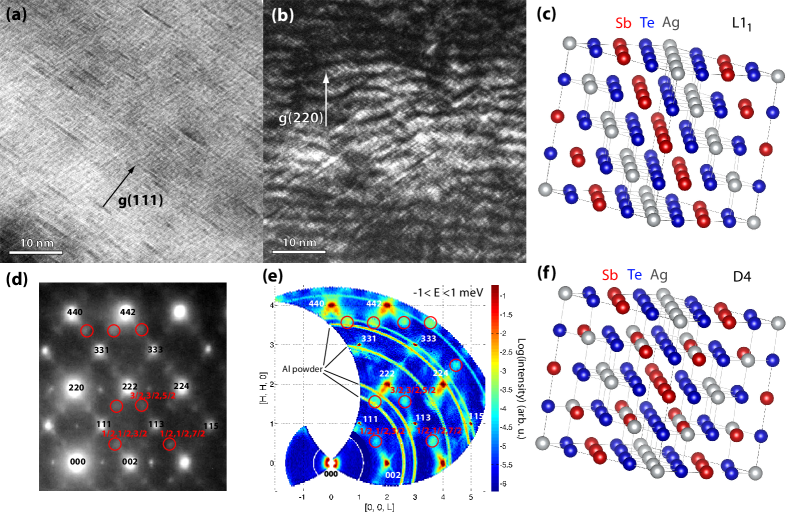
We performed first-principles density functional theory (DFT) calculations on ordered superstructures of AgSbTe2, including the and cation superstructures (Fig. 3-c,f) previously predicted as candidate ground-states (details in SI) Hoang-PRL2007 ; Barabash-PRL2008 ; Barabash-PRB2010 . Upon relaxing ion positions, we find systematic displacements of Te toward Ag cations in first nearest-neighbor (1NN) bonds: vs . These static displacements likely contribute to phonon scattering, as mentioned above. Our DFT phonon calculations on the ordered structures predict a significant overlap of optic and longitudinal acoustic modes, although some of this effect is associated with the band folding induced by the use of a supercell. The effect is likely intrinsic, however, based on the fact that all atomic masses are similar in this material, which does not promote the same energy-separation of acoustic and optic modes as in PbTe, where acoustic modes (in particular TA modes) mainly involve Pb motions, and optical modes mainly involve Te motions. This is corroborated by the good agreement between the measured phonon DOS and our calculation for a ordered superstructure (64-atom cell) (Fig. 2-a). The overlap of acoustic and optic modes in AgSbTe2 could lead to enhanced interaction between the high-frequency acoustic modes and low-frequency optic modes. The results of our phonon calculations are in overall agreement with previous studies Hoang-PRL2007 ; Barabash-PRL2008 .
As previously mentioned, the lack of -dependence of phonon relaxation times, , indicates that anharmonic phonon-phonon scattering is not the dominant phonon scattering mechanism, at least up to room temperature, for heat-carrying TA phonons. As originally shown by Peierls, phonon-phonon umklapp scattering follows a dependence scaled by the Debye temperature, [38]. From the phonon DOS for Ag0.8Sb1.2Te2.2 at K, we obtain K (and K for the AgSbTe2). Thus phonon-phonon scattering would be expected to give a strong -dependence of the scattering rates in the measured range of temperature, which is not observed. We calculated the expected phonon linewidths from umklapp processes, using the formula derived by Slack and Galginaitis Slack-1964 (details in SI). The results for linewidths for (close to the dominant contribution to ) are plotted in Fig. 2. As can be seen, is much smaller than the measured linewidths, at most 15% of the observed at K.
Point-defects constitute another possible source of phonon scattering, owing to the mixed nature of the Ag/Sb cation sublattice, and possible vacancies Barabash-PRL2008 . The results for calculated with the model of Krumhansl and Matthew Krumhansl are plotted in Fig. 2, taking into account both the force-constant difference of Ag and Sb sitesYe-2008 , and the additional effect of 5% vacancies. Point-defect scattering accounts for about 10–15% of the measured linewidth. From the analysis of phonon lifetimes for typical scattering sources, one must conclude that a more significant defect structure is responsible for the large, –independent phonon linewidths. Such a conclusion is directly supported by our observations with TEM and diffuse neutron scattering data.
TEM observations reveal that all –phase samples (Ag1-xSb1+xTe2+x, ) exhibit a pervasive nanostructure, which includes cation-ordering in nano-domains, and correlated atomic displacements resulting in strains. Superlattice reflections are observed half-way between all-even and all-odd diffraction spots of the parent rock-salt structure, as highlighted by red circles in Fig. 3-d,e. They correspond to the points of the FCC Brillouin zone ( with odd in rock-salt reciprocal lattice). This reveals a doubling of the lattice period along directions in real space. This is compatible with a segregation of Ag and Sb ions to alternating crystallographic planes, as expected for the proposed ground-state superstructure Hoang-PRL2007 ; Barabash-PRL2008 ; Barabash-PRB2010 . It is also compatible with the related ordering in the structure of nearly degenerate energy Hoang-PRL2007 ; Barabash-PRL2008 ; Barabash-PRB2010 . These two structures are illustrated in Fig. 3-c,f. Thus, it appears that energy-degeneracy between competing cation orderings leads to the formation of a complex ordering pattern, with multiple ordering nanodomains. Because the 4 variants of (corresponding to 4 possible directions) and the D4 variant have nearly the same energy, the material is in a “frustrated” state, and remains ordered only locally. The width of the superlattice peaks in single-crystal neutron data provides a correlation length for ordered domains nm. In addition, slight offsets of the superstructure peaks from points were observed, indicating possible further modulations of ordered nano-domains. Thus, we find a similar behavior as previously reported in AgBiSe2 and AgBiS2 Manolikas-1977 , although the nanostructure appears somewhat more diffuse in Ag1-xSb1+xTe2+x. It is plausible that similar orderings and nanostructures could occur in related ABX2 compounds.
The nanostructure was imaged with 2-beam condition in the TEM. In Fig 3-a, elongated features a few nanometers across are observed in the planes, associated with strain contrast of nanodomains. Their shape could not be uniquely determined, but they are either platelets or needles. In Fig 3-b, an oscillating contrast is clearly seen, forming light and dark ripples of nm period, associated with strain contrast. Our DFT simulations for the –ordered structure predict a tendency toward rhombohedral distortion (about flattening of cuboid along rhombohedral axis). Thus, cation ordering in nanodomains of variants should tend to strain the lattice along different directions, while nanodomains would not. While no rhombohedral splitting of peaks was observed in our NPD diffraction patterns, it may be because constraints between neighboring nanodomains suppress the distortion. We note that the strain contrast in Fig 3-b does not directly superimpose with the contrast in Fig 3-a, although its lateral periodicity is in good agreement with the ordering correlation length (nm). In addition, a modest density of stacking faults was also observed, likely associated to the excess Te in the –phase and the formation of Te-Te double-layers, in agreement with prior observations Sharma-2010 ; Sugar-Medlin-2011 .
Further, HRTEM and fast-Fourier transforms (FFT) support the superlattice interpretation of the diffraction patterns (SI). The HRTEM images clearly show layers parallel to in agreement with the Ag-Te-Sb-Te-Ag stacking sequence (periodicity Å) of (111) planes in the structure. The FFT’s obtained from different regions of the HRTEM reveal different ordering directions, while other regions appeared compatible with order, confirming the local nature of the ordering.
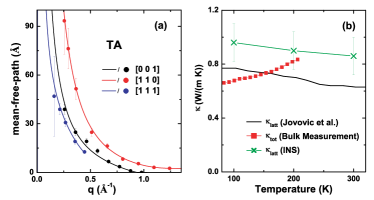
The length-scale of the observed nanostructure is in good agreement with the measured phonon mean-free-paths, . In addition, we observe an anisotropy in the lifetimes and mean-free-paths, which could be related to the anisotropy of the nanostructure. The dominant mean-free-path of TA phonons, , was estimated by integrating the data in Fig. 4, weighted by their normalized contribution to the thermal conductivity. The results are along [111], [100], and [110], respectively. The TA mean-free-paths are thus shortest along , despite the larger group velocity in that direction. In the diffusive regime, the total lattice thermal conductivity must be isotropic for a system of average cubic symmetry, as is a rank-2 tensor in that limit. However, in the ballistic regime, is governed by the rank-4 elastic tensor (group velocities), as well as possible anisotropies in the microscopic phonon scattering mechanisms themselves Wolfe-book . Because the mean-free-paths are so short in AgSbTe2, macroscopic samples are always in the diffusive regime, even at low temperatures. Our thermal conductivity measurements in oriented single-crystals confirm this (see SI). We point out that our values of are an order of magnitude larger than interatomic distances, but for optical modes could be shorter. The magnitude of mean-free-paths for heat-carrying TA phonons confirms the importance of the nanostructure in scattering phonons.
The contributions of phonon dispersions along different directions were averaged to obtain the total, isotropic in the diffusive limit. The total thermal conductivity was calculated by summing individual phonon contributions, with an isotropic average (details in SI). The effective, isotropic contributions of different phonon branches to are listed in Table 1. Overall, the TA modes contribute more than of the total , owing to the limited LA contribution at high-, where they overlap with optical modes. The estimate of based on the measured phonon mean-free-paths is in good agreement with the values obtained from bulk transport measurements, as shown in Fig. 4. This result establishes neutron scattering as a powerful tool to probe the microscopic origins of lattice thermal conductivity.
Our neutron scattering and TEM results show that a pervasive nanostructure develops in –phase AgSbTe2, similar to that in AgBiSe2 and AgBiS2 Manolikas-1977 . This spontaneous nanostructure involves both local ordering of Ag and Sb on the cation sublattice, and correlated atomic displacements, that combine to scatter phonons on length scales of a few nanometers. The nanostructure may act in concert with anharmonic bonding in suppressing , especially above K. We note that variations in thermal conductivity of AgBiSe2 upon heat treatments Nielsen-2013 may involve changes in short-range ordering and size of nanodomains Manolikas-1977 . Materials spontaneously forming nanoscale inhomogeneities alleviate the need for artificial nanostructuring, and are therefore of great interest Minnich-2009 ; Biswas-2011 ; Biswas-2012 ; Pei-2011 . Compared with other uses of nanostructuring, the phonon scattering mechanism discussed here does not require alloying, which may be advantageous in decoupling the optimization of thermal and electronic transport. Ordered nano-scale domains could occur in other materials where mixed species share a sublattice, and first-principles simulations could be used to systematically search for near-degeneracies in ordering energies. Our findings could thus provide guidelines for finding other materials with low thermal conductivities for thermoelectric and phase-change applications.
Acknowledgements
Simulations and integration of results (O.D.), as well as synthesis and characterization (A.F.M., M.A.M., B.C.S) were supported by the US Department of Energy, Office of Basic Energy Sciences, Materials Sciences and Engineering Division. Neutron scattering (J. M.) and electron microscopy (C. E. C., Y. S.-H.) were supported by the US Department of Energy, Office of Basic Energy Sciences, through the S3TEC Energy Frontier Research Center, DESC0001299. L.H.V. and V.M.K. acknowledge support provided by the the Joint Directed Research and Development program of the UTK Science Alliance. The Oak Ridge National Laboratory’s Spallation Neutron Source and High-Flux Isotope Reactor are sponsored by the Scientific User Facilities Division, Office of Basic Energy Sciences, US Department of Energy.
Author Contributions
⋆ Both first-authors contributed equally to the study. O.D. designed the study. O.D. and J.M. performed and analyzed neutron scattering experiments, and wrote the manuscript. A.F.M., M.A.M. and B.C.S synthesized and characterized the samples. C.E.C and Y. S.-H. performed and analyzed electron microscopy. L.H.V. and V.M.K. performed and analyzed ultrasound measurements. O.D. performed first-principles simulations. D.L.A, G.E., T.H., A.H. and W.T. helped with neutron data acquisition.
Additional Information
The authors declare no competing financial interests.
References
- (1) —–
- (2) Minnich, A. J., Dresselhaus, M. S., Ren, Z. F., and Chen, G. Bulk nanostructured thermoelectric materials: current research and future prospects. Energy Environ. Sci. 2, 466 479 (2009).
- (3) Chen, G., Dresselhaus, M. S., Dresselhaus, G., Fleurial, J.-P., Caillat, T. Recent developments in thermoelectric materials. Int. Mater. Rev. 48, 45-66 (2003).
- (4) Wood, C. Materials for thermoelectric energy conversion. Rep. Prog. Phys. 51, 459-539 (1988).
- (5) Goldsmid, H. J. Introduction to Thermoelectricity (Springer, Berlin, 2010).
- (6) G. J. Snyder and E. S. Toberer. Complex Thermoelectric Materials. Nature Mater. 7, 105 (2008).
- (7) Siegrist, T., Merkelbach, P., and Wuttig, M. Phase Change Materials: Challenges on the Path to a Universal Storage Device. Annu. Rev. Condens. Matter Phys. 3, 215-237 (2012).
- (8) Matsunaga, T., Yamada, N., Kojima, Rie., Shamoto, S., Sato, M., et al. Phase-Change Materials: Vibrational Softening upon Crystallization and Its Impact on Thermal Properties. Adv. Funct. Mater. 21, 2232-2239 (2011).
- (9) Schneider, M. N., Rosenthal, T., Stiewe, C. and Oeckler, O. From phase-change materials to thermoelectrics? Z. Kristallogr. 225, 463-470 (2010).
- (10) Detemple, R., Wamwangi, D., Wuttig, M., and Bihlmayer, G., Identification of Te alloys with suitable phase change characteristics. Appl. Phys. Lett. 83, 2572 (2003).
- (11) Hockings, E. F. The thermal conductivity of silver antimony telluride. Phys. Chem. Solids 10, 341 (1959).
- (12) Wolfe, R., Wernick, J. H., and Haszko, S. E. Anomalous Hall Effect in AgSbTe2. J. Appl. Phys. 31, 1959 (1960).
- (13) Morelli, D. T. , Jovovic,V. and Heremans, J. P. Intrinsically Minimal Thermal Conductivity in Cubic I-V-VI2 Semiconductors. Phys. Rev. Lett. 101, 035901 (2008).
- (14) Nielsen, M. D., Ozolins, V., and Heremans, J.-P., Lone pair electrons minimize lattice thermal conductivity. Energy Environ. Sci., 6, 570-578 (2013).
- (15) Zhang, S., Zhu, T., Yang, S., Yu, C., and Zhao, X. Improved thermoelectric properties of AgSbTe2 based compounds with nanoscale Ag2Te in situ precipitates. Acta Mater. 58, 4160-4169 (2010).
- (16) Jovovic, V. and Heremans, J. P. Measurements of the energy band gap and valence band structure of AgSbTe2. Phys. Rev. B 77, 245204 (2008).
- (17) Hsu, K. F., Loo, S., Guo, F., Chen, W., Dyck, J. S., Uher, C., Hogan, T., Polychroniadis, E. K. and Kanatzidis, M. G. Cubic AgPbmSbTe2+m: Bulk Thermoelectric Materials with High Figure of Merit. Science 303, 818-821 (2004).
- (18) Skrabek, E. A. & Trimmer, D. S. in CRC Handbook of Thermoelectrics (ed. Rowe, D. M.) 267-275 (CRC, Boca Raton, 1995).
- (19) Ye, L.-H., Hoang, K. , Freeman, A. J., Mahanti, S. D., He, J., et al. First-principles study of the electronic, optical, and lattice vibrational properties of AgSbTe2. Phys. Rev. B 77, 245203 (2008).
- (20) Lencer, D., Salinga, M., Grabowski, B., Hickel, T., Neugebauer, J., and Wuttig, M. A map for phase-change materials. Nature Mater. 7, 972 (2008).
- (21) Shportko, K., Kremers, S., Woda, M., Lencer, D., Robertson, J. and Wuttig, M. Resonant bonding in crystalline phase-change materials. Nature Mater. 7, 653 (2008)
- (22) Delaire, O., Ma, J., Marty, K., May, A. F., McGuire, M. A., Du, M-H., Singh, D. J., Podlesnyak, A., Ehlers, G., Lumsden, M. D. and Sales, B. C. Giant Anharmonic Phonon Scattering in PbTe. Nature Mater. 10, 614 (2011). Note: Values of phonon linewidths (FWHM) in this reference included the factor of in the definition of .
- (23) Delaire, O., Marty, K., Stone, M. B., Kent, P. R. C., Lucas, M. S., Abernathy, D. L., Mandrus, D., Sales, B. C. Phonon softening and metallization of a narrow-gap semiconductor by thermal disorder. Proc. Natl. Acad. Sci. USA 108, 4725 (2011).
- (24) Pang, J. W. L., Buyers, W. J. L., Chernatynskiy, A., Lumsden, M. D., Larson, B. C., and Phillpot, S. R. Phonon Lifetime Investigation of Anharmonicity and Thermal Conductivity of UO2 by Neutron Scattering and Theory. Phys. Rev. Lett. 110, 157401 (2013).
- (25) Maier, R.G. Zeitschrift Fur Metallkunde 54, 311 (1963).
- (26) Marin, R.-M., Brun, G. and Tedenac, J.-C. Phase equilibria in the Sb2Te3-Ag2Te system J. Mater. Sci. 20, 730-735 (1985).
- (27) Sugar, J. and Medlin, D. Precipitation of Ag2Te in the thermoelectric material AgSbTe2. J. of All. and Comp. 478, 75-82 (2009).
- (28) Geller, S. and Wernick, J. H. Ternary Semiconducting Compounds with Sodium Chloride-Like Structure- AgSbSe2, AgSbTe2, AgBiS2, AgBiSe2. Acta Crystallogr. 12, 46 (1959).
- (29) Quarez, E., Hsu, K.-F., Pcionek, R., Frangis, N., Polychroniadis, E. K. and Kanatzidis, M. G. Nanostructuring, Compositional Fluctuations, and Atomic Ordering in the Thermoelectric Materials AgPbmSbTe2+m. The Myth of Solid Solutions. J. Am. Chem. Soc. 127, 9177 (2005).
- (30) Sharma, P. A., Sugar, J. D., and Medlin, D. L. Influence of nanostructuring and heterogeneous nucleation on the thermoelectric figure of merit in AgSbTe2. J. Appl. Phys. 107, 113716 (2010).
- (31) Sugar, J. and Medlin, D. Solid-state precipitation of stable and metastable layered compounds in thermoelectric AgSbTe2. J. Mater. Sci. 46, 1668-1679 (2011).
- (32) Hoang, K., Mahanti, S. D., Salvador, J. R. and Kanatzidis, M. G. Atomic Ordering and Gap Formation in Ag-Sb-Based Ternary Chalcogenides. Phys. Rev. Lett. 99, 156403 (2007).
- (33) Barabash, S. V., Ozolins, V. and Wolverton, C. First-Principles Theory of Competing Order Types, Phase Separation, and Phonon Spectra in Thermoelectric AgPbmSbTem+2 Alloys. Phys. Rev. Lett. 101, 155704 (2008).
- (34) Barabash, S. V., and Ozolins, V. Order, miscibility, and electronic structure of Ag(Bi,Sb)Te2 alloys and (Ag,Bi,Sb)Te2 precipitates in rocksalt matrix: A first-principles study. Phys. Rev. B 81, 075212 (2010).
- (35) Manolikas, C. and Spyridelis, J. Electron microscopic study of polymorphism and defects in AgBiSe2 and AgBiS2. Mat. Res. Bull. 12 907-913 (1977).
- (36) Abernathy, D. L., Stone, M. B., Loguillo, M. J., Lucas, M. S., Delaire, O., Tang, X., Lin, J.Y.Y., and Fultz, B. Design and operation of the wide angular-range chopper spectrometer ARCS at the Spallation Neutron Source. Rev. Sci. Instrum. 83, 15114 (2012).
- (37) Ehlers, G., Podlesnyak, A. A., Niedziela, J. L., Iverson, E. B., Sokol, P. E. The new cold neutron chopper spectrometer at the Spallation Neutron Source: design and performance, Rev. Sci. Instrum. 82, 85108 (2011).
- (38) Peierls, R. Ann. Phys., Leipzig 3, 1055 (1929).
- (39) Slack, G. and Galginaitis, S. Thermal Conductivity and Phonon Scattering by Magnetic Impurities in CdTe. Phys. Rev. 133, 253-268 (1964).
- (40) Krumhansl, J. A. and Matthew, J. A. D. Scattering of Long-Wavelength Phonons by Point Imperfections in Crystals. Phys. Rev. 140, A1812-1817 (1965).
- (41) Wolfe, J. P. Imaging Phonons: Acoustic Wave Propagation in Solids, p. 1, Cambridge University Press (1998).
- (42) Biswas, K., He, J., Zhang, Q., Wang, G., Uher, C., Dravid, V.P., and Kanatzidis, M. G. Strained endotaxial nanostructures with high thermoelectric figure of merit. Nature Chem. 3, 160 (2011).
- (43) Biswas, K., He, J., Blum, I. D., Wu, C.-I., Hogan, T. P., Seidman, D. N., Dravid, V. P., and Kanatzidis, M. G. High-performance bulk thermoelectrics with all-scale hierarchical architectures. Nature 489, 414-418 (2012).
- (44) Pei, Y., Heinz, N. A., LaLonde, A. and Snyder, G. J. Combination of large nanostructures and complex band structure for high performance thermoelectric lead telluride. Energy Environ. Sci. 4, 3640-3645 (2011).