X-ray emission measurements following charge exchange between C6+ and H2
Abstract
Lyman x-ray spectra following charge exchange between C6+ and H2 are presented for collision velocities between 400 and 2300 km/s (1–30 keV/amu). Spectra were measured by a microcalorimeter x-ray detector capable of fully resolving the C VI Lyman series emission lines though Lyman-. The ratios of the measured emission lines are sensitive to the angular momentum -states populated during charge exchange and are used to gauge the effectiveness of different -distribution models in predicting Lyman emission due to charge exchange. At low velocities, we observe that both single electron capture and double capture autoionization contribute to Lyman emission and that a statistical -distribution best describes the measured line ratios. At higher velocities single electron capture dominates with the -distribution peaked at the maximum .
pacs:
34.70.+e, 32.30.-r, 95.30.-kI Introduction
Charge exchange (CX) between highly charged ions and atomic and molecular targets can exhibit large cross sections ( cm2) at certain collision velocity regimes, making it one of the dominant processes in plasma environments. The resulting emission lines due to cascading captured electrons can provide temperature, density and relative abundance information about the interaction environment. In laboratory magnetic confinement plasmas, CX is a common diagnostic tool used in combination with puffed gas and neutral beams injection Hulse et al. (1980); Mattioli et al. (1989); Isler (1994). In astrophysical settings, the identification of x-ray emission from comets has been linked to CX between solar wind ions and ablated cometary neutral gases Lisse (1996); Cravens (1997); Beiersdorfer et al. (2001). These same solar wind ions interact with neutrals of planetary atmospheres and from the heliosphere. These applications have made CX modeling of paramount interest to both the laboratory plasma and astrophysics communities.
A successful model of emission spectra due to CX relies on being able to map the specific distribution of principal, , and angular momentum, , quantum states in which the transferred electron is captured on the ion. Several successful tools have been developed to estimate the -state of capture, however, the state-selective CX cross sections are highly dependent on collision velocity and several models, of various effectiveness, have been put forth to estimate the -distributions in CX over different collision velocity regimes.
A number of previous theoretical and experimental studies helped to establish methods of determining CX cross sections and the principle quantum state of capture for given interaction pairs and energies. In the regime where the collision velocity is approximately equal to the orbital velocity of the captured electron, the most successful tool has been the classical over-the-barrier model (CBM) Ryufuku et al. (1980). At higher collision velocities, the classical trajectory Monte Carlo (CTMC) technique has shown to be successful Simcic et al. (2010). At lower collision velocities, the CX process involves complex trajectories and interaction dynamics between many states and is best modeled by atomic orbital (or molecular orbital) close-coupling (AOCC, MOCC) methods Fritsch and Lin (1986); Kimura and Olson (1986). Given that these calculations involve multiple electrons (and nuclei) they are inherently difficult and have not been widely adapted for extended use in CX modeling. It should also be noted that at these slower collision velocities, transfer ionization (TI), stabilized double capture (DC) and double capture autoionization (DCAI) can contribute to the total CX cross section in addition to the normal single electron capture (SEC) mechanism. These additional processes are rarely included in CX models.
The most prolific -distribution models from the literature Smith et al. (2012); Janev and Winter (1985) have been ) an even distribution, in which the -states are evenly distributed across an -manifold based on the total number of angular momentum states available, ) a statistical distribution given by
| (1) |
) a Landau-Zener (LZ) distribution given by
| (2) |
and ) a separable distribution given by
| (3) |
where is the charge of the capturing ion. In general, a statistical distribution is usually assumed to become dominate when the collision velocity is approximately half the orbital velocity of the captured electron Burgdörfer et al. (1986). At slower collision velocities the -distribution tends to be either even or peaked at intermediate -states, such as in the separable and LZ distributions above. At higher collision velocities, the -distribution migrates to preferentially higher -states that can lead to over-statistical distributions with a majority of captured electrons in the maximum -state Ryufuku and Watanabe (1979); Olson (1981); Green et al. (1982); Dijkkamp et al. (1984); Fritsch and Lin (1984); Kimura and Lin (1985); Toshima and Tawara (1995). None of the -distribution models above describe this over-statistical distribution condition.
Here we report the measurement of Lyman emission lines resulting from the CX interaction between C6+ and H2 using a high resolution microcalorimeter x-ray detector. From these measured emission lines, we investigate the effect of collision velocity on the state-selective -distributions during the capture process by determining line ratios between Lyman-alpha (Lα), Lyman-beta (Lβ) and Lyman-gamma (Lγ) emission lines.
Total CX cross sections for C6+ on H2 and He have been measured by Meyer et al. Meyer et al. (1985a, b) and Greenwood et al. Greenwood et al. (2001). Few state-resolved CX experiments, however, have been conducted for C6+ on H2. Dijkkamp et al. Dijkkamp et al. (1985) utilized vacuum ultraviolet (VUV) spectroscopy to investigate the state-resolved cross sections of CX for C6+, N6+ and O6+ on He and H2, however, their results for C6+ on H2 were inconclusive due to high relative uncertainties and unavoidable state degeneracies related the the observed emission lines. Hoekstra et al. Hoekstra et al. (1989) repeated the VUV measurements of Dijkkamp et al. with a refined experimental apparatus with specific aim to investigate the relative capture states via SEC and DCAI. Mack et al. E.M.Mack (1987); Mack et al. (1989) measured correlation effects of double capture between C6+ and H2. Recently, we reported high resolution Lyman emission measurements resulting from CX between C6+ and He using the microcalorimeter apparatus discussed here Defay et al. (2013). All of these previous results clearly show that even though H2 and He are both strict two-electron systems, the ionization potential of the target is the primary parameter that governs the -state capture. For the He target, the principal capture in C6+ is to , which is confirmed by the CBM. For H2, the principal capture state is , also confirmed by the CBM. In comparing our measured Lyman emission lines between CX with H2 and He we observe significantly different line ratios that suggest different -distributions over the same collision velocities. The particular -distributions, however, are not so easily estimated at different collision velocity regimes. It is the intent here to provide further information on the velocity dependence of CX between C6+ and H2 with regard to the capture -states. Given that no detailed theory exists for this collision system over this energy range, we are utilizing the -distribution models above to help describe the observed line ratios. These models are the most widely used by laboratory and astrophysical plasma modelers in accounting for charge exchange in the absence of rigorous theory. These models, while based on agreement with other collision systems, are approximations and are not a rigorous replacement for detailed theoretical calculations. For example, these -distribution models do not account for the quantum defect of -states which will vary based on principle quantum number and will impact the overall CX dynamics. To that end, we will present each of these models in comparison to our measured line ratios as a function of collision velocity. We will also incorporate the overall distribution of the relative -state capture cross sections to account for SEC and DCAI.
II Experiment
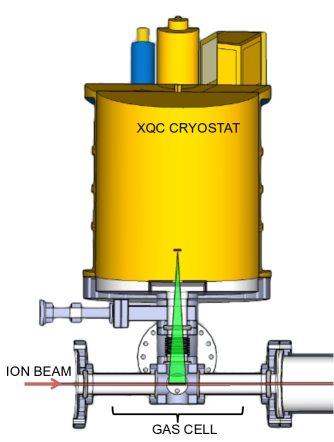
The charge exchange emission spectra of C6+ on H2 were measured by adapting the ion-atom merged beams apparatus at Oak Ridge National Laboratory Draganic et al. (2011) with an X-ray microcalorimeter detector from the University of Wisconsin and Goddard Space Flight Center sounding rocket experiment to measure Lyman emission from the resulting H-like C5+ ion. A schematic of the experimental apparatus can be seen in Fig. 1 and has been discussed previously Defay et al. (2013). The ion beam of 13C6+ was produced by an electron cyclotron resonance (ECR) ion source with 13CO as the working gas. Isotopic carbon was selected to avoid ion beam contamination from similar mass-to-charge ratios. The 13C6+ ion beam was extracted from the ECR ion source at 17.75 kV and momentum analyzed by a 90∘ dipole magnet. The ion source and analyzing magnet beam line are situated on a variable potential platform which can be operated in acceleration (positive potential) or deceleration (negative potential) mode to achieve the desired final ion beam energies. For this work, the final ion beam energies ranged from 1 – 30 keV/amu (400 – 2300 km/s).
Approximately 10 – 30 nA of C6+ ions were incident on a gas cell interaction volume (20 cm long) as shown in Fig. 1. The H2 target gas was introduced into the gas cell volume via a leak valve with the total pressure being monitored via a nude Bayard-Alpert ion gauge and a quadrapole residual gas analyzer (SRS RGA100). The background pressure in the cell was Pa ( Torr). The gas cell was held at a total pressure of Pa ( Torr) during data acquisition. Due to the thermal recovery time of the detector between events, the pressure in the gas cell was adjusted slightly to restrict the x-ray count rate of the detector to Hz for given ion beam currents.
The X-ray Quantum Calorimeter (XQC) detector has been described in detail elsewhere McCammon et al. (2002, 2008) so only a brief overview will be given here. The XQC is a 6 x 6 array of microcalorimeters with HgTe absorbers each 2.0mm x 2.0mm x 0.7m. This array is situated in conjunction to an adiabatic demagnetization refrigerator resulting in a final operating temperature of 50 mK. The XQC was mounted to the interaction gas cell at 90∘ with respect to ion beam propagation, at a distance of 23 cm from beam line center. Because of the finite size of the detector array and the physical mounting limitations, only a limited portion (2 cm) of the gas cell was viewable by the detector. This is shown schematically by the viewing cone in Fig. 1. The ions passed through this limited viewing distance in 10 – 50 ns, for the given range of velocities investigated. This allowed for detection of prompt x-rays only due to charge exchange.
The effect of polarization due to capture to different -states is not accounted for in our analysis. An isotropic emission is assumed, but it has been shown by others with a similar 90∘ detector orientation that this can lead to a maximum error (for fully polarized emission) of no more than 30% and that typically less than 15% is observed Dijkkamp et al. (1985); Hoekstra et al. (1989); Greenwood et al. (2001).
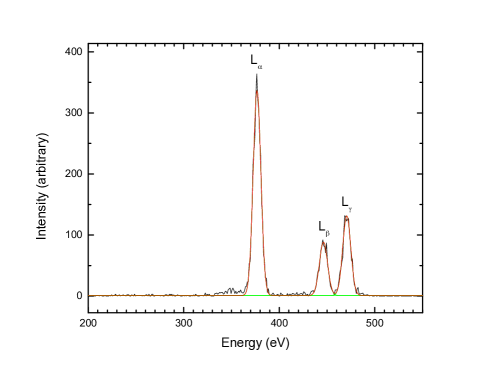
Figure 2 shows a typical x-ray spectrum recorded by the XQC for C6+ on H2 at a collision velocity of 400 km/s. Similar spectra were recorded over the range of collision velocities and each of the observed Lyman emission lines was peak fitted to obtain the integrated intensity of each emission line. A background spectrum, with no target gas in the gas cell, was taken at each energy to verify that there was no observable charge exchange contribution from the base residual gas of the gas cell. As can been seen in Fig. 2, the full width half maximum (FWHM) line resolution of the XQC is approximately 10 eV. Because of various filters built into the XQC, the fitted line intensities must be corrected to account for energy-dependent transmission. This was done before final Lyman line ratios were determined. The net detection efficiencies for Lα, Lβ and Lγ lines are 0.065, 0.124 and 0.153, respectively.
III Results and Discussion
From Fig. 2, and the emission spectra recorded at other interaction velocities, we observed that only the Lα, Lβ and Lγ emission lines contributed due to charge exchange. There was no observation of Lyman- or higher lines, which suggests that only principle quantum states up to significantly contributed, in agreement with the CBM and the experimental VUV results of Dijkkamp et al. Dijkkamp et al. (1985). The results of Hoekstra et al. Hoekstra et al. (1989) suggest a small (%) contribution from capture to .
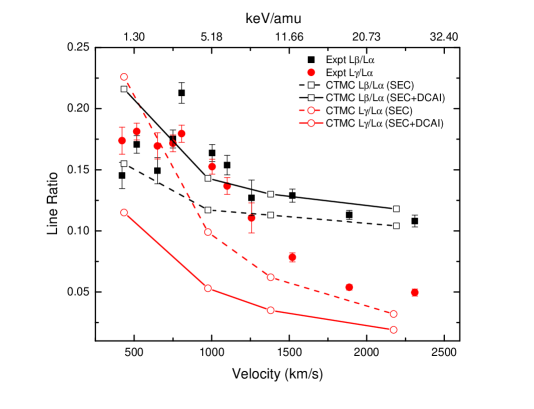
Figure 3 shows the line emission ratios of Lβ/Lα and Lγ/Lα as a function of collision velocity determined from the measured x-ray spectra. The Lβ/Lα line ratios show a slight oscillatory behavior below 800 km/s with a peaked line ratio at 800 km/s. It is unclear how this oscillation and peaking behavior is connected to a physical phenomenon without guidance from a more rigorous theoretical investigation. It is more likely caused by a systematic uncertainty that is somehow not accounted for in the experiment. Above 800 km/s there seems to be a decreasing trend in the Lβ/Lα line ratio with respect to increasing collision velocity.
The Lγ/Lα line ratios shown in Fig. 3 exhibit fairly constant values below 800 km/s and clearly decrease with increasing collision velocity. At the highest measured velocity the Lγ/Lα line ratio is significantly less than the Lβ/Lα line ratio although they had comparable values at the lower collision velocities.
If we consider only populating 2, 3 or 4 in CX, and the resulting radiative cascades, the relative probabilities of producing Lα, Lβ and Lγ line emission due to CX to C6+ can be determined by
| (4) | |||||
| (5) | |||||
| (6) |
where is the relative cross section for an electron being captured to principle quantum state . The relative weighting factor of each state is given by sn,l (the relative -distribution normalized for each ), radiative transition A-values from state to are given as (these values are given in Table I) and the total decay rate via all paths from a given state is given by .
| () | () | A [s-1] |
|---|---|---|
| (2,1) | (1,0) | |
| (3,0) | (2,1) | |
| (3,1) | (1,0) | |
| (3,1) | (2,0) | |
| (3,2) | (2,1) | |
| (4,0) | (2,1) | |
| (4,0) | (3,1) | |
| (4,1) | (1,0) | |
| (4,1) | (2,0) | |
| (4,1) | (3,0) | |
| (4,1) | (3,2) | |
| (4,2) | (2,1) | |
| (4,2) | (3,1) | |
| (4,3) | (3,2) |
From these calculated emission probabilities, the line ratios Lβ/Lα and Lγ/Lα can then be determined for specific weighting factors and relative cross sections for CX resulting in an electron in 2, 3 or 4. These can then be compared to the line ratios shown in Fig. 3 to gauge the -distribution model that best describes the Lyman line emission at different collision velocities.
Based on the CBM predictions, the majority of SEC is to . In their VUV emission measurements of CX between C6+ and H2, Dijkkamp et al. Dijkkamp et al. (1985) showed that approximately 90% of the total capture cross section was to with an upper limit of approximately 10% for capture to . Hoekstra et al. Hoekstra et al. (1989) suggested that 67% of SEC capture is to and 6% to with 3% to and approximately 25% to DCAI.
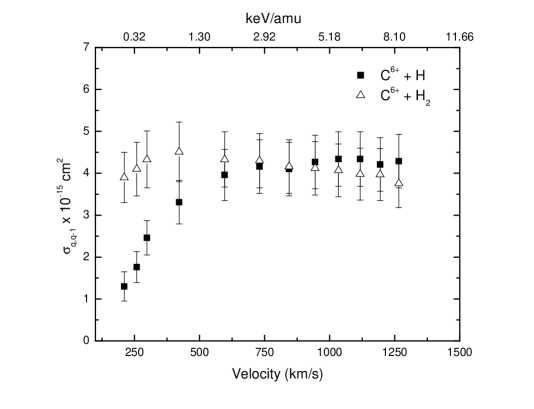
In order to gauge the possible contribution of DCAI at the lower collision velocities, we look to the total CX cross sections between C6+ on H2 and H measured by Meyer et al. Meyer et al. (1985a). As can been seen in Fig. 4, the absolute CX cross sections from H2 and H are essentially the same above 500 km/s, considering the uncertainty. However, slower collision velocities show a significant decrease in the CX cross section from H while the cross section from H2 remains relatively unchanged. Given that these measurements could not distinguish SEC and DCAI, it is likely that DCAI is a significant contributor to the cross section difference observed at the slower velocities.
In corresponding to the low end of our collision energy range, approximately 1.30 kev/amu, we determine the ratio of absolute cross section measurements of CX against H and H2 from the data of Meyer et al. to be H:H2=. This suggests a DCAI contribution of . The overall trend from the data of Meyer et al. suggests that the DCAI contribution decreases significantly with increasing collision energy.
Mack et al. E.M.Mack (1987); Mack et al. (1989) have shown that the principal double capture states are of the form and with being significantly more dominant which results in an electron in a state. In terms of the Lyman emission measurements presented here, this would lead to a relative increase of Lα for those DCAI events resulting in population of the state.
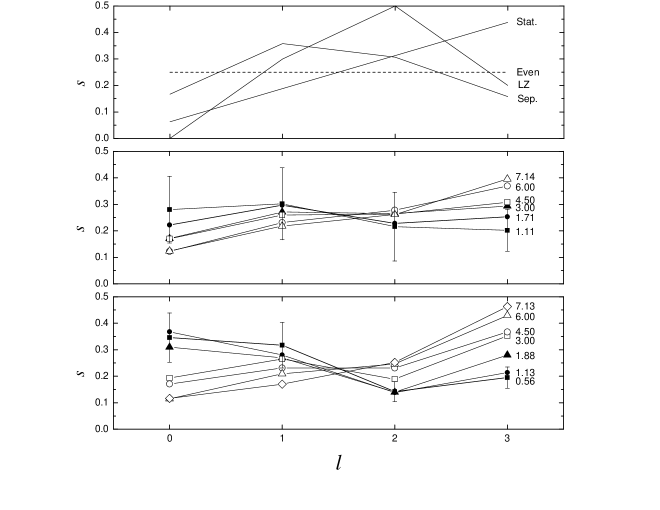
The upper pane of Fig. 5 illustrates the relative weighting factors, s4,l, for the different -distribution models discussed in the Introduction. In Table II, we show the line ratios determined by substituting these -distribution models into Eqns. 4–6 and considering only SEC to . As can been seen, none of these calculated line ratios agree with those shown in Fig. 3 over the range of velocities measured. This suggests that sole SEC to is not an adequate description of the overall CX and that some combination of capture to and 3 is necessary.
| -distribution Model | Lβ/Lα | Lγ/Lα |
|---|---|---|
| Even | 0.249 | 0.355 |
| Statistical | 0.130 | 0.221 |
| Landau-Zener | 0.192 | 0.431 |
| Separable | 0.261 | 0.603 |
| C6++H (1 keV/amu) | 0.202 | 0.350 |
| C6++H (25 keV/amu) | 0.070 | 0.101 |
In evaluating the -distribution model most applicable at the low collision velocities, we consider the VUV measurements of Dijkkamp et al. Dijkkamp et al. (1985). The middle and lower panes of Fig. 5 show the relative weighting factors of the different -states in for N6+ on H2 and O6+ on H2, respectively, at various collision energies. Dijkkamp et al. measured the cross section directly from their VUV line emission observations. The total cross section is derived by summing these state-specific cross sections. Dijkkamp et al. report uncertainties ranging from 20–50% for various cross section measurements. These naturally carry over into the total cross section uncertainty. In determining the weighting factors shown in Fig. 5, the ratio of the state-specific cross section to the total cross section was taken. The resulting uncertainties were then weighted accordingly and added in quadrature to determine the relative uncertainties shown in Fig. 5 attached to the lowest energy data set for each ion. In displaying just one of the error bars sets for each ion it is the intention to convey the relative uncertainty inherent to their data across the different collision energies.
In comparing the -distributions with the model distributions in the upper pane of Fig. 5, it can be seen that the relative uncertainties prevent any clear indication of which -distribution model is most appropriate, however, the data for O6+ seems to show a trend of transitioning from a low- distribution at the lowest collision energies towards a more statistical distribution at higher collision energies. Given the uncertainty, there is clearly an increase in the population of as the collision velocity increases which indicates that the lower -state populations must be shifting to higher , as the overall trend seems to suggest.
The N6+ data, given the uncertainty, seems to be more reflective of an even -distribution across the collision energies with perhaps a slight transition towards a more statistical distribution at higher collision energies. This, along with the O6+ data, is perhaps suggesting a trend towards a more even/statistical -distribution for C6+ at the lower end of our observed collision energies. The average of our observed line ratios for Lβ/Lα and Lγ/Lα at lower collision velocities and their disparity with the different -distribution models for SEC to only, as shown in Table II, suggests that we do not observe the amount of CX to and states predicted by -distributions peaked at low -states, such as in the LZ and Separable -distribution models. The overall trend of the Dijkkamp et al. data seems to suggest this as well. This points to the statistical -distribution model as the appropriate in this collision velocity regime. It should also be noted that the collision velocity in this range corresponds with approximately half the orbital velocity of the captured electron, which is typically considered to result in a statistical -distributionBurgdörfer et al. (1986).
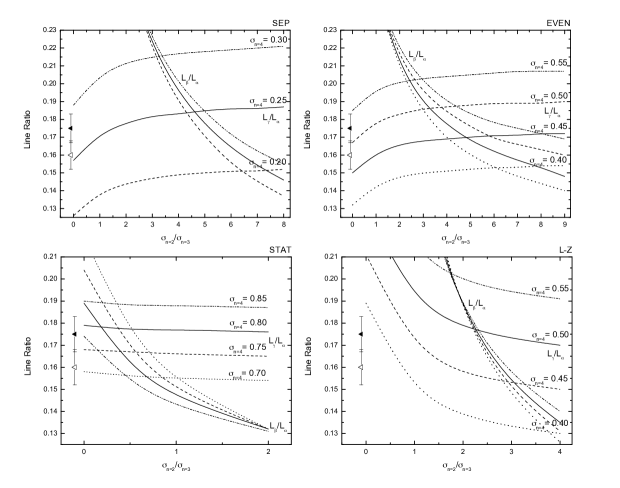
To further illustrate the effect that the different -distribution models have on the Lβ/Lα and Lγ/Lα line ratios, we can now consider the relative cross sections to 3 and 4 via SEC and a possible contribution to via DCAI at low collision velocities by comparing to calculated line ratios using the various -distribution models from the Introduction and comparing to our observed mean line ratios below a collision velocity of 800 km/s.
Each pane of Fig. 6 illustrates two forms of partitioning simultaneously for each -distribution model. Each pair of linetypes in the various plots represents the calculated (from Eqns. 4–6) Lβ/Lα and Lγ/Lα line ratios for a fixed relative cross section for population of (primary SEC capture state). The remaining relative cross section contribution is then distributed between and 3 as shown by the ratio of in each plot. We have selected the different relative cross sections for in discrete steps to match the range of our observed line ratios and to give an idea of the overall behavior. Values can be interpolated as needed.
From the separable -distribution data in Fig. 6 it can be seen that to achieve line ratios consistent with the observed Lβ/Lα and Lγ/Lα line ratios, a relative cross section of 0.23–0.24 would be required along with a of 5–6, suggesting a relative contribution, from DCAI, on the order of 0.60 and a SEC contribution to of approximately 0.17. Based on the absolute cross section data of Meyer et al. this model seems to suggest a considerably smaller relative cross section and a considerably larger DCAI contribution. This DCAI contribution is also larger than the upper limit recommendation of Hoekstra et al. (25%) and seems to be at odds with the overall trend in the data of Meyer et al. at the given collision velocity.
The even -distribution data in Fig. 6 shows that a relative cross section of 0.45–0.47 along with of 5–8 yields line ratios comparable to our observed line ratios at low collision velocities. This corresponds to a relative DCAI contribution of 0.45–48. This is also considerably more than is suggested from the absolute measurement of Meyer et al. and the upper limit suggested by Hoekstra et al. This, however, is one of the likely -distributions that seems to agree with the weighting factors derived from the data of Dijkkamp et al. shown in Fig. 5.
The LZ -distribution data in Fig. 6 shows that a relative cross section of 0.50 and a corresponding of 2.5–3.0 agrees well with the observed line ratios. This suggests a relative DCAI contribution of approximately 0.36 which is just within the uncertainty range for the DCAI contribution determined from the data of Meyer et al. but is still larger than the upper limit suggested by Hoekstra et al.
The statistical -distribution data in Fig. 6 shows that a relative cross section of approximately 0.80 and a correspond 0.4–0.6 agrees well with the observed line ratios. This suggests a relative DCAI contribution of approximately 0.07 and a relative contribution of 0.13. The relative contribution is in agreement with that of Dijkkamp et al. (10%) and is twice that suggested by Hoekstra et al. (6%). The relative DCAI contribution () is considerably less than the suggested upper limit of 25% by Hoekstra et al. but seems to be in agreement with the absolute cross section data of Meyer et al. We would also like to point out that the statistical -distribution is also one of the likely suggested models that corresponds to the -distribution data of Dijkkamp et al. In light of all of the results from these models in comparison to the absolute measurements of Meyer et al. and the experimental data of Dijkkamp et al. and Hoekstra et al. The statistical -distribution seems the most likely model to describe our observed line ratios below 800 km/s. It would, however, be desirable for more complete theoretical models to verify if this is a proper description of the CX dynamics for this collision system.
If we assume a statistical -distribution model to describe our observed line ratios at the low collision velocities, then we can assume that at higher collision velocities that higher -state populations will increase leading to a more over-statistical distribution. Since we don’t have a model function to guide an investigation of that description of the observed CX, we can compare to CX data for C6+ on H. This is a single electron system but the absolute CX cross section data of Meyer et al. suggests that at higher collision velocities the cross sections are comparable and thus no considerable contribution from DCAI is expected. The absolute measurements will also have taken into account the small contribution of SEC to in the H2 case.
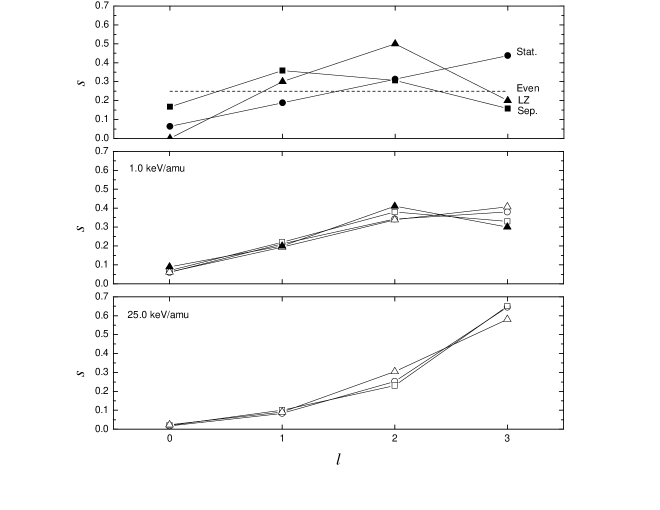
In the comparison of the resulting -distributions for capture to in CX between C6+ and H2 and H at different energies, it is expected that the relative -state populations will be slightly different given the ionization potential difference between H2 and H. For the H target at 1 keV/amu, approximately 90% of the total capture cross section is to while at 25 keV/amu, capture to becomes a substantial part of the total cross section. Figure 7 shows the relative -distributions for the manifold from the data of Toshima & Tawara Toshima and Tawara (1995), Fritsch & Lin Fritsch and Lin (1984), Green et al. Green et al. (1982) and Kimura & Lin Kimura and Lin (1985) at 1 keV/amu and 25 keV/amu collision energies. This range is comparable with our measured lower and upper energy range. As can bee seen in Fig. 7, the H data at 1 keV/amu suggests that the statistical and LZ -distributions are most predominant while at 25 keV/amu, the -distribution population is peaked at the maximum -state, suggesting a transition to an over-statistical distribution. As a comparison, Table II shows the Lβ/Lα and Lγ/Lα line ratios calculated using the n=4 -distribution data of Fritsch & Lin for capture from atomic hydrogen at 1 keV/amu and 25 keV/amu. At 1 keV/amu, the calculated line ratios are similar to the those obtained from the LZ model. At 25 keV/amu, the line ratios are closer to those observed for capture from H2 and are indicative of the trend to capture to higher angular momentum states at higher collision energy. We note that at the higher collision energy, the predominant capture to maximum angular momentum leads to increased Lα emission and thus lower overall line ratios with respect to Lα, as would be expected.
Finally, Figure 3 shows the results of preliminary CTMC calculations for both the Lβ/Lα and Lγ/Lα line ratios Stancil and Schultz (2013); Hasan et al. (2001). As pointed out previously, the CTMC method is expected to be most applicable at the higher collision velocities. The calculations are done for the cases of SEC only and for SEC in combination with DCAI and TI, although the TI cross section contribution is an order of magnitude less than the DCAI contribution and is considered negligible. As can be seen in Fig. 3 at the higher collision velocities, the CTMC results are in relatively good agreement with the line ratios determined from the experiment and tend to be independent of the DCAI contribution, which is reasonable given that DCAI is expected to fall off quickly with increasing collision velocity. At the low collision velocities, the CTMC results do not agree with either the Lβ/Lα or Lγ/Lα line ratios. This is likely an indication that the applicability of the CTMC model in this collision range is not appropriate.
IV Conclusion
State-specific CX cross sections have been known to be highly dependent on collision velocity, however, it is still relatively difficult to predict emission spectra using the predominant -distribution models put forth in the literature. From our measured high resolution x-ray emission spectra for CX between C6+ and H2, we observe comparable Lβ/Lα and Lγ/Lα line ratios at low collision velocities that decrease with increasing collision velocity.
Previous absolute cross section measurements and VUV line emission experimental results provide some guidance towards applicable -distribution models but are not conclusive. In comparing our observed line ratios with calculated line ratios using the separable, even, Landau-Zener and statistical models we determine that the statistical model best describes line emission at the low end of our observed collision velocities. This implies a transition to a more over-statistical -distribution at higher collision velocities. There is, however, an impelling case for more rigorous theoretical models to investigate this collision system over this velocity range to determine the range of applicability for different theoretical approaches.
References
- Hulse et al. (1980) R. Hulse, D. Post, and D. Mikkelsen, J. Phys. B 13, 3895 (1980).
- Mattioli et al. (1989) M. Mattioli, N. Peacock, H. Summers, B. Denne, and N. Hawkes, Phys. Rev. A 40, 3886 (1989).
- Isler (1994) R. Isler, Plasma Phys. Control. Fusion 36, 171 (1994).
- Lisse (1996) C. Lisse, Science 274, 205 (1996).
- Cravens (1997) T. Cravens, Geophys. Res. Lett. 24, 105 (1997).
- Beiersdorfer et al. (2001) P. Beiersdorfer, C. Lisse, R. Olson, G. Brown, and H. Chen, Astrophys. J. 549, L150 (2001).
- Ryufuku et al. (1980) H. Ryufuku, K. Sasaki, and T. Watanabe, Phys. Rev. A 21, 745 (1980).
- Simcic et al. (2010) J. Simcic, D. Schultz, R. Mawhorter, J. Cadez, J. Greenwood, A. Chutjian, C. Lisse, and S. Smith, Phys. Rev. A 81, 062715 (2010).
- Fritsch and Lin (1986) W. Fritsch and C. Lin, J. Phys. B 19, 2683 (1986).
- Kimura and Olson (1986) M. Kimura and R. Olson, J. Phys. B 17, L713 (1986).
- Smith et al. (2012) R. Smith, A. Foster, and N. Brickhouse, Astron. Nachr. 333, 301 (2012).
- Janev and Winter (1985) R. K. Janev and H. Winter, Phys. Rep. 117, 265 (1985).
- Burgdörfer et al. (1986) J. Burgdörfer, R. Morgenstern, and A. Niehaus, J. Phys. B: At. Mol. Opt. Phys. 19, L507 (1986).
- Ryufuku and Watanabe (1979) H. Ryufuku and T. Watanabe, Phys. Rev. A 20, 1828 (1979).
- Olson (1981) R. Olson, Phys. Rev. A 24, 1726 (1981).
- Green et al. (1982) T. Green, E. Shipsey, and J. Browne, Phys. Rev. A 25, 1364 (1982).
- Dijkkamp et al. (1984) D. Dijkkamp, A. Brazuk, A. Drentje, F. de Heer, and H. Winter, J. Phys. B: At. Mol. Opt. Phys. 17, 4371 (1984).
- Fritsch and Lin (1984) W. Fritsch and C. Lin, Phys. Rev. A 29, 3039 (1984).
- Kimura and Lin (1985) M. Kimura and C. Lin, Phys. Rev. A 32, 1357 (1985).
- Toshima and Tawara (1995) N. Toshima and H. Tawara, Tech. Rep., NIFS-DATA-26 (1995).
- Meyer et al. (1985a) F. W. Meyer, A. Howald, C. Havener, and R. Phaneuf, Phys. Rev. A 32, 3310 (1985a).
- Meyer et al. (1985b) F. W. Meyer, A. Howald, C. Havener, and R. Phaneuf, Phys. Rev. Lett. 54, 2663 (1985b).
- Greenwood et al. (2001) J. Greenwood, I. Williams, S. Smith, and A. Chutjian, Phys. Rev. A 63, 062707 (2001).
- Dijkkamp et al. (1985) D. Dijkkamp, Y. S. Gordeev, A. Brazuk, A. Drentje, and F. de Heer, J. Phys. B: At. Mol. Opt. Phys. 18, 737 (1985).
- Hoekstra et al. (1989) R. Hoekstra, D. Ciric, F. de Heer, and R. Morgenstern, Phys. Scripta T28, 81 (1989).
- E.M.Mack (1987) E.M.Mack (1987), thesis, R. U. Utrecht.
- Mack et al. (1989) M. Mack, J. Nijland, P. Straten, A. Niehaus, and R. Morgenstern, Phys. Rev. A 39, 3846 (1989).
- Defay et al. (2013) X. Defay, K. Morgan, D. McCammon, D. Wulf, V. Andrianarijaona, M. Fogle, D. Seely, I. Draganic, and C. Havener, Phys. Rev. A 88, 052702 (2013).
- Draganic et al. (2011) I. Draganic, D. Seely, and C. Havener, Phys. Rev. A 83, 054701 (2011).
- McCammon et al. (2002) D. McCammon, R. Almy, E. Apodaca, W. B. Tiest, W. Cui, S. Deiker, M. Galeazzi, M. Juda, A. Lesser, T. Mihara, et al., Astrophys. J. 576, 188 (2002).
- McCammon et al. (2008) D. McCammon, K. Barger, D. Brandl, R. Brekosky, S. Crowder, J. Gygax, R. Kelley, C. Kilbourne, M. Lindeman, F. Porter, et al., J. Low Temp. Phys. 151, 715 (2008).
- Stancil and Schultz (2013) P. Stancil and D. Schultz (2013), private communication.
- Hasan et al. (2001) A. Hasan, F. Eissa, R. Ali, D. Schultz, and P. Stancil, Astrophys. J. 560, L201 (2001).