Observation of Energetic particles between a pair of Corotating Interaction Regions
Abstract
We report observations of the acceleration and trapping of energetic ions and electrons between a pair of corotating interaction regions (CIRs). The event occurred in Carrington Rotation 2060. Observed at spacecraft STEREO-B, the two CIRs were separated by less than days. In contrast to other CIR events, the fluxes of energetic ions and electrons in this event reached their maxima between the trailing-edge of the first CIR and the leading edge of the second CIR. The radial magnetic field () reversed its sense and the anisotropy of the flux also changed from sunward to anti-sunward between the two CIRs. Furthermore, there was an extended period of counter-streaming suprathermal electrons between the two CIRs. Similar observations for this event were also obtained for ACE and STEREO-A. We conjecture that these observations were due to a “U-shape” large scale magnetic field topology connecting the reverse shock of the first CIR and the forward shock of the second CIR. Such a disconnected U-shaped magnetic field topology may have formed due to magnetic reconnection in the upper corona.
1 Introduction
Corotating interaction regions (CIRs) are commonly found during solar minimum. They are formed when fast solar wind (often from coronal holes) overtakes slow solar wind (often from near a streamer belt) (Kreiger et al., 1973; Feldman et al., 1981; Gosling et al., 1981). Because the slow and fast winds are two plasmas of different magnetic origin, there is a stream interface between them and two shock waves can form with a forward shock propagating into the slow wind and a reverse shock propagating into the fast wind (but both carried outwards by the solar wind) (Smith & Wolfe, 1976; Pizzo, 1985). The shock waves are often formed beyond 1 AU (Smith & Wolfe, 1976; Pizzo, 1985). However, recent studies showed that CIR shocks can form as close as AU (Jian et al., 2006).
CIRs and the associated shocks are a major source of energetic particle acceleration in the interplanetary medium; (e.g., Van Hollebeke (1981); Tsurutani et al. (1982)). Indeed, during solar minimum when the coronal mass ejection (CME) rate is low, CIRs are the dominant source of energetic particles in the interplanetary medium at 1 AU (for recent reviews; see, e.g., Fisk & Jokipii (1999); Gosling & Pizzo (1999); Mason & Sanderson (1999); Scholer (1999); Richardson (2004)). These energetic particles have approximately a solar wind composition up to a few MeV nucleon-1, and sometimes to - MeV nucleon-1, indicating that they are accelerated from the solar wind (e.g. Mason & Sanderson (1999)). However, examination of particles such as He+ and 3He showed that they are more abundant in the CIRs than in the uncompressed solar wind, suggesting that the interplanetary suprathermal ion pool also contributes (e.g., Gloeckler et al (1994); Mason et al (2000); Möbius et al (2002); Mason et al. (2008a)). Furthermore, recent observations by Mason et al. (2012) found that the heavy ion abundances show a clear correlation with sunspot number, where heavy ions are more enhanced during active periods. Although the acceleration likely occurs at CIR shocks, how the population of seed particles is injected into the shock remains not well understood. Electrons are also accelerated to several hundred keV in CIRs, particularly at distances beyond 1 AU. (Simnett & Roelof, 1995; Simnett, 2003).
The peak fluxes in CIRs often occur at the reverse and forward shocks, with fluxes at the reverse shock generally being larger (Heber et al., 1999; Mason & Sanderson, 1999). For example, in a recent survey of 50 CIRs between 2007 February and 2008 September, Bučík et al. (2009b) found that in 90% of the events the peak flux of energetic helium occurred within the compressed region or the trailing edge. In the remaining 10% of the events, the peak flux occurred within hours of the trailing edge. Ebert et al. (2012) also confirmed this result. Note that even if there are no shocks associated with the CIRs, as long as there is significant local compression near the CIRs, particles are subject to acceleration (Desai et al., 1998; Giacalone et al., 2002). Indeed, Desai et al. (1998) showed that, for CIRs near 5 AU, the local compression ratio was a key factor in determining the intensity of ∼1 MeV protons, regardless of whether or not the CIR was bounded by shocks. Ebert et al. (2012) showed a similar result for Mev/nucleon Helium ions for CIRs at 1 AU.
The solar wind suprathermal electron population (in the 70 to 2000 eV range) is typically made of the “halo” population (generally tenuous and isotropic) and the “strahl”, an intense beam of suprathermal electrons aligned to the magnetic field and directed outward from the Sun. Owing to their large mean-free path, suprathermal electrons travel freely along magnetic field lines, and are therefore used as tracers of the large-scale heliospheric topology (e.g., Gosling (1990); Kahler (1987)). Although this population is usually dominated by the outward-flowing strahl, sunward-directed counter-streaming suprathermal electrons are also often recorded in the solar wind. These are observed on closed field lines with both ends attached to the Sun, such as within interplanetary coronal mass ejections (ICMEs) (e.g., Philipp (1987); Gosling et al. (1987)) or newly closed field regions due to magnetic reconnection at the heliospheric current sheet (HCS) (Gosling et al. (2006); Lavraud et al. (2009)). Counter-streaming suprathermal electrons may also occur due to the presence of magnetic field enhancements farther from the spacecraft along magnetic field lines, e.g., within CIRs, near their bounding shocks and to some distance downstream. The counterstreaming population in such cases is thought to result from wave-particle interactions and shock heating, combined with adiabatic mirroring and particle leakage into the upstream regions of the CIR (Gosling et al. (1993); Steinberg et al. (2005); Skoug et al. (2006); Lavraud et al. (2010)).
Because of the wavy nature of the interplanetary current sheet, multiple CIRs can form in a single solar rotation. Will the presence of multiple CIRs affect the particle acceleration process? In this paper, we report, to our knowledge, the first observation of an energetic particle event associated with a CIR pair.
2 Observations
In this work, we use the data from STEREO’s IMPACT instrument suite (Luhmann et al., 2008). These include protons between keV nucleon-1 to MeV nucleon-1 and electrons from keV to keV from the Solar Electron and Proton Telescope (SEPT) (Müller-Mellin et al., 2008); - MeV protons from 16 sectors of the Low Energy Telescope (LET) (Mewaldt et al., 2008); keV nucleon-1 to MeV nucleon-1 proton, Helium, Oxygen, and Fe ions from the Suprathermal Ion Telescope (SIT) (Mason et al., 2008b); and eV electrons from the Solar Wind Electron Analyszer (SWEA) (Sauvaud et al., 2008). We also used the Plasma and Suprathermal Ion Composition (PLASTIC) sensor (Galvin et al., 2008) for solar wind proton parameters including the speed, number density, and total pressure. The solar wind magnetic field is from the IMPACT/MAG instrument (Acuña et al., 2008). We also used data from ACE/MAG (Smith et al., 1998), ACE/SWEPAM (McComas et al., 1998), and ACE/EPAM (Gold et al, 1998).
We define a CIR pair as two CIRs such that the end of the first CIR and the beginning of the second CIR are within days. A total of CIR pairs were identified in the two-year period of 2007 and 2008. The CIR pair we examine in this work occurred during Carrington Rotation (CR) 2060.
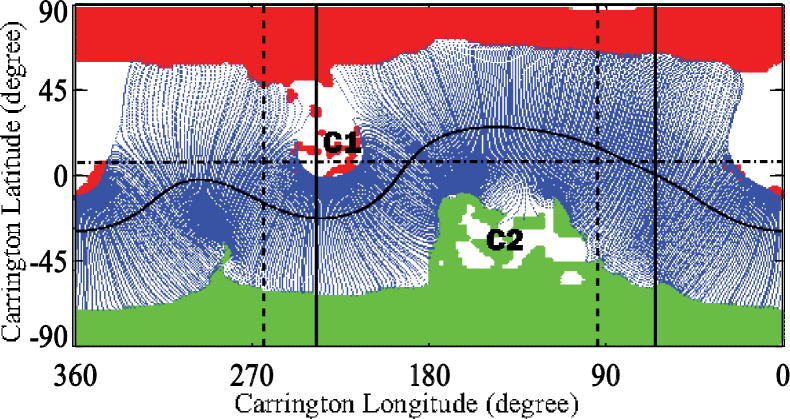
Figure 1 shows the trajectories (the dot-dashed curve above the equator) of the three spacecraft (STEREO-B, ACE and STEREO-A) overplotted on the GONG PFSS magnetic extrapolation, with open field footprints in red/green, closed field at the source surface in blue, and heliospheric current sheet (HCS) at the source surface in black (courtesy of NSO/GONG) for the Carrington rotation 2060. The longitudinal separation between STEREO-A and STEREO-B was . The solid vertical lines mark the beginning and ending longitudes for STEREO-B. The dashed vertical lines mark the beginning and ending longitudes for STEREO-A. ACE was located half way between STEREO-A and STEREO-B. The coronal sources for the fast streams of the two CIRs are labeled as “C1” and “C2” in this plot.
STEREO-B in situ observations of the two CIRs from spacecraft are shown in Figure 2. From top to bottom, the panels in Figure 2 are: the proton pressure, the solar wind speed, the plasma number density, the solar wind magnetic field strength, the radial component of the magnetic field, and the ratio of helium to proton fluxes at - MeV nucleon-1, - MeV nucleon-1 and - MeV nucleon-1.
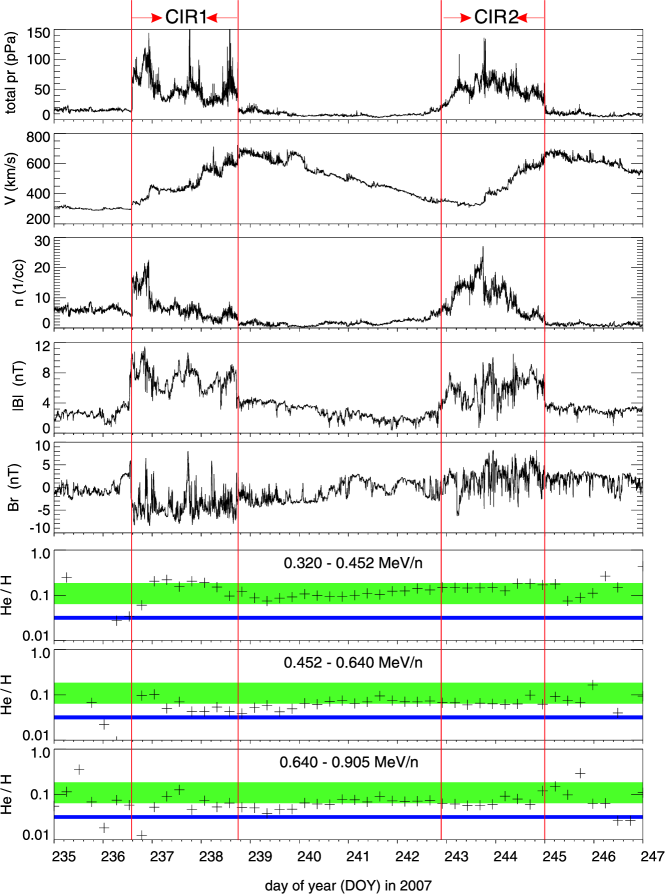
As shown in Figure 2, the first CIR (hereafter CIR1) occurred from 2007 August 24 (DOY 236), 14:16UT to 2007 August 26 (DOY 238), 18:10UT. The second CIR (hereafter CIR2) occurred from 2007 August 30 (DOY 242), 20:40UT to 2007 September 02 (DOY 245), 00:10UT. We note that this event has been reported as event No. 14 in Table 1 of Mason et al. (2009). Since there was only one peak in the ion time intensity profile, Mason et al. (2009) associated this with a single CIR. However, an examination of the solar wind profile shows that there were two CIRs. Lavraud et al. (2010) also listed them as two separate CIRs. Note that the separation angle between STEREO-A and STEREO-B at CIR mid-point at ACE for this event was (Mason et al., 2009), so both CIRs were observed by all three spacecraft.
We use sudden changes in total pressure and magnetic field to identify the boundaries (so they may correspond to the shocks) of the two CIRs. These are shown as the red vertical lines in Figure 2. CIR1 had both a forward shock and a reverse shock as can be seen from the STEREO-B observations 111note that the online catalog maintained by L. Jian http://www-ssc.igpp.ucla.edu/forms/stereo/stereo_level_3.html did not list the reverse shock of CIR1 as a shock. For CIR2, the reverse shock had completely formed at STEREO-B, but the forward shock had not.
The green and blue horizontal bars in the bottom three panels represent the typical ranges of helium to proton ratio found in CIRs (0.1250.061) and SEPs (0.0320.003), respectively (Mazur et al., 1993; Mason et al., 1997; Bučík et al., 2009a). These He/H ratios as well as the heavy ion ratios (not shown) clearly identify these energetic particles as being from a CIR.
Using the CDAW Data Center catalog (http://cdaw.gsfc.nasa.gov/CME_list/), and the Computer Aided CME Tracking (CACTus) catalog (http://sidc.oma.be/cactus/), as well as STEREO Level 3 data, we confirmed that the solar activity was weak between CIR1 and CIR2. During the period shown in Figure 2, there were no A2.0 flares, no high frequency (MHz) radio bursts, nor any fast CMEs (the only detectable CME occurred on the east limb with a speed of 162 km s-1 on DOY 239). With these observations, any in situ enhancement of energetic particles is unlikely due to solar activities and must be associated with the CIRs, as is consistent with the solar wind and magnetic field signatures in Figure 2.
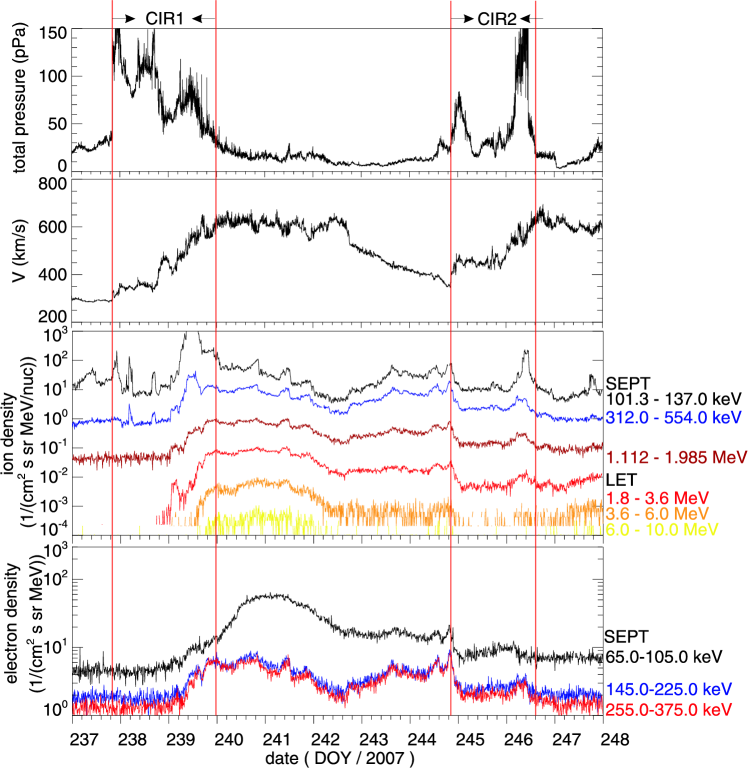
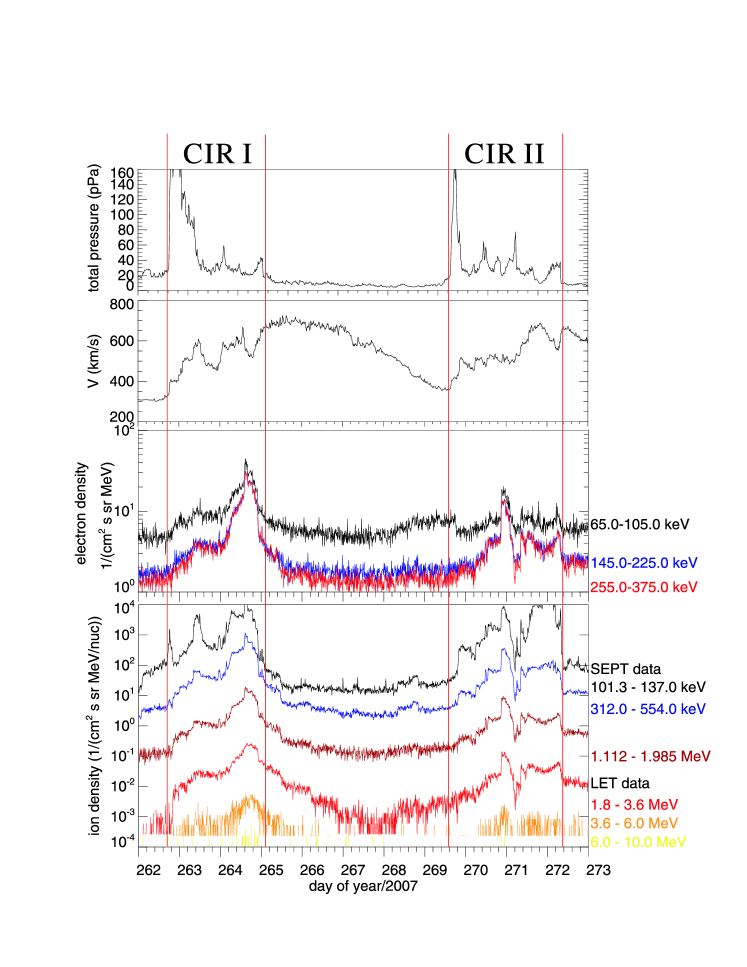
Figure 3 shows fluxes of energetic particles observed by STEREO-B during the period as shown in Figure 2. Panels 1 and 2 show the total pressure (the thermal pressure plus the magnetic field pressure) and the solar wind speed, as in Figure 2. The third panel shows the ion (mostly protons) intensities for energy channels. The fourth panel shows the electron intensity for three energy channels. As in Figure 2, the boundaries of CIR1 and CIR2 are indicated by the solid vertical red lines. The stream interfaces within the two CIRs are shown as the dashed vertical magenta lines. Four 8-hour intervals between the two CIRs, labeled “A”, “B”, “C”, and “D” are also indicated. These periods will be used to examine the helium spectra and proton anisotropies (see Figure 7 below).
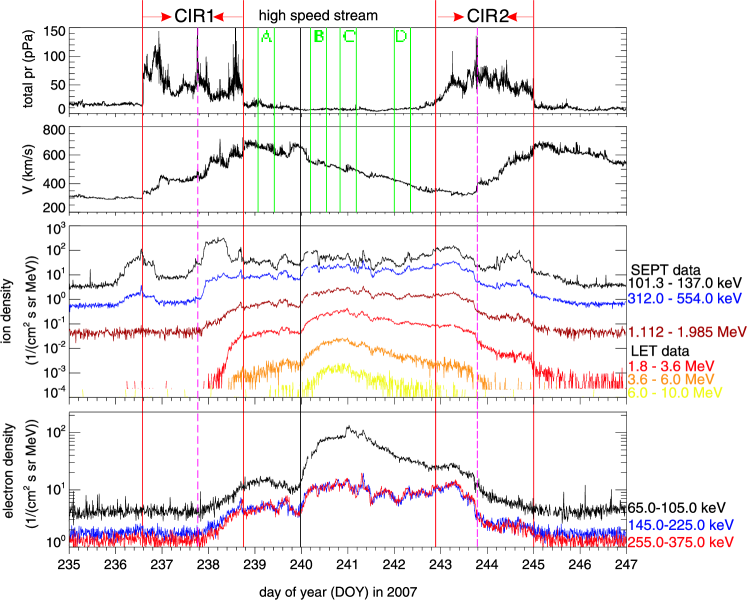
The third panel of Figure 3 shows that there were gradual but significant increases of ion fluxes in the - keV and - keV channels before the forward shock of CIR1. The intensities reached their peaks at the shock, then decayed to a plateau for a short period of time before they dropped at the beginning of day 237. The plateau feature is typical of diffusive shock acceleration and has been seen previously in CIR events (see eg. (Bučík et al., 2009a)). The drop inside CIR1 may be related to the increase in solar wind speed at the same time. STEREO-B crossed the stream interface (left dashed line) several hours before DOY 238, as shown by the left dashed line. Before the reverse shock of CIR1, the intensities in the - MeV and - MeV channels showed clear gradual increases which has also been seen in other CIR events (Bučík et al., 2009a). This is possible if the reverse shock was formed inside 1 AU. Across the reverse shock, the intensities of both the - MeV and - MeV ions slowly increased. The - MeV and - MeV channels also showed clear increases. Such increases contradict the scenario of diffusive shock acceleration at a single shock where one expects to see a decrease of intensity as the distance from the shock increases (see e.g. the work of Li et al. (2003, 2005); Verkhoglyadova et al. (2010)).
The gradual increase of the ion time intensity profiles lasted until DOY 241. These increases were modulated by a transient high-speed stream on DOY 240 (marked by the vertical black line). The modulation showed no velocity dispersion and therefore could be due to connectivity issue, as discussed in Bučík et al. (2009a) for a different event. The intensity peaks for all four channels occurred at the beginning of DOY 241. Beyond DOY 241, the intensities for the two highest energy channels started to decrease. Examination of Figure 2 shows that reversed its sign on DOY 241. The large scale magnetic field configuration turns out to be an important key in understanding this event. Below we examine the magnetic field configuration in detail, making use of the suprathermal electron observations.
At the leading edge of CIR2, the four highest energy ion channels showed no increases. This is consistent with the absence of a forward shock at CIR2. Across the stream interface (between DOY 243 and 244, as indicated by the right dashed magenta line), all intensities dropped significantly. Across the reverse shock of CIR2 at the beginning of DOY 245, the intensities showed further gradual decreases, as one would expect from diffusive shock acceleration in solar energetic particle events (Li et al., 2003, 2005; Verkhoglyadova et al., 2010).
The fourth panel in Figure 3 shows electron time intensity profiles for three energy channels, - keV, - keV, and - keV. Similar to the ion observations, the most striking feature is the enhancement of intensity in between the two CIRs. Indeed, for the - channel, the peak of the time intensity profile occurred near the middle of the two CIRs; for the - keV and - keV channels, the time intensity profiles between the two CIRs are plateau-like. Such a peak and/or plateau-like feature has not been previously reported for single CIR events.
The time intensity profiles of ions and electrons between the two CIRs as observed by STEREO-B are very unusual for CIR events. Since the same CIR was also observed by ACE and STEREO-A, we next examine the energetic particle observations at these spacecraft.
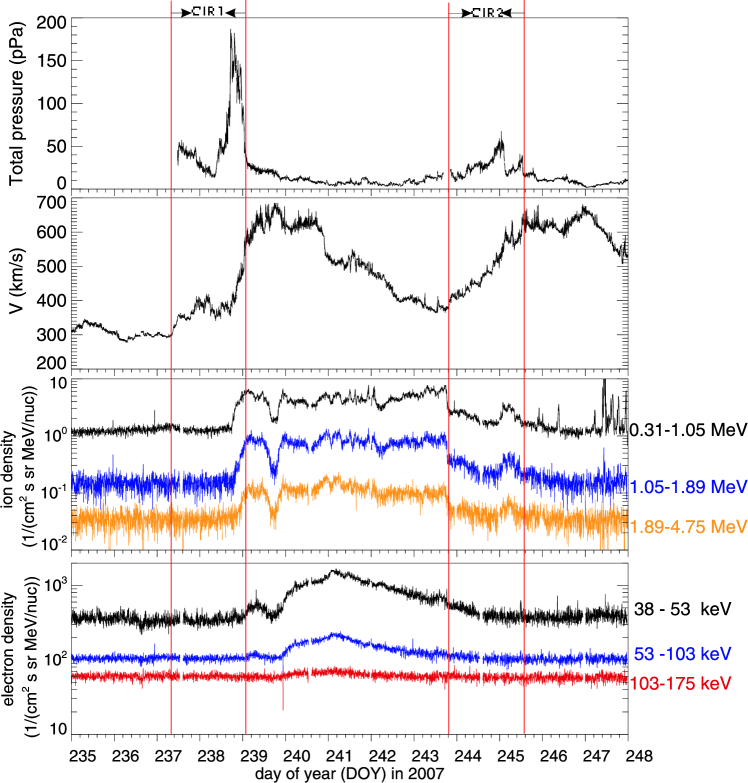
Figure 4 shows the ACE observations. The top panel shows the solar wind total pressure and the second panel shows the solar wind speed. The lack of pressure at the beginning of the period is due to a data gap. The third and fourth panels are ion and electron intensities from ACE/EPAM, respectively. Comparing to the STEREO-B observations, while the - keV and - keV electrons show clear peaks, the higher energy electrons (103-175 keV) and ions did not show clear peaks. The ion intensity remains almost constant.
Figure 5 shows the STEREO-A observations. As in Figure 4, the top two panels display the total solar wind pressure and the solar wind speed, respectively. The third panel shows the ion (mostly proton) intensities from SEPT and proton intensities from LET, while the fourth panel shows the electron intensities from LET. Again, there were no clear peaks in the low energy ions between the two CIRs. However, for high energy ions observed by LET (especially - MeV and - MeV channels), intensities gradually increased after CIR1, until the middle of DOY 241, and then quickly dropped. Compared to ions, electrons showed more pronounced peaks after CIR1.
SEP observations at ACE and STEREO-A showed similar unusual behavior, but less prominent. This is possible if the underlying cause for the STEREO-B observation is transient in nature and affects ACE and STEREO-A observation for a shorter period of time. Indeed, this is an important clue for understanding this event, as discussed later.
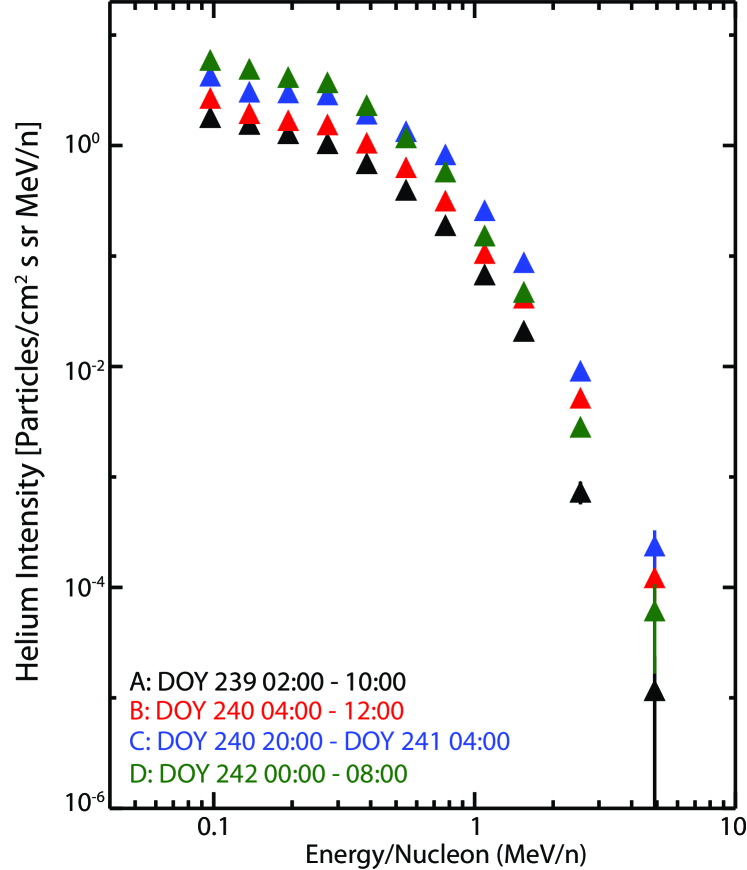
We now examine how the spectrum of energetic helium ions evolved in this event. Figure 6 shows the energetic helium spectra during the four 8-hour intervals, “A”, “B”, “C”, and “D” shown in Figure 3. For example, at MeV/nucleon, the helium intensity during period B (C) is about twice as large as in period A. At MeV/nucleon, the helium intensity during periods B and C is more than times larger than in period A. The spectrum for period D is similar to the spectrum for period A, but the intensity was higher. These spectral observations show that there are more high energy particles near the middle of the two shocks (periods B and C) than closer to the shocks (periods A and D). Note that period A is closer to the reverse shock of CIR1 and period D is closer to the forward shock of CIR2.
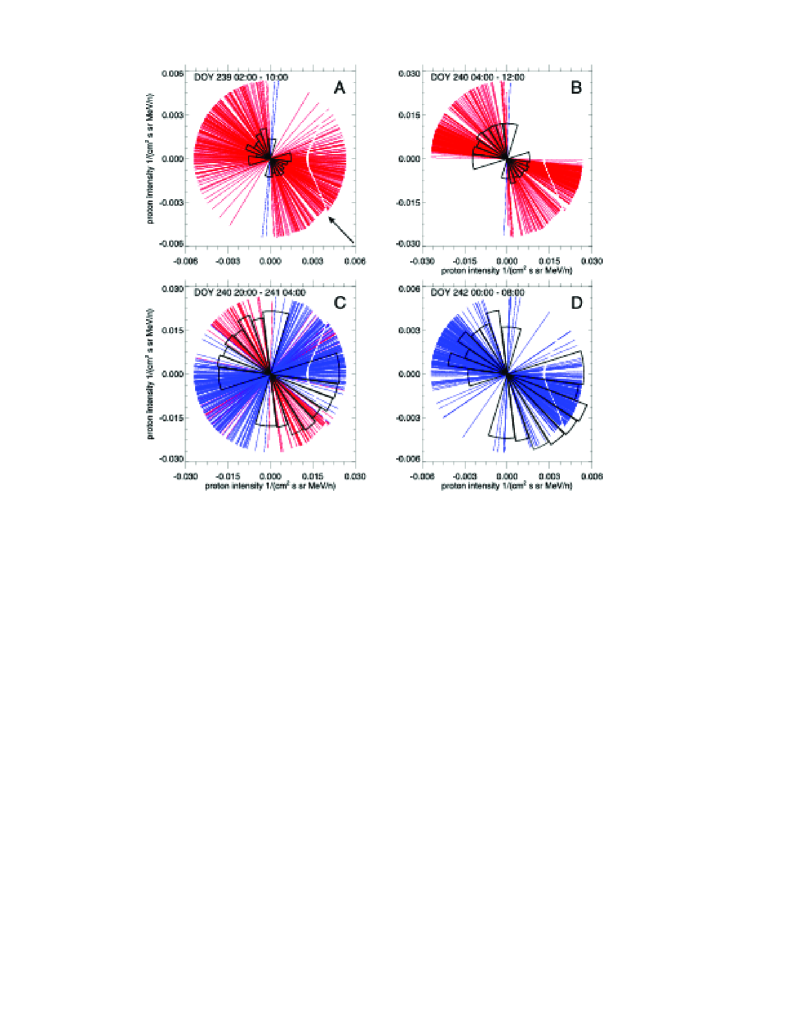
The four panels in Figure 7 show sector plots of the anisotropy of to MeV protons in the RT plane for the four 8-hour intervals, respectively. The Radial, Tangential, Normal (RTN) coordinate system is used. The direction is from the Sun to the spacecraft and is pointing to the left; the direction is along the direction, where is the Sun’s spin axis; and the direction completes the right-handed triad. The Sun is to the right in these plots. At AU, the nominal magnetic field with a Parker spiral orientation (pointing away from the Sun) will be along the diagonal from the lower right corner to the upper left corner (the arrow shown in panel A). We use data from the LET instrument, which has a total of sectors with facing toward and against the Sun. The convention of the plot is such that the upper left (lower right) sector measures ions coming from the upper left (lower right). The lengths of the sectors denote the intensities of the fluxes as seen by that detector with the scale shown in the and -axis. The red and blue lines shown in the panel represent the -minute averaged magnetic field directions, with red (blue) indicating negative and blue positive .
In panel A, except for two intervals, the magnetic field points toward the Sun and clustered around the Parker spiral direction, but with a large spread. The proton flux was lower than those in the other three panels. The flux was rather isotropic, with slightly more particles coming into the upper-left detectors than coming into the lower-right detectors.
In panel B, the directions of the magnetic field still points toward the Sun. The spread of the magnetic field direction is narrower than in panel A and the center of the distribution is slightly inclined towards the R direction. The flux is more than times higher than those in Panel A and there is a clear anisotropy in that more protons are propagating towards the Sun than away. The anisotropy suggests that the source of the - MeV protons was located outside 1 AU. These protons were presumably accelerated at the reverse shock of CIR1 (now beyond 1 AU) and propagated back to AU. Note that the fluxes detected by the detectors facing against the Sun (the upper left sectors) do not differ much between themselves, /(cm2 s sr MeV/n). Similarly the fluxes detected by the detectors facing the Sun (the lower right sectors) did not differ much, /(cm2 s sr MeV/n). So the fluxes are isotropic in each hemispheres. Note that particles propagating towards the Sun can be reflected, and then as they move back away from the Sun, their pitch angles will approach zero due to the “magnetic focusing” effect. However, the fact that the pitch angle distributions (PADs) were isotropic within each hemisphere suggests that pitch angle diffusion dominated over magnetic focusing. As a measure of the anisotropy, we find the ratio of the sunward to anti-sunward fluxes is . This value depends very much on the pitch angle diffusion coefficient and can be used to constrain models of particle acceleration and transport in CIRs.
Panel C is for the period where the peak of the - MeV proton intensity occurred. The magnetic field showed a clear bi-polar distribution during this period: when (the red lines), the magnetic fields were generally aligned with the nominal Parker spiral direction; when (the blue lines), the magnetic fields were aligned mostly between the radial direction and that is perpendicular to the nominal Parker spiral direction. Compared to panel B, the proton flux was enhanced. The pitch angle distribution was almost isotropic, with slightly more particles propagating away from the Sun.
The period shown in panel D was closer to CIR2. During this period , so the magnetic field was pointing away from the Sun. Period D was thus on the opposite side of the HCS. The proton flux was typically smaller than in periods B and C (note the scales in panel A and D are different from those in panels B and C), but higher than those in period A. There was a significant anisotropy in the angular distribution, with more protons propagating away from the Sun.
The observations of energetic ions and electrons described above are very unusual and were never reported in individual CIR events. For example, in typical single CIRs the maximum intensities occur near either the forward or the reverse shock, and after spacecraft passage through the reverse shock, the intensities usually drop quickly. Furthermore the anisotropy of SEPs after the reverse shock is usually sunward.
3 Discussion
What caused all these unusual observations in this event? The presence of the second CIR likely plays an important role. However these observations are also rare for CIR pairs. Indeed as we will discuss in the following, for the Carrington Rotation immediately before and after CR2060, where CIR pairs also appeared, energetic ion intensity observations showed the normal temporal behavior of single CIR cases. This is somewhat expected because unless the two CIRs are magnetically connected, the presence of a second CIR will have no effects on the energetic particles associated with the first CIR, and vice versa.
The above argument suggests that magnetic connection is important in the case of CR2060. We argue in the following that these observations (as shown in Figures 3 to 7) resulted from particle acceleration and trapping between the reverse shock of the first CIR and the forward shock of the second CIR through a large scale “U-shape” magnetic field that connects these two shocks. We illustrated schematically in Figure 8. The U-shaped magnetic field was possibly caused by reconnection that occurred high in the corona. Previously, Luhmann et al. (1998) and Li et al. (1998) suggested that such reconnections may constantly occur near the cusp of the helmet steamers due to the continuous global evolution of coronal fields. In a numerical modeling effort, Chen et al. (2009) noted that reconnections can take place above a streamer cusp repeatedly as a result of insufficient magnetic confinement of streamer plasmas.
In Figure 8, the dashed semicircle is the approximate spacecraft trajectory with respect to the Sun in the co-rotating frame. The spacecraft moves along the semicircle in the clockwise direction (as shown by the arrow). The labels A, B, C, D correspond to the 4 periods shown in Figure 3. The two compression regions are indicated by the horizontal and inclined lines. The stream interfaces are shown as the dashed lines inside the two compression regions. The solid lines in red and blue and with arrowheads are the magnetic field lines. Red denotes a negative and blue denotes a positive . The four dark black lines are the four shocks. The forward shocks are formed in the slow wind and the reverse shocks are formed in the fast wind. The forward and reverse shocks bounded the CIRs. Note that as drawn in Figure 8, both the forward and reverse shocks of CIR1 are formed inside 1 AU. In comparison, the forward shock of CIR2 is formed outside 1 AU, but the reverse shock is formed inside 1 AU, as required by the in situ observations as shown in Figure 2. Three U-shaped magnetic field lines are shown in Figure 8. These are drawn to help understanding the time intensity profiles shown in Figure 3 and the anisotropy observations shown in Figure 7.
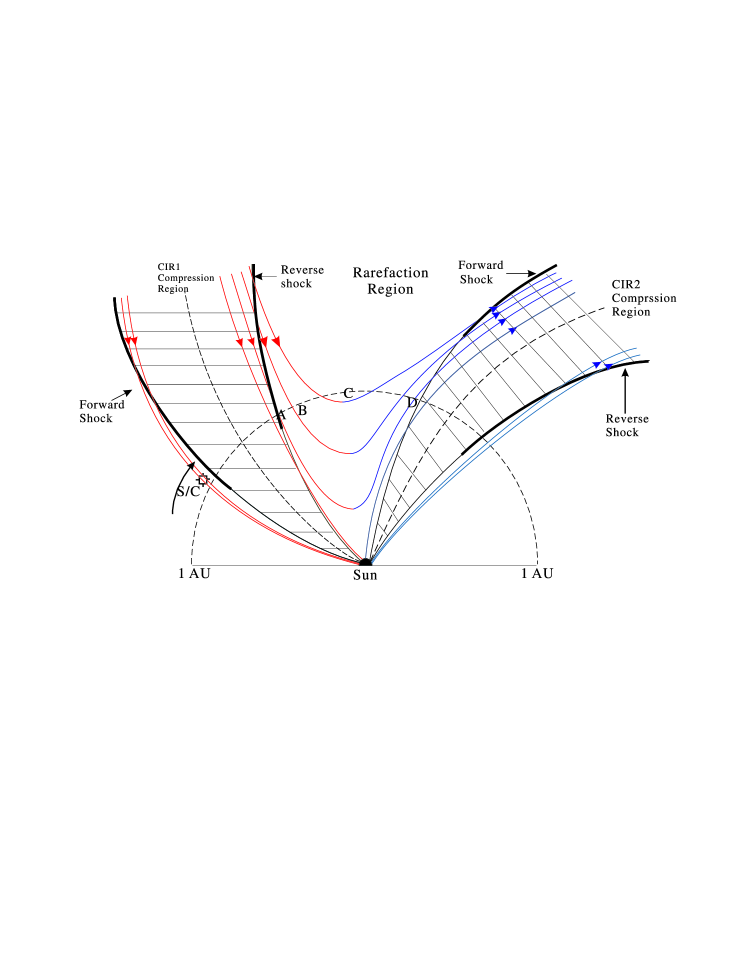
Referring to features in Figure 8, we now describe a scenario to explain the STEREO-B observations. Consider first period A, at this time STB had just passed the newly developed reverse shock from left (downstream) to right (upstream). It was close to the shock, so the distribution of the energetic particles did not show a strong anisotropy. Furthermore, since the shock was newly formed at this distance, the acceleration was less efficient and the intensity of the energetic particles was low. As STB moved clockwise to period B, it connected to the part of the shock that was further away, where the shock was stronger. Since the shock was the source of the energetic particles, we expect to see most energetic particles propagating sunward during this period, as observed in Figure 7. Although most particles were flowing toward the Sun, were moving away from the Sun. This is not unusual in CIR events where the pitch angle anisotropies are usually modest. A small anisotropy is likely due to a strong pitch angle scattering. Furthermore magnetic reflection of sunward flowing particles, as they move closer to the Sun, can reverse their propagation directions. So even if pitch angle scattering is not strong, these reflected particles will be observed as moving away from the Sun.
Moving from period A to B, the particle intensity increases, and the anisotropy also increases. In the U-shaped magnetic field scenario, this is due to the spacecraft being connected to stronger sources (further away). As the spacecraft further moved to period C, we find that the direction of the magnetic field went through a phase during which it was mostly perpendicular to the nominal Parker field direction and eventually the flipped sign. This can be explained naturally with the U-shaped magnetic field, since in this case, the B field direction had to undergo a change from a Parker-spiral-like with to an intermediate state where and finally to a direction with . During period C, the intensity of energetic ions also increases. This is not surprising since now the U-shaped field lines connected to both the reverse shock of CIR1 and the forward shock of CIR2, so that accelerated particles are effectively trapped between the two shocks. Furthermore, since it was in the middle of CIR1 and CIR2, it connected to the furthest and strongest parts of both shocks, consequently the acceleration was the most efficient. Also note that further away the shock compression ratio could be larger and the particle spectrum can be therefore harder. That particles are now trapped between two shocks also implies that the anisotropy in period C will be smaller than that in period B. This is what the observations show in Figure 7. We note that for energetic electrons, because they move fast, they may undergo multiple reflections between the reverse shock of CIR1 and the forward shock of CIR2. This may lead to a more efficient acceleration than that at a single shock.
In period D, the U-shaped field lines were still connected to the reverse shock of CIR1, but not connected to the forward shock of CIR2 because it was not yet formed at 1 AU (during period D the field lines are the same as those in period A and B). The U-shaped magnetic field is not connected to the forward shock of the CIR2, so only limited reflection can occur locally in CIR2, and therefore the energetic particles in period D were mostly streaming away from the Sun. This agrees with the anisotropy observations in Figure 7. Furthermore, the absence of the reflection also implies that the intensity of energetic ions in period D will drop comparing to period C. This agrees with the time-intensity profile observations shown in Figure 3 and Figure 7. Note that the intensity in period D is comparable to those in period A and B. Also we remark that magnetic field enhancement in a CIR without shock can also reflect particles, but presumably of less efficiency than if there is a shock.
In our proposed scenario, the large scale U-shaped magnetic field topology is the key. So it is important to see if there is corroborating observational evidence for this. As explained in the introduction, solar wind suprathermal electrons can be used to infer the large-scale topology of the interplanetary magnetic field (e.g., Gosling (1990); Kahler (1987)). Recent studies (Steinberg et al., 2005; Skoug et al., 2006; Lavraud et al., 2010) showed that counter-streaming suprathermal electrons are frequently observed in the vicinity of CIRs, owing to wave-particle interactions and shock heating, combined with adiabatic mirroring and particle leakage into the upstream regions (both into the adjacent slow and fast winds).
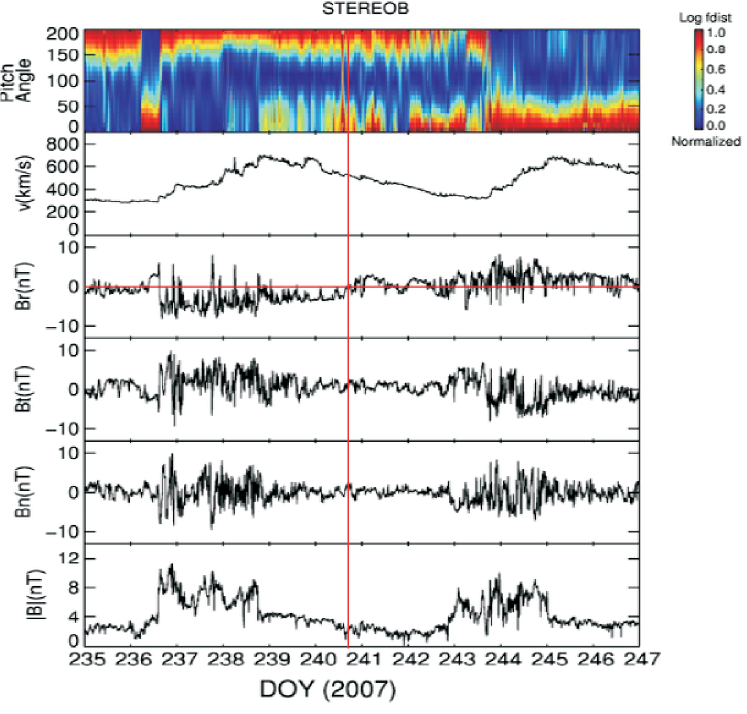
However, statistical analyses (Lavraud et al., 2010) showed that such counter-streaming features are only observed to some limited distance downstream of the CIR bounding shocks/compressions. In other words, they are not expected to extend all the way from one CIR to the next. We thus now examine the pitch angle distributions (PAD) of eV electrons in the context of the proposed U-shaped topology. We first consider STEREO-B observations. In Figure 9, the top panel displays the normalized (for each sample) electron PAD, the second panel shows the solar wind speed, and the next four panels show the magnetic field components and its magnitude. This figure shows a dominant anti-field-aligned strahl until DOY 239.
On day 236, we note a short duration reversal of the dominant PAD polarity. However, this is commonly observed when strong acceleration and reflection of suprathermal electrons occurs at CIR shocks (cf. (Steinberg et al., 2005; Skoug et al., 2006)). Although not shown, the fluxes of the population actually remained the same as adjacent regions during this short interval, but the overwhelming fluxes of the reflected population make the normalized PADs appear dominated by this reflected population.
The most important PAD feature is seen between the two CIRs. Starting slightly before DOY 379 at the time of the reverse shock of CIR1, and lasting until the beginning of CIR2 (DOY 243), STEREO-B recorded unusual and essentially continuous counter-streaming PADs. As shown in previous studies, this feature is not necessarily related to a closed field topology. It is often seen upstream of CIR shocks, but again what makes it unusual here is that it is observed continuously between the two CIRS. In the proposed scenario of a U-shaped magnetic topology connecting the reverse shock of CIR1 and the forward shock of CIR2, counter-streaming suprathermal electrons is a natural consequence; for the same reasons as explained previously for more energetic ions and electrons. A U-shaped magnetic topology also implies that will reverse sign, as indicated by the red vertical line in Figure 9. Note that the reversal is in any case expected between two consecutive CIRs, if these do not come from pseudo streamers, as is the case here.
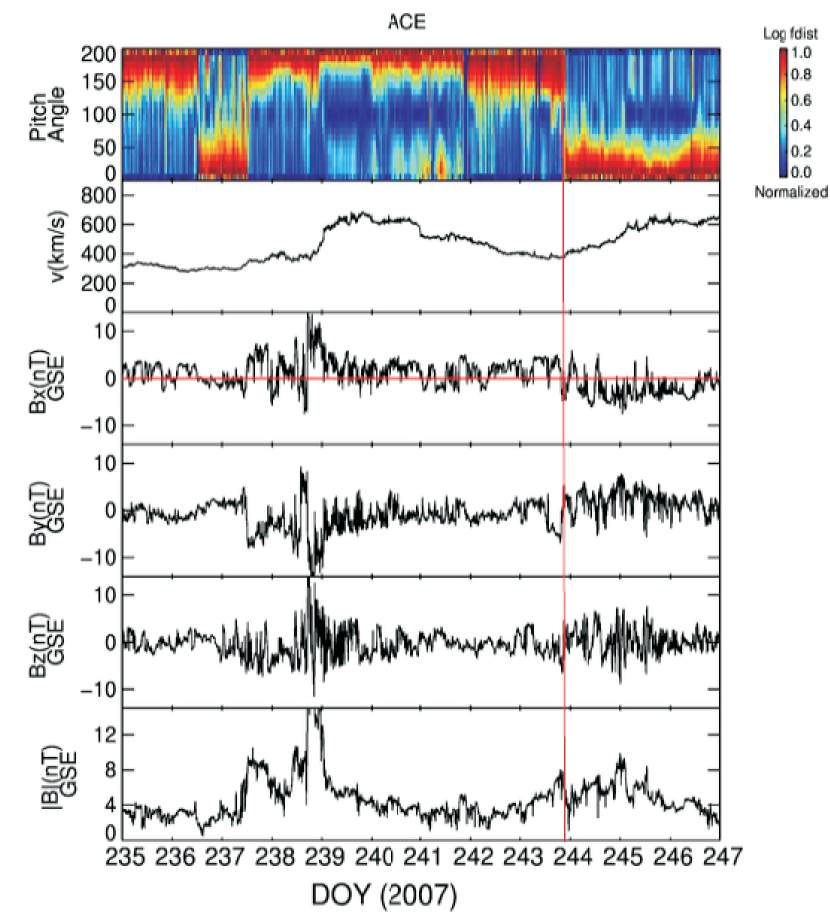
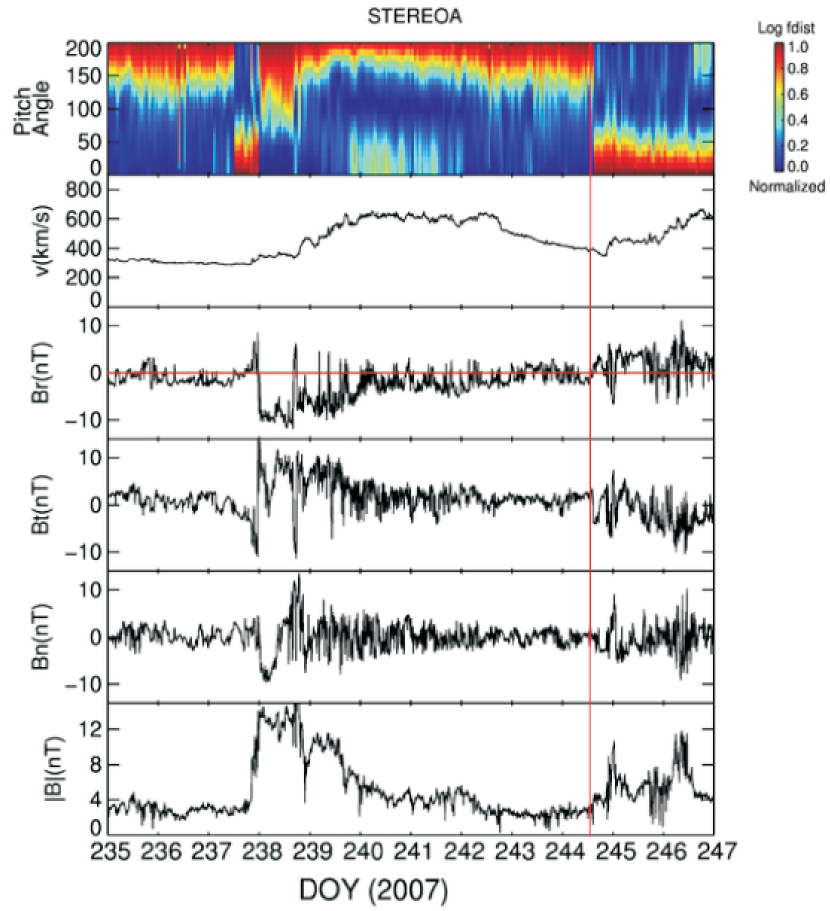
Figure 10 and Figure 11 are similar to Figure 9, but for ACE and STEREO-A, respectively. Compared to STEREO-B, the counter-streaming features at ACE and STEREO-A are much less prominent, and of shorter durations. The vertical red lines mark the times when changes sign at ACE and STEREO-A. In both cases, reversed sign in the slow solar wind and close to CIR2, as is usually the case. This is unlike the sign change at STEREO-B which is very significantly farther from CIR2. We take these observations as additional arguments in favor of a large-scale U-shaped topology, as depicted in Figure 8, which is caused by magnetic reconnection in the high corona. This phenomenon is transient in nature since ACE and STEREO-A measurements do not show the same continuous PAD properties as STEREO-B.
As discussed next, these properties are also not found for the previous and next Carrington rotations.
3.1 Energetic particle observations from the preceding and the following Carrington Rotations
The observations discussed so far have motivated us to conjecture the existence of a large scale U-shaped magnetic field topology between the reverse shock of CIR1 and the forward shock of CIR2. The U-shaped magnetic field was possibly caused by reconnection that occurred high in the corona. As such, it is expected to be transient in nature, which explains why these unusual energetic particle observations were most prominent at one spacecraft, in this case STEREO-B. Such a transient nature of the U-shaped magnetic field also implies that similar observations are not expected to emerge for the CIR pairs before and after CR2060. We now examine the energetic particle observations from the CIRs in the preceding and following Carrington Rotations by STEREO-B. These are shown in Figure 12 and Figure 13.
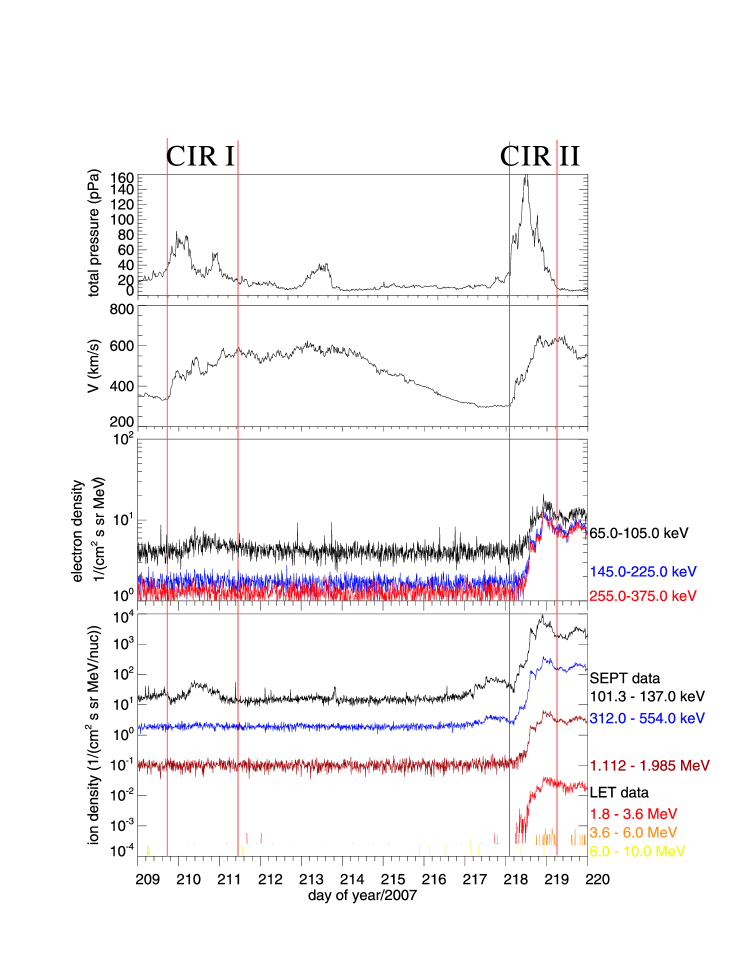
For CR2059, while the two high speed solar wind streams are evident, the shock pair that bounded the first CIR could not be identified. In comparison, the forward shock, but not the reverse shock, of the second CIR has developed at 1 AU. There was clear signatures of particle acceleration at the second CIR as shown by the enhancement of electrons and ions in most of the energy channels. The intensities of the to keV electron and to keV/nucleon ion showed noticeable enhancement at the first CIR. The time intensity profiles between the two CIRs showed a very regular behavior as expected since there was no reverse shock associated with the first CIR.
For the CR2061, the shock pairs that bounded both CIRs can be clearly seen, making it a good comparison to CR2060. Compared to Figure 3, we see stark differences in the time intensity profiles between the CIR pairs. In CR2061, there were the normal drop-outs followed by gradual enhancements of energetic electrons and ions between the two CIRs. This is best illustrated by the - MeV ion channel. Without the U-shaped magnetic field topology, this drop-out is a normal behavior since the spacecraft moved further away from the reverse shock of the first CIR. Similarly the subsequent gradual increase is due to the spacecraft becoming closer to the forward shock of the second CIR.
So the presence of a CIR pair is only a necessary condition for the observations shown in Figure 3. In our proposed scenario, the essential requirement for the unusual intensity enhancements between the two CIRs is a field that connects the two CIRs (to be more specific, the reverse shock of the first CIR and the forward shock of the second CIR). This is achieved through magnetic reconnection in the high corona.
4 Conclusion
We report the observation of the acceleration and trapping of energetic ions and electrons at a CIR pair. The event occurred in Carrington Rotation (CR) 2060 and the two CIRs, with a separation less than days, were observed by three spacecraft: STEREO-B, ACE and STEREO-A.
Several distinct observational features in this CIR-pair event made this event very unusual. These features are:
1) The time intensity profiles of high energy ions and electrons show a peak between the two CIRs.
2) The magnetic field changed sign in between the CIR-pair, in a fashion consistent with regular CIRs, rather than CIRs from a pseudostreamer.
3) The PAD of high energy protons between the two CIRs showed an unusual sequence of first being nearly isotropic, followed by mostly sunward propagating, then isotropic, and finally mostly anti-sunward propagating.
4) The energetic helium spectra were harder in between the two CIRs than near the CIR shocks.
5) Counter-streaming suprathermal electrons were observed continuously between CIR1 and CIR2.
These features have motivated us to propose a U-shaped large-scale magnetic field topology connecting the reverse shock of the first CIR and the forward shock of the second CIR. A U-shaped magnetic field can simultaneously explain all the above observations. The key point is that a magnetic field connecting the two shocks (the reverse shock of CIR1 and the forward shock of CIR2) will allow particles to be trapped and accelerated between the two shocks. We conjecture that magnetic reconnection occurring in the high corona is the cause of such a U-shaped magnetic field. After reconnection, the U-shaped magnetic field propagates out to the heliosphere. We infer that the magnetic reconnection process is transient in structure because observations from ACE and STEREO-A for the same event were less prominent and because there were no similar observations during the preceding and following Carrington rotations. In a future paper, we plan to examine particle acceleration at a CIR-pair with a U-shaped magnetic field configuration using a test particle simulation.
References
- Acuña et al. (2008) Acuña, M. H., Curtis, D. J.L. Scheifele, J.L., Russell, C. T., Schroeder, P., Szabo, A., Luhmann, J. G., 2008, Space Sci. Rev., 136, 203
- Balogh et al. (1999) Balogh, A. G, Gosling, J.T., Jokipii,J. R., Kallenbach, R., Hunow, H., 1999, Space Sci. Rev.,89
- Barnes & Simpson (1976) Barnes, C.W. & Simpson, J. A., 1976, APJL, 210, 91
- Belcher & Davis (1971) Belcher, J. W. & Davis Jr., L., 1971, J. Geophys. Res., 76, 3534
- Bučík et al. (2009b) Bučík, R., Mall, U., Korth, A., Mason, G. M., 2009, Ann. Geophys., 27, 3677
- Bučík et al. (2009a) Bučík, R., Gómez-Herrero, R., Korth, A., Mall, U., Mason, G. M., 2009, Solar Phys, 259, 361.
- Burlaga (1975) Burlaga, L. F., 1975, Space Sci. Rev., 17, 237
- Chen et al. (2009) Chen, Y., Li, X., Song, H.Q., Shi, Q.Q., Feng, S.W., Xia, L.D., 2009, ApJ, 691, 1936
- Desai et al. (1998) Desai, M. I., Marsden, R. G., Sanderson, T. R., et al. 1998, J. Geophys. Res., 103, 2003
- Dresing et al. (2009) Dresing, N., Gómez-Herrero, R., Heber,B., et al. 2009, Solar Phys, 256, 409
- Ebert et al. (2012) Ebert, R. W., Dayeh, M. A., Desai, M. I., Mason, G. M., 2012, APJ, 749, 73
- Feldman et al. (1981) Feldman, W. C., Asbridge, J. R., Bame, S. J., et al. 1981, J. Geophys. Res., 86, 5408
- Fisk (1976) Fisk, L. A, 1976, J. Geophys. Res., 81, 4641
- Fisk & Lee (1980) Fisk, L. A. & Lee, M., 1980, APJ, 237, 620
- Fisk & Jokipii (1999) Fisk, L. A., & Jokipii, J. R. 1999, Space Sci. Rev., 89, 115
- Galvin et al. (2008) Galvin, A. B., Kistler, L. M., Popechi, M. A., et al., 2008, Space Sci. Rev., 136, 437
- Giacalone et al. (2002) Giacalone, J., Jokipii, J. R., Kóta, J., 2002, APJ, 573, 845
- Gloeckler et al (1994) Gloeckler, G., Jokipii, J. R., Giacalone, J., Geiss, J., 1994, GRL, 21, 14, 1565
- Gold et al (1998) Gold, R. E., Krimigis, S. M., Hawkins, S. E. III., et al., 1998, Space Sci. Revs., 86, 541.
- Gómez-Herrero et al. (2009) Gómez-Herrero, R., Klassen, A., Müller-Mellin, R., et al., 2009, J. Geophys.Res., 114, A05101
- Gosling (1990) Gosling, J. T., in Physics of Magnetic Flux Ropes, Geophys. Monograph, No. 58, edited by C. T. Russell, E. R. Priest, and L. C. Lee, AGU, 343, 1990.
- Gosling et al. (1987) Gosling, J. T., Baker, D. N., Bame, S. J., Feldman, W. C., Zwickl, R. D., and Smith, E. J., J. Geophys. Res., 92, No. A8, 8519, 1987.
- Gosling et al. (1993) Gosling, J. T., Bame, S. J., Feldman, W. C., McComas, D. J., Phillips, J. L., and Goldstein, B. E., 1993, Geophys. Res. Lett., 20(21), 2335.
- Gosling et al. (1981) Gosling, J. T., Borrini, G., Asbridge, J.R., et al., 1981, J. Geophys. Res, 86, 5438
- Gosling et al. (2006) Gosling, J. T., McComas, D. J., Skoug, R. M., and Smith, C. W., Geophys. Res. Lett., 33, L17102, doi:10.1029/2006GL027188, 2006.
- Gosling & Pizzo (1999) Gosling, J. T., & Pizzo, V. J. 1999, Space Sci. Rev., 89, 21
- Heber et al. (1999) Heber, B., Sanderson, T. R., Zhang, M.,1999, Adv. Space Res., 23, 3, 567
- Hu (1993) Hu, Y. Q., 1993, J. Geophys.Res., 98, A8, 13201
- Hu et al. (1998) Hu, Y. Q., Chen, J., Zhang, G., 1998, ChA&A, 22, 1, 69
- Hu & Jia (2001) Hu, Y. Q. & Jia, X. Z., 2001, J. Geophys.Res., 106, A12, 29299
- Jian et al. (2006) Jian, L, Russel, C. T., Luhmann, J. G., Skoug, R. M., 2006, Solar phys., 259, 345
- Jokipii (2001) Jokipii, J. R., 2001, Proc. 27th Int. Cosmic Ray Conf. 9, 3581
- Kahler (1987) Kahler, S., and Lin, R. P., Geophys. Res. Lett., 21, 1575, 1994.
- Kreiger et al. (1973) Krieger, A. S, Timothy, A. F., Roelof, E. C., 1973, Solar phys, 29, 505
- Lavraud et al. (2009) Lavraud, B., Gosling, J. T., Rouillard, A. P., et al., Solar Phys., 256, 379-392, 2009.
- Lavraud et al. (2010) Lavraud, B., Opitz, A., Gosling, J. T., et al., 2010, Ann. Geophys., 28, 233
- Li et al. (1998) Y. Li, J. G. Luhmann, T. Mulligan, J. T. Hoeksema, C. N. Arge, S. P. Plunkett, O. C. St. Cyr, 2001, J. Geophys. Res., 106, 25103.
- Li et al. (2003) Li, G., Zank, G. P., Rice, W. K. M. 2003, JGR, 108, 1082
- Li et al. (2005) Li, G., Zank, G. P., Rice, W. K. M. 2005, JGR, 110, A06104
- Luhmann et al. (1998) Luhmann, J. G., Gosling, J. T., Hoeksema, J. T. and Zhao, X., 1998, J. Geophys. Res., 103, 6585.
- Luhmann et al. (2008) Luhmann, J. G., Curtis, D. W., Schroeder, P., et al., 2008, Space Sci. Rev., 136, 117
- McComas et al. (1998) McComas, D. J., Bame, S. J., Barker, P., et al., 1998, Space Sci. Rev., 86, 563
- McDonald & Desai (1971) Macdonald, F. B. & Desai, U. D., 1971, J.Geophys.Res., 76, 808
- Mason et al. (1997) Mason,G.M., Mazur, J. E.,Dwyer, J. R., et al., 1997, ApJ, 486, L149
- Mason & Sanderson (1999) Mason, G. M., & Sanderson, T. R. 1999, Space Sci. Rev., 89, 77
- Mason et al (2000) Mason, G. M., Dwyer, J. R., Mazur, J. E., 2000, APJ, 545, 2, L157
- Mason et al. (2008a) Mason, G. M., Leske, R. A., Desai, M. I., et al., 2008, APJ, 678, 1458
- Mason et al. (2008b) Mason, G. M., Korth, A.,Walpole, P. H., 2008, Space Sci. Rev., 136, 257
- Mason et al. (2009) Mason, G.M., Desai, M.I., Mall, U., et al., 2009, Solar phys., 256, 393
- Mason et al. (2012) Mason, G. M., Desai, M. I., Li, G., 2012, APJL, 748, 31
- Mazur et al. (1993) Mazur, J. E., Mason, G. M., Klecker, B., et al., 1993, APJ, 404, 810
- McComas et al. (1998) McComas, D. J., Bame, S.J., Barker, P., et al., 1998, Space Sci. Rev., 86, 563
- Mewaldt et al. (2008) Mewaldt, R. A., Cohen, C. M. S., Cook, W. R., 2008, Space Sci. Rev., 136: 285
- Möbius et al (2002) Möbius, E., Morris, D., Popecki, M. A., et al, 2002, GRL, 29, 2, 1
- Müller-Mellin et al. (2008) Müller-Mellin, R., Bottcher, S., Falenski, J., et al., 2008, Space Sci. Rev., 136: 363
- Philipp (1987) Philipp, W. G., Miggenrieder, H., Montgomery, M. D., Mühlhäuser, K.-H., Rosenbauer, H., and Schwenn, R., J. Geophys. Res., 92, 1093, 1987.
- Pizzo (1978) Pizzo, V., 1978, J. Geophys. Res, 83, 5563
- Pizzo (1985) Pizzo, V. J., 1985, in B. T. Tsurutani and R. G. Stone (eds.), Collisionless Shocks in the Heliosphere: Reviews of Current Research, Geophysical Mono. No. 35, Amer. Geophys. Union, 51
- Richardson et al. (1998) Richardson, I. G., Mazur, J. E., Mason, G. M., 1998, J. Geophys. Res., 103(A2), 2115.
- Richardson (2004) Richardson, I. G. 2004, Space Sci. Rev, 111, 267
- Sauvaud et al. (2008) Sauvaud, J. A., Larson, D., Aoustin, C., et al, 2008, Space Sci. Rev., 136, 227
- Scholer (1999) Scholer, M., 1999, Space Sci. Rev., 89, 105
- Skoug et al. (2006) Skoug, R. M., Gosling, J. T., McComas, D. J., Smith, C. W., and Hu, Q., Suprathermal electron 90 pitch angle depletions at reverse shocks in the solar wind, J. Geophys. Res., 111, A01101, 2006.
- Simnett & Roelof (1995) Simnett, G. M., & Roelof, E. C., 1995, Space Sci. Rev., 72, 303
- Simnett (2003) Simnett, G. M., 2003, Adv. Space Res., 31, 4, 883
- Smith et al. (1998) Smith, C. W., Heureux, J. L., Ness, N. F., et al., 1998, Space Sci. Rev, 86, 613.
- Smith & Wolfe (1976) Smith, E. J., & Wolfe, J. H., 1976, Geophys. Res. Lett., 3, 3, 137
- Steinberg et al. (2005) Steinberg, J. T., Gosling, J. T., Skoug, R. M., and Wiens, R. C., Suprathermal electrons in high-speed streams from coronal holes: Counterstreaming on open field lines at 1 AU, J. Geophys. Res., 110, A06103, doi:10.1029/2005JA011027, 2005.
- Tsurutani et al. (1982) Tsurutani, B. T., Smith, E. J., Pyle, K. R., Simpson, J. A., 1982, J. Geophys.Res., 87, 7389
- van Hollebeke et al. (1978) van Hollebeke, M. A. I., McDonald, F. B., Trainor, J. H., von Rosenvinge, T. T., 1978, J. Geophys. Res., 83, 4723
- Van Hollebeke (1981) van Hollebeke, M. A. I., et al., 1981, Proc. Solar Wind Conf. 4, ed. H. Rosenbauer (Garching: Max-Planck-Institute fur Aeronomie), 497
- Verkhoglyadova et al. (2010) Verkhoglyadova, O.P., Li, G., Zank, G. P., Hu, Q., Cohen, CMS, Mewaldt, R.A., Mason, G. M., Haggerty, D. K., von Rosenvinge, TT, Looper, MD, 2010, J. Geophys. Res. 115, A12103