11email: Nicolas.Nardetto@oca.eu 22institutetext: INAF – Osservatorio Astronomico di Brera, Via E. Bianchi 46, 23807 Merate (LC), Italy 33institutetext: Instituut voor Sterrenkunde, KU Leuven, Celestijnenlaan 200D, B-3001 Leuven, Belgium 44institutetext: Université de Toulouse, UPS-OMP, IRAP, F-65000 Tarbes, France 55institutetext: CNRS, IRAP, 57, Avenue d’Azereix, BP 826, F-65008 Tarbes, France
Understanding the dynamical structure of pulsating stars.
Abstract
Context. High-resolution spectroscopy is a powerful tool to study the dynamical structure of pulsating stars atmosphere.
Aims. We aim at comparing the line asymmetry and velocity of the two Sct stars Pup and DX Cet with previous spectroscopic data obtained on classical Cepheids and Cep stars.
Methods. We obtained, analysed and discuss HARPS high-resolution spectra of Pup and DX Cet. We derived the same physical quantities as used in previous studies, which are the first-moment radial velocities and the bi-Gaussian spectral line asymmetries.
Results. The identification of =7.098 d-1 as a fundamental radial mode and the very accurate Hipparcos parallax promote Pup as the best standard candle to test the period-luminosity relations of Sct stars. The action of small-amplitude nonradial modes can be seen as well-defined cycle-to-cycle variations in the radial velocity measurements of Pup. Using the spectral-line asymmetry method, we also found the centre-of-mass velocities of Pup and DX Cet, km s-1 and km s-1, respectively. By comparing our results with previous HARPS observations of classical Cepheids and Cep stars, we confirm the linear relation between the atmospheric velocity gradient and the amplitude of the radial velocity curve, but only for amplitudes larger than 22.5 km s-1. For lower values of the velocity amplitude (i.e., km s-1), our data on Pup seem to indicate that the velocity gradient is null, but this result needs to be confirmed with additional data. We derived the Baade-Wesselink projection factor for Pup and for DX Cet. We successfully extended the period-projection factor relation from classical Cepheids to Scuti stars.
Key Words.:
stars: oscillations – stars: atmospheres – line: profiles – stars: individual: Pup – stars: individual: DX Cet – stars: distances1 Introduction
The variability of PupHD 67523HR 3185, one of the brightest (=2.88) Sct stars, was first reported by Cousins (1951) and then clearly demonstrated by Eggen (1956) and Ponsen (1963). An accurate value of the pulsational period (0.14088143 d) was determined from photometric data spanning fifty-two years (Moon & van Antwerpen 2009). Atmospheric parameters (effective temperature, surface gravity, and metallicity) were determined from ELODIE spectra by using the MILES library interpolator (Prugniel et al. 2011): =6810121 K, =3.590.14, and [Fe/H]=+0.600.05. The [Fe/H] value confirms that Pup is a member of the Del subgroup, that is, late-A and early-F subgiants showing spectra with enhanced metal-lines (especially the Fe I, Y II, Fe II and Zr II ones) and normal H and Ca II lines (Kurtz 1976, and references therein). Pup is a well-known case where the determinations of the atmospheric parameters by means of Strömgren photometry (=0.259, =0.215, =0.731, =2.715) disagree in function of the photometric indices used in the calibrations. This could be ascribed to its particular metallic content. Indeed, the spectroscopic values agree excellently with those obtained from and indices, that is, 6850 K and =3.5 (Breger 1974; Kurtz 1976). Pioneering IUE spectra show emission features in the Mg II lines throughout the pulsation cycle (Fracassini et al. 1983). Later, detailed spectroscopic investigations of the pulsation properties were performed by Mathias et al. (1997) and Dall & Frandsen (2002). Very recently, the results of a dedicated spectroscopic multisite campaign excluded solar-like oscillations with an amplitude per radial mode larger than 0.5 m s-1 (Antoci et al. 2013).
DX CetHD 16189 is a bright high-amplitude Sct (HADS) star with a period =0.103939529 d and full amplitude of 0.20 mag in light (Kiss et al. 1999). Stellar parameters were obtained from photometry (Kiss et al. 1999; Stetson 1991): K, dex.
Comparing the spectroscopic analysis of these two Scuti stars ( Pup and DX Cet) with previous results obtained on classical Cepheids and Cep stars is extremely interesting for various reasons. First, for a given pulsating star, and also when comparing one star to the other, the spectral lines asymmetry show a systematic difference in average (over one pulsation cycle) that is positive or negative, depending on the spectral line considered. This effect is related to the dynamical structure of the star’s atmosphere and has been investigated in the case of classical Cepheids by means of the k-term (Nardetto et al. 2008, 2009). Since the physical origin of this phenomenon is currently not understood, the comparison of the results obtained for several types of pulsating stars is particularly helpful. Second, Nardetto et al. (2013) found a linear relation between the atmospheric velocity gradient and the amplitude of the radial velocity curve for eight classical Cepheids and two Cep stars ( Lup and Lup). This relation is important in the context of the Baade-Wesselink projection factor (Nardetto et al. 2004, 2007), a quantity that is used to derive the distance to Milky Way and Large Magellanic Cloud Cepheids (Storm et al. 2011a, b). Improving this relation and generalizing it to other pulsators like Sct stars is an interesting roadmap to better understand the Baade-Wesselink projection factor. Finally, the use of pulsating stars located below the horizontal branch as distance indicators requires the mode identification as input parameter, and often this is a challenging task to achieve (Poretti et al. 2008). Therefore, the full characterization of bright, short-period Sct stars is a key matter in calibrating their period-luminosity (P-L) relation.
In Sect. 2 we briefly present our spectroscopic data. In Sect. 3, we analyse the pulsating frequencies of the two Scuti stars. In Sect. 4, we discuss the implication of our data on the derived distances and on the P-L relations. Sect. 5 is then devoted to the spectroscopic analysis of the two targets in terms of spectral line asymmetry and velocity. In Sect. 6, we compare our results on Sct stars with those on classical Cepheids and Cep stars. We close with some conclusions in Sect. 7.
2 Spectroscopic observations and physical parameters
We observed Pup and DX Cet as additional targets in the framework of the ESO LP185.D-0056. The observations were planned to extend the physical scenario of the Sct stars observed with CoRoT.
Three-hundred fifty-nine spectra of Pup were obtained with High-Accuracy Radial-velocity Planetary Searcher (HARPS ; Mayor et al. 2003) in the high-resolution mode (HAM, R=115,000) on five consecutive nights in January 2013. Observations were performed for a few hours at the end of night, as a backup program. The exposure time was set at 30 sec and the signal-to-noise ratio (S/N) was typically about 270. Figure 1 (left panel) shows the behaviour of the mean line profile of each spectrum folded with the pulsational period. Forty-three spectra of DX Cet were obtained with HARPS in the high-efficiency mode (EGGS, R=80,000) on nine consecutive nights in December 2012. Observations were performed for a few hours at the beginning of night, before the rising of CoRoT targets. The exposure time was set at 300 sec and the S/N was usually around 200 (see Fig. 1, right panel). The radial velocity values of Pup were obtained from the HARPS pipeline (Mayor et al. 2003), while those of DX Cet were obtained from the mean line profiles of each spectrum, calculated using the least-squares deconvolution method (Donati et al. 1997).
We estimated the physical parameters of both stars by means of a grid of synthetic spectra. For this purpose we selected four HARPS spectra with a high S/N that were taken at intervals of a quarter of a period starting from the maximum of the radial velocity curve. To save computing time, we reconstructed the synthetic spectra in five 200 Å segments in the range 4000-6650 Å by using the ATLAS9 models and the ATC code (Atmospheric Tools Compilation; Stuetz et al. 2006). Temperature, gravity, metallicity, and microturbulence velocity were allowed to vary in the range 6400 K, dex (cgs units), [Fe/H], and km s-1, respectively. We compared the synthetic 200 Å-segments with the observed ones by computing the . At the end of this process, each segment supplied a set of physical parameters obtained by averaging its own best 50 least-squares solutions. In turn, these five sets were averaged to give the physical parameters at the pulsation phase of the HARPS spectrum that we were considering. Then, the averages of the four , , [Fe/H], and values corresponding to the four pulsation phases supplied the mean stellar parameters. The typical uncertainties of the parameters supplied by one spectrum were also adopted as the errorbars of the mean stellar parameters.
The procedure described above supplied K, dex, [Fe/H]=+0.200.06, and 0.7 km s-1 for Pup. Moreover, we measured a projected rotational velocity 1 km s-1. In the case of DX Cet we obtained K, dex, km s-1, [Fe/H]=, and 1 km s-1. Therefore, our spectroscopic analyses yields out that DX Cet has a slight subsolar metallic content, while Pup is confirmed to be a metal-rich star.
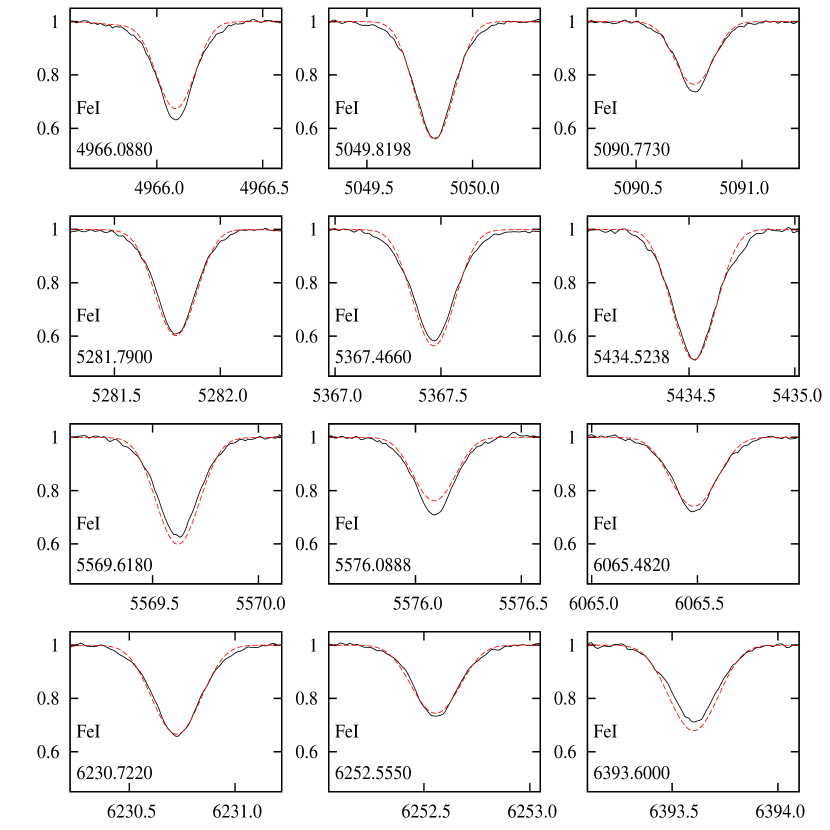
To support the [Fe/H] determination of DX Cet in view of the discussion of the P-L relations (see Sect. 4), Fig. 2 shows the agreement between the observed spectrum and the synthetic one calculated with the above parameters.
Hipparcos parallaxes are available for both stars (van Leeuwen 2007): mas for DX Cet and mas for Pup. DX Cet is located at 1165 pc and we obtain =1.680.20 assuming =7.00. Pup is much closer, at 19.480.02 pc only, and we derive =1.360.01 from the well-established =2.81 magnitude. In the case of Pup, the parallax immediately supplied . Combined with the interferometric determination of the radius (; Antoci et al. 2013), this implies K, in good agreement with our spectroscopic value. Furthermore, we introduced , , =0.033 d (corresponding to the fundamental radial mode), , and the bolometric correction mag (Torres 2010) in the relation (Breger & Bregman 1975)
| (1) |
thus obtaining =3.700.02. This latter value agrees within 2 with ours (=3.420.14) and within 1 with that of Prugniel et al. (2011) (=3.590.14). When applying the same approach to DX Cet, Eq. 1 can only supply the condition
| (2) |
since we have no radius measurement (see also Poretti et al. 2011). Our spectroscopic values match this condition at about 1 (11.300.16). Since in the case of Pup the value is well constrained, this comparison shows that the determination is the most critical parameter to evaluate.
3 Frequency analyses and nature of pulsations


| Pup | DX Cet | |||||||
| ID | Frequency | Amplitude | Phase | ID | Frequency | Amplitude | Phase | |
| [d-1] | [km s-1] | [0, 2] | [d-1] | [km s-1] | [0, 2] | |||
| 7.098 | 4.948 | 0.129 | 9.6197 | 11.444 | 0.318 | |||
| 0.001 | 0.011 | 0.008 | 0.0001 | 0.007 | 0.001 | |||
| 0.297 | 5.102 | 1.890 | 5.308 | |||||
| 0.012 | 0.007 | 0.008 | 0.005 | |||||
| 0.039 | 2.541 | 0.377 | 3.953 | |||||
| 0.012 | 0.364 | 0.007 | 0.020 | |||||
| 0.022 | 5.103 | 0.092 | 2.542 | |||||
| 0.008 | 0.651 | 0.008 | 0.089 | |||||
| 7.900 | 0.281 | 2.613 | 0.022 | 0.656 | ||||
| 0.007 | 0.027 | 0.149 | 0.008 | 0.357 | ||||
| Mean rad. vel. [km s-1] | 46.7390.002 | 25.5160.004 | ||||||
| Residual r.m.s. [km s-1] | 0.041 | 0.023 | ||||||
3.1 Pup
An exhaustive list of photometric measurements of Pup was reported by Moon & van Antwerpen (2009). Ponsen (1963), Eggen (1956), and Hipparcos (ESA 1997) data are the most suitable for a detailed analysis. Data were obtained in different passbands: Ponsen’s measurements were taken through a blue filter, Eggen’s through a yellow filter, and those of Hipparcos in the wide passband. The folded light curves show asymmetric shapes (Fig. 3). The full amplitudes are 0.13, 0.11, and 0.09 mag, respectively. These values fit the sequence observed at 3858, 4310, 4720, and, 5875 Å, that is, 0.17, 0.14, 0.12, and 0.09 mag (Thulassi Doss 1969). Amplitude ratios () and phase shifts () were obtained from a least-squares fit with and (=0.14088143 d): rad and for Ponsen’s blue data, rad and for Eggen’s yellow data, and rad and for Hipparcos data. Taking into account the different passbands, these Fourier parameters agree excellently and suggest significant departure from a perfect sine-shaped light curve. The Fourier parameters of Pup light curves are typical for HADS stars (Figs. 4 and 6 in Poretti 2001). These stars pulsate in a radial mode (typically the fundamental one) and nonradial modes have a much smaller amplitude. However, the amplitude of Pup is not so large that it could be considered as that of a bona-fide HADS star, and more analyses are necessary.
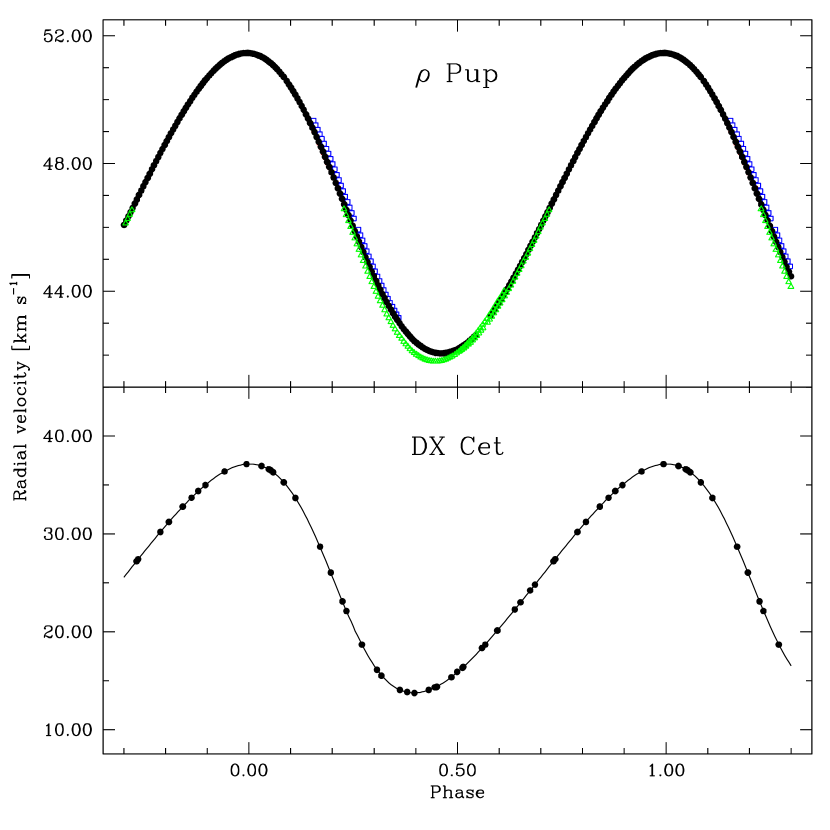
The multiperiodicity of Pup was evident after the detection of clear cycle-to-cycle variations in the radial velocity values obtained with the Coudé Echelle Spectrograph (CES) at the CAT ESO telescope (Mathias et al. 1997). The main oscillation =7.098168 d-1 was identified as a radial mode and two nonradial modes with frequency 7.8 and 6.3 d-1 were also proposed, but the latter is very uncertain. We used the iterative sine–wave least–squares fitting method (Vaniĉek 1971) to analyse in frequency the radial velocity measurements obtained from the HARPS spectra, determined by the on-line pipeline with an internal error of about 1 m s-1. After the detection of , the power spectrum clearly shows a structure centred at , confirming that the radial velocity curve is asymmetrical, as well. The folded radial velocity curve shows both the asymmetrical shape and cycle-to-cycle variations up to 0.36 km s-1 (Fig. 4). Asymmetry can be evaluated from the maximum, which occurs at phase 0.0, while the minimum occurs before phase 0.50 (black filled circles). After introducing and as known constituents, the highest peak in the power spectrum of HARPS data is at =7.900 d-1, in good agreement with the value obtained from CAT data (i.e., 7.815 d-1; Mathias et al. 1997). However, we note that the spectral windows of both datasets are not adequate to perform a very detailed, self-consistent frequency analysis, since these spectroscopic data were acquired with the goal of studying the dynamics of the dominant pulsation mode. The ground-based photometric data are too noisy to supply useful hints about . Even Hipparcos data are unsuitable to search for a small amplitude, short-period additional mode. However, the spectral window of these data is free from the 1 d-1 aliasing, and we could see, among many others, a peak at 8.860 d-1. Antoci et al. (2013) pointed out 8.82 d-1 as a possible additional frequency. Therefore, we calculated the least-squares fit by considering =8.860 d-1, but the residual r.m.s. (0.067 km s-1) is poorer than that obtained using =7.900 d-1 (0.041 km s-1). An additional analysis of new data (e.g., Antoci et al. 2013, in preparation) may be able to ascertain the true value. We adopted =7.900 d-1 to describe the dynamical structure of Pup, and the effect of this choice is evaluated at the end of Sect. 5.1.
Table LABEL:lfit lists the least-squares solution obtained from the HARPS data. The mean value of the radial velocity, 46.74 km s-1, and the value (peak-to-peak amplitude of the radial velocity curve), 9.9 km s-1, agree both excellently with all the literature values. The former suggests that Pup is a single star, the latter that the pulsation is very stable over decades (see also Moon & van Antwerpen 2009). The power spectrum of the residuals shows other modes excited around , but the poor spectral window does not allow us to confirm the values proposed by Antoci et al. (2013). In the other parts of the residual power spectrum we were able to observe not only the bunches of peaks related to the higher harmonics of , but also those related to the combination terms between (and harmonics) and the additional modes. As stressed by Antoci et al. (2013), these patterns affect the same region in which solar-like oscillations are expected to leave their fingerprints. All these unresolved components contribute to increase the residual r.m.s. of the solution.
Neither our radial velocity curve nor Ponsen’s photometry (blue light should be sensitive to this effect) show the bump provoked by a shock wave crossing the atmosphere (Dravins et al. 1977). The emission features in the Mg II lines and the radial velocity curves in the ultraviolet do not show any particular behaviour either (Fracassini et al. 1983). In the top panel of Fig. 4, cycle-to-cycle variations can be noticed especially at the minimum, which seems to occur at different phases. This strange behaviour is only apparent because Pup was observed more at the minimum that at the maximum. For sake of clarity, we investigated the possibility of transient or particular events in the atmosphere dynamics around maximum compression and subsequent expansion. A close examination of the core of the Ca II K line did not reveal any emission during the observations. Therefore, the cycle-to-cycle variations in radial velocity data are definitely unrelated to the variations in the chromospheric activity.
Dall & Frandsen (2002) investigated the presence of the pulsation in the line indices of the Balmer series using the DFOSC instrument mounted at the Danish 1.54m telescope in La Silla. Indeed, pulsation effects were found, and the authors calculated a ratio of 0.43 for the ratio between the amplitudes of variations in the H line and photometry. They considered a half-amplitude of 75 mmag from Eggen’s measurements, which is that derived from a simple inspection of the light curve. We obtained 0.58 for the yellow data and 0.49 for the blue data from the more accurate values resulting from the least-squares fits. Together with the available radial velocity/magnitude amplitude ratio (=10.0/0.11=91 km s-1 mag-1, see Yang et al. 1987, for review and summary), these results strengthen the identification of as a radial mode.
3.2 DX Cet
The solution of the radial velocity curve of DX Cet is much simpler than that of Pup. The five components =9.6197 d-1, , , and are detected in the power spectrum and provide a very satisfactory fit of the radial velocity curve (Table LABEL:lfit and Fig. 4). The fit of the Hipparcos data (ESA 1997) supplied the Fourier parameters , , and rad. They are typical values for HADS stars (Figs. 4, 5, and 6 in Poretti 2001). The mean magnitude is 7.0770.005, which in turn yields =7.00 for =0.33 (Bessell 2000). This value and the full amplitude of 0.21 mag as well agree with those reported by Kiss et al. (1999). The =23.1/0.21=110 km s-1 mag-1 value supports radial pulsation.
4 Pup and DX Cet as distance indicators
The Hipparcos parallaxes and the identification of the pulsation modes of Pup and DX Cet as the fundamental radial ones allowed us to test the P-L relations of HADS stars. There are two P-L relations:
| (3) |
(Poretti et al. 2008), and
| (4) |
(McNamara 2011). Eq. 3 was obtained by using all the short-period ( d) stars that pulsate in the fundamental radial mode and are located in a wide variety of stellar systems. It provides an excellent fit without knowing any other parameter than the period. The metal-dependent term was introduced in Eq. 4 with the goal to determine the same law for HADS and Cepheids and should only be considered when [Fe/H] (McNamara 2011).
For DX Cet, Eq. 3 supplies and Eq. 4 for [Fe/H]=. Both predictions agree excellently with the Hipparcos , and hence =0.104 d can definitely be identified as the fundamental radial mode. For instance, by assuming that the pulsation is in the first overtone mode, the corresponding fundamental mode would be 0.135 d, and the P-L relations would predict =1.3, which does match the Hipparcos . Due to the relevant error on the parallax, McNamara (2011) applied an LK correction ( mag, then =1.580.20; Lutz & Kelker 1973), but the star becomes too bright to fit the value predicted by Eq. 4 in a more satisfactory way.
However, because it is a statistical procedure, the LK correction is powerful when applied to a sample of stars (with same ) and is much more uncertain when applied to a single case (e.g., Oudmaijer et al. 1998).
The period of Pup is among the longest in the Sct sample. Eqs 3 and Eq. 4 predict similar values without the metal-dependent term, that is, and , respectively. The former agrees excellently with the very accurate Hipparcos value, while the latter is slightly outside errorbars. We note that using of the [Fe/H] correction in Eq. 4 shifts the calculated value too far () from the observed one. Therefore, this correction definitely does not have to be applied to stars when [Fe/H]. Moreover, assuming that is the first radial overtone, we derive =0.87 from the P-L relations, a too bright luminosity for the Hipparcos parallax. This convinced us that Pup is pulsating in the fundamental radial mode.
This achievement adds an important stellar candle to the sample of galactic Sct stars with known parallaxes. The current inventory is composed of nine stars (Table 2 in McNamara 2011). However, the identification of the fundamental radial mode is very reliable only for high-amplitude pulsation, that is, the HADS stars DX Cet, AI Vel, and SX Phe. One can add Sct itself, since detailed investigations (Templeton et al. 1997) corrected the previous identification of the dominant mode as a radial overtone (Balona et al. 1981). The remaining five cases are rather uncertain, starting with 1 Mon, whose dominant mode has been identified as an overtone (Balona & Stobie 1980). It is instructive to note that the dominant modes of FG Vir and X Cae are nonradial (Zima et al. 2006; Mantegazza et al. 2000): the fundamental radial mode, if it is indeed excited, has to be searched for in the low-amplitude terms, with a wide margin of uncertainty. Aql (Altair) is a fast rotating star and the nature of the very weak amplitude variations (0.001 mag) detected with the WIRE satellite can be generated by a wide variety of modes. In particular, there is no convincing evidence that the observed modes are radial ones (Suárez et al. 2005). Finally, no mode identification has been proposed for the small-amplitude variations (0.02 mag) observed for BS Tuc. Therefore, Pup is by far the most convincing case of a Sct pulsating in the fundamental radial mode with an accurate Hipparcos parallax.
5 Spectroscopic analysis
We performed a detailed analysis of the high-S/N HARPS spectra of Pup and DX Cet following the procedure described in Nardetto et al. (2006a). We selected 45 spectral lines, taking care that they were not blended.
We extracted radial velocity and line asymmetry curves for all selected lines of all stars. The method we use for the radial velocity (that is the best one to use when the signal-to-noise ratio allows it) is the first moment of the spectral line, RVc. The radial velocity curve derived from this method is absolutely independent of the spectral line width and the rotation. This property is extremely valuable for comparing the behaviour of different spectral lines of different pulsating stars. We also derived the spectral line asymmetries with a very high precision, using an estimator that we call the bi-Gaussian: two analytic semi-Gaussians are fitted to the blue and red part of the spectral line profile. The amount of asymmetry (in percentage) is then given by the comparison of the half-width at half-maximum of each semi-Gaussian (see Nardetto et al. 2006a, their Eqs. 2 and 3). This definition was well-suited to the data quality.
5.1 Pup
We performed a least-squares fit of the observed values of and by means of the Fourier series
| (5) |
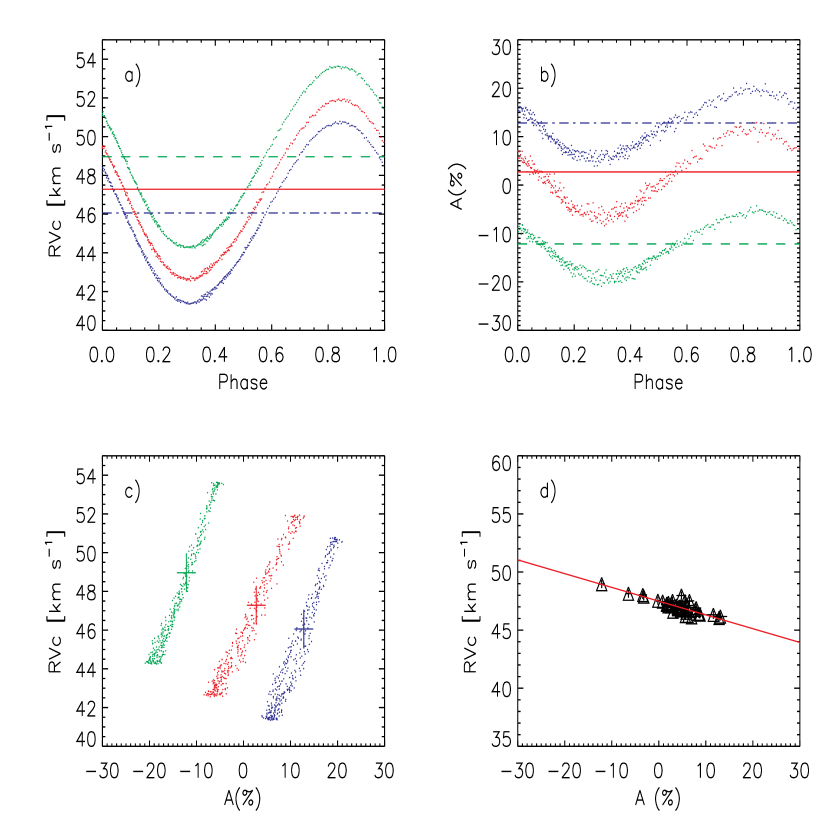
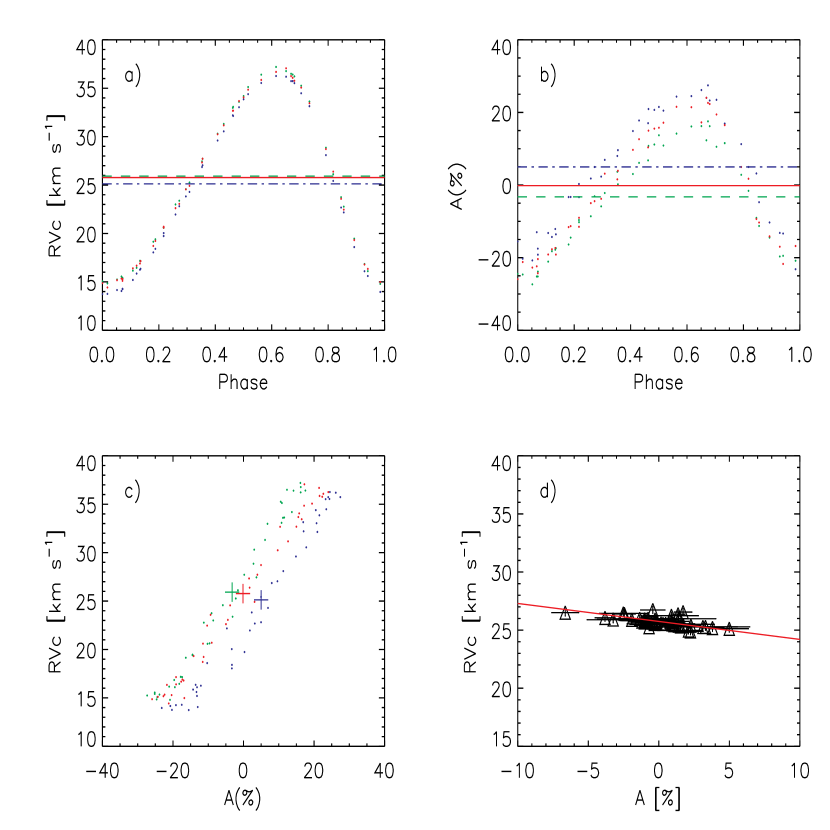
and by using =7.098d-1, =7.900 d-1, , , and . In this way we were able to fold the data on one mode by subtracting the contribution of the other. Figure 5 shows the folded points with of the radial velocities (panel a) and asymmetries (panel b) for the three following lines, CrII 4634.07 (blue), FeI 5410.91 (green), and FeI 6393.60 Å (red), respectively. The corresponding averages of these curves (or similarly values obtained from Eq. 5) are shown as horizontal lines in panels a and b (in dash-dotted, dashed and solid lines), and are called -velocities and -asymmetries. The residual systematic scatter is caused by the contamination from very small amplitude modes that are still not identified after and . There is an evident anticorrelation: higher velocities correspond to negative asymmetries, low velocities to positive asymmetries. This behaviour is also shown by the trend in the barycenters (big crosses) of the loops (Fig. 5, panel c). By plotting for each line the -velocity and the -asymmetry, we can calculate the parameters of the analytic relation
| (6) |
thus obtaining km s-1 and km s-1 (Fig. 5, panel d). Following Nardetto et al. (2008), the centre-of-mass velocity of the star is defined as km s-1(i.e., the -velocity corresponding to a null -asymmetry). We note that the contributions of =7.900 d-1 to the -velocity and -asymmetry are much less important than those of , which means that they affect the spectral line asymmetries in a marginal way. The k-term, defined as kkm s-1, where is the -velocity averaged over the 45 spectral lines. We briefly discuss the k-term problem in Sect. 5.3.
The next step of the spectroscopic analysis is to measure the velocity gradient within the atmosphere of the star. In Nardetto et al. (2007), we have shown that the line depth (taken at the minimum radius phase) is a good indicator of the line-forming regions. We use this definition of the line depth (hereafter ) in the following. In this case, the photosphere corresponds to a null line depth. By comparing the 2K amplitude (defined as the amplitude of the first-moment radial velocity curve, hereafter ) with the depth of the 45 spectral lines selected, one can in principle directly measure the atmospheric velocity gradient (at least in the part of the atmosphere where the lines form). For Pup, we found the following relation (see also Fig. 6):
| (7) |
This relation (in which we define the slope and the zero-point by and , respectively) can be used to derive the Baade-Wesselink projection factor following the semi-theoretical approach presented in Guiglion et al. (2013). The projection factor is used to convert the radial velocity into the pulsation velocity in the Baade-Wesselink methods of distance determination. It is composed of three terms: (Nardetto et al. 2007). First, the geometric projection factor, , is mainly related to the limb-darkening of the star. The linear limb-darkening law of the continuum intensity profile of the star provided by Claret & Bloemen (2011) is , where is the limb darkening of the star in band and is the angle between the normal of the star and the line of sight. For Pup we found (considering the rounded values K, , =4 km s-1, and ). Using the relation linking to : (Getting 1934; Hadrava et al. 2009), we found . In this determination of the geometric projection factor, we assumed (as done previously for Cepheids) that the limb-darkening variation within the lines (Nardetto et al. 2007) and that the geometric projection factor time-dependency in the R band (Nardetto et al. 2006b) are negligible.
Then, depends on the spectral line considered: (Nardetto et al. 2007, their Eq. 3). For Pup, it ranges from 0.94 () to 0.98 (). For a typical depth in our sample of , we find . Finally, there is a linear relation between (correction to the projection factor due to the differential velocity between the optical and gas layers at the photosphere of the star) and : (derived using classical Cepheids; Nardetto et al. 2007). When we apply this relation for Pup as in Guiglion et al. (2013) for the Sct stars AI Vel and Cas, we found . The final value of the projection factor of Pup is thus .
From a methodological point of view, it is interesting to note that we find and (i.e., a decrease of the slope and zero-point of the relation by 8% and 3%, respectively) when fitting the original data with and harmonics alone. In turn, this increases the value of , and consequently that of , by only 0.2%. In a similar way, there is no change in the parameters of Eq. 7 and a non-significant decrease of the zeropoint of Eq. 6 (from 8.86 to 8.84 km s-1) when using d-1 instead of 7.90 d-1 (see Sect. 3.1).
5.2 DX Cet
We applied the same analysis to DX Cet. Figure 7 (panels a and b) shows the radial velocity and line asymmetry curves for the three lines FeI 4213.65, FeI 5393.17, and FeI 6393.60 Å. We found the same anticorrelation between the -velocity and the -asymmetry:
The centre-of-mass velocity of the star is then km s-1and the k-term is .
For the atmospheric velocity gradient we found (Fig. 6)
| (8) |
which corresponds to a velocity gradient or correction of the projection factor ranging from 0.97 () to 0.99 (). The average value () was used. From the rounded values available in Claret & Bloemen (2011, K, , km s-1 and Z=), we obtained and a geometric projection factor . Considering, as for Pup, , we finally found a Baade-Wesselink projection factor for DX Cet.
6 Comparing Scuti stars with Cep stars and classical Cepheids
Our HARPS sample is composed of stars with a good phase coverage and for which we were able to measure the spectral line asymmetry properly. We have eight classical Cepheids (R TrA, S Cru, Y Sgr, Gem, Dor, RZ Vel, Car, and RS Pup; Nardetto et al. 2008), two Sct stars ( Pup and DX Cet; this paper), and the Cep star Lup (Nardetto et al. 2013). Moreover, we have other cases. AI Vel has an incomplete phase coverage that prevented us from measuring the -asymmetry, although we were able to measure the atmospheric velocity gradient and the projection factor. Cas is rotating too fast to measure the spectral line asymmetry or derive the atmospheric velocity gradient with a good precision. Thus, we determined the projection factor only with a large uncertainty (Guiglion et al. 2013). The classical Cepheid X Sgr shows spectral line splitting due probably to a shockwave in the atmosphere (Mathias et al. 2006). The Cep Lup shows significant nonradial modes (Nardetto et al. 2013) and we were unable to consistently apply the bi-Gaussian method to measure the line asymmetry.
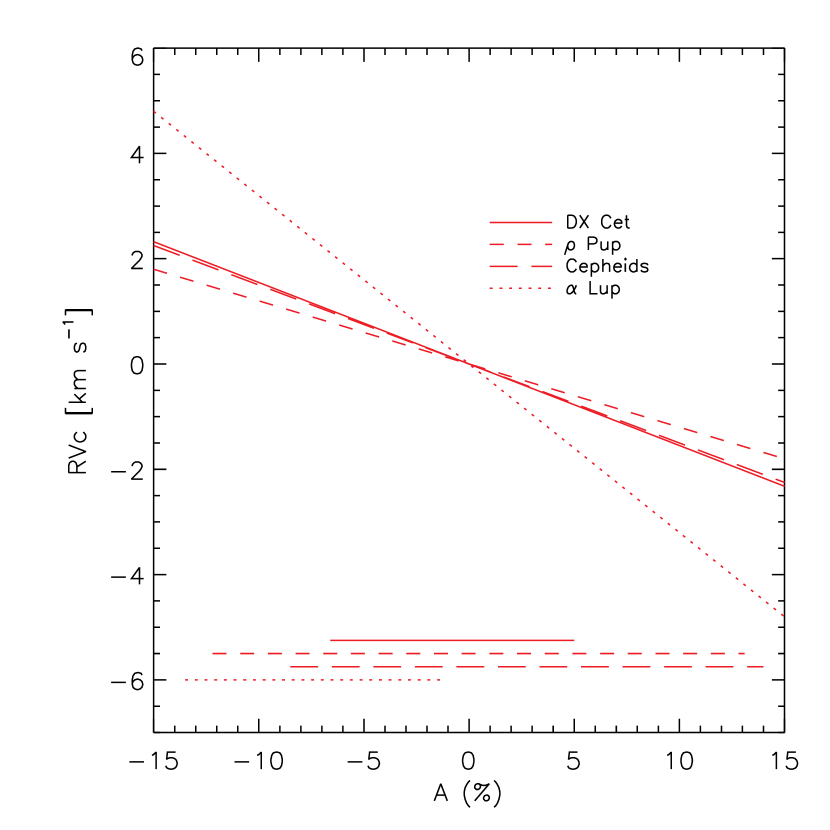
In Fig. 8, we compare relations between the -velocities and the -asymmetries (after correcting for the zero-point) found for Pup and DX Cet, with previous results obtained for the Cep star Lup and for the eight classical Cepheids mentioned above. It is remarkable that the results obtained for Scuti stars and classical Cepheids are consistent, while Lup shows a different behaviour (steeper slope of the relation). We also note that Lup has only negative -asymmetries (at least over the 55 spectral lines considered in Nardetto et al. 2013). It is currently very difficult to interpret this behaviour, but at least qualitatively, we can conclude that there is a particular physical mechanism that probably affects the Lup spectral lines asymmetry, while this is not the case for the Scuti and Cepheid stars.
For the k-term quantity, we found km s-1 and km s-1 for Pup and DX Cet, respectively. These values are consistent with those found for Cepheids (values ranging from 0 to km s-1 depending on the period of the star, Nardetto et al. 2013). By using a Cepheid in an eclipsing binary system ( d, d), Pilecki et al. (2013) independently found a blue-shifted value k=km s-1. On the other hand, Lup shows a red-shifted value k=2.2 km s-1.
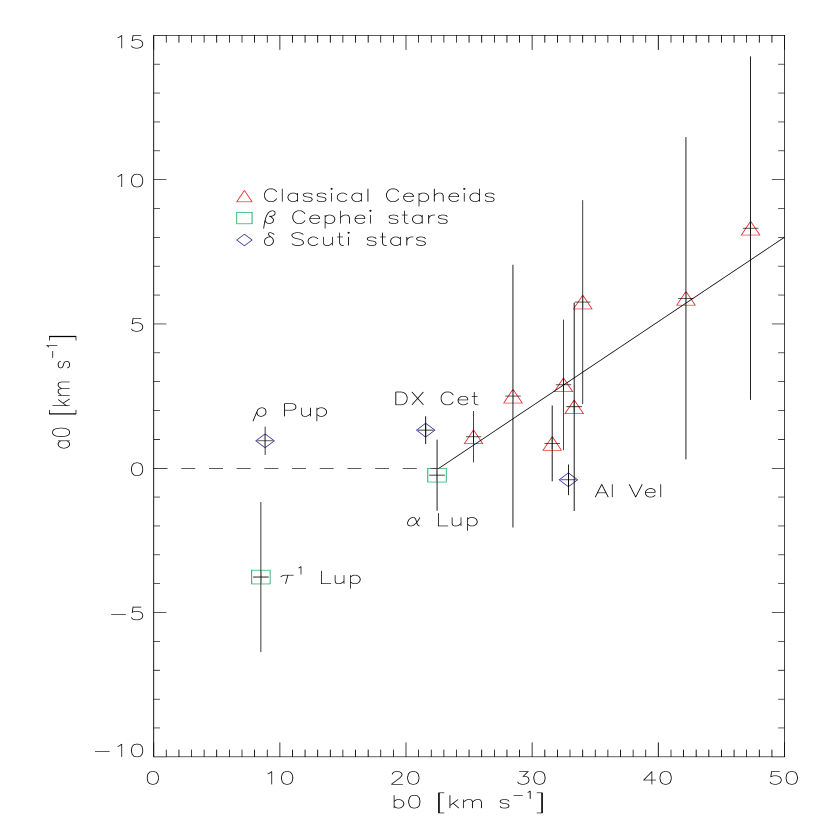
Figure 9 shows the slope (from the relation) as a function of the 2K-amplitude (i.e., ). The results obtained for Scuti stars, Cep stars, and classical Cepheids are compared. The case of Lup must be considered separately, as previously mentioned in Nardetto et al. (2013). This star indeed shows a reverse atmospheric velocity gradient, which means that a line forming in the upper part of the atmosphere has a 2K-velocity amplitude lower than a line forming closer to the photosphere. This might be because of the nonradial mode detected in the spectroscopic data. On the other hand, Pup has a null velocity gradient for a similar velocity amplitude of about km s-1. It has to be confirmed, but it seems that stars with a dominant radial mode and with lower than km s-1 have a null atmospheric velocity gradient (dashed line in the figure). Conversely, we can convincingly consider a linear trend (solid line in the figure) for 2K-amplitudes larger than 22.5 km s-1: .
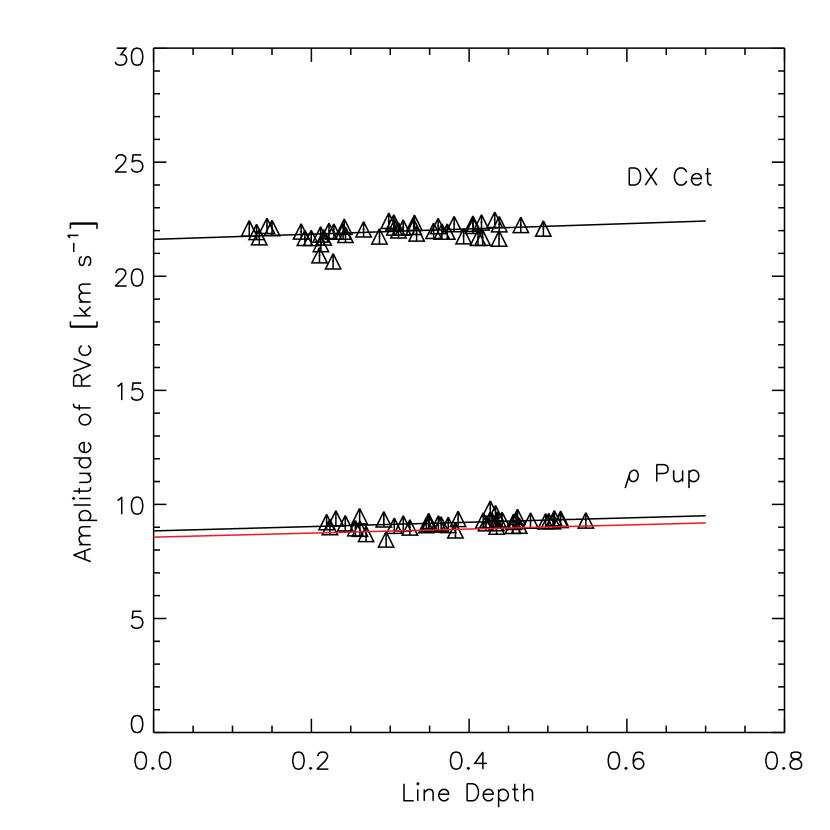
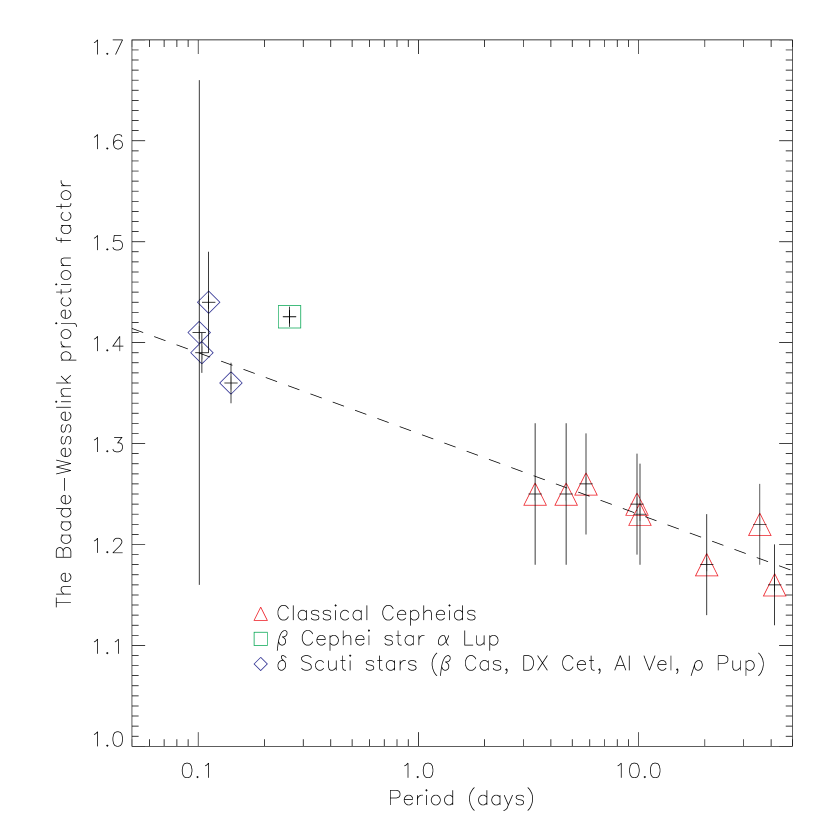
The comparison of the projection factors within our sample is also very interesting. In the framework of our project, we determined the Baade-Wesselink projection factor for four Sct stars: Pup (), DX Cet (), AI Vel (), and Cas (). Figure 10 shows that all these values excellently fit the extension toward short periods of the relation found for Cepheids, that is, (Nardetto et al. 2009). This result seems more robust than the similar one obtained by Laney & Joner (2009), who used an indirect method based on the comparison of geometric and pulsation parallaxes. On the other hand, the projection factor of the Cep star Lup is 8 higher than the relation (Fig. 10). By omitting Lup, we can determine the following relation common to Sct stars and classical Cepheids:
| (9) |
which is similar to the one derived for Cepheids only, but more precise (the reduced is 0.97).
However, we have to stress some methodological points. First, in the projection factor decomposition (), the third component, , was extrapolated for the Scuti stars (not for Lup, for which we used a dedicated hydrodynamical model), while the quantity was derived directly and independently from observations. We also recall that the geometric projection factor, , is directly linked to the limb-darkening and thus to the fundamental parameters of the stars. Second, for the Cepheids, the projection factors are consistent with the cross-correlation method of the radial velocity determination. For DX Cet and Pup, the line depth considered for the correction is typical (i.e., averaged over all lines considered in our sample), which means that the derived projection factors are in principle very close to those to be used in the cross-correlation method. For Lup, AI Vel, and Cas, there is no velocity gradient in the atmosphere and the projection factor is the same regardless of the line considered, and thus is consistent with the cross-correlation method. There remains only the fact that in the cross-correlation method a Gaussian is fitted to the cross-correlated spectral line profile, which in principle reduces the value of the projection factor by few percents compared with that based on the first-moment method (Nardetto et al. 2006a). Reducing the projection factor for short pulsators in Fig. 10 by a few percents will basically not change the relative position of Lup and our qualitative conclusion that the period-projection factor relation seems to straightly link Scuti stars and classical Cepheids. Third, the fast rotation of some Scuti stars (as well as the inclination of their rotation axis) can affect the projection factor by 10% or even more (Guiglion et al. 2013). However, the Scuti stars in our sample show values lower than 13 km s-1, except for Cas with km s-1.
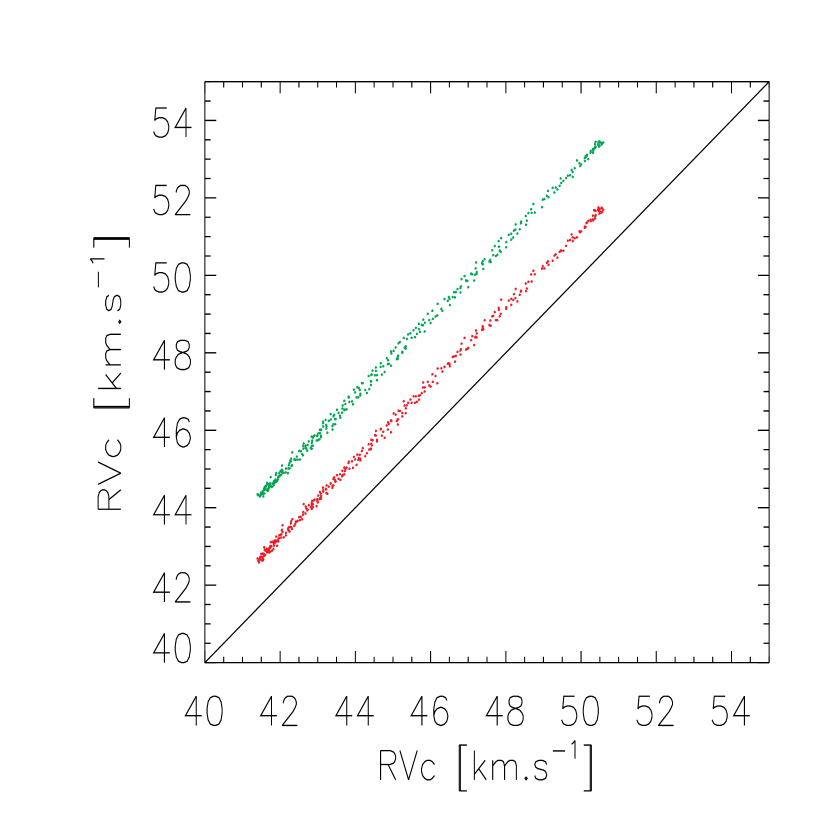
Even if we were able to derive both the Baade-Wesselink projection factors and the centre-of-mass velocities for the eleven pulsating stars in our sample, an effort (both observational and theoretical) has still to be made to understand the spectral line asymmetry properly. For classical Cepheids, the hydrodynamical models reproduce the observed velocities and even the atmospheric velocity gradient very well (Fokin 1996; Nardetto et al. 2004, 2007). Nevertheless, currently, there is no hydrodynamical model of pulsating stars that can correctly reproduce the -velocities and -asymmetries. In particular, we emphasize that the k-term quantity cannot be explained by a Van Hoof effect (Mathias et al. 1993, 1995). In Fig. 11, we show the Van Hoof diagram for the three spectral lines of Sect. 5.1 for Pup.
The Van Hoof effect is not detected because there is no phase shift between the radial velocities of the different spectral lines (i.e., no loops). We also find that the two curves have a slope close to one, indicating a null atmospheric velocity gradient, as already mentioned. Nevertheless, the zero-points of the two curves are shifted, as a result from the -velocity offsets (Fig. 5, panel a). The possible physical causes of these offsets (e.g., additional modes) are under analysis.
7 Conclusions
We presented HARPS high-resolution spectra of Pup and DX Cet, thus increasing our sample to eleven stars. Among them, the Cep star Lup shows an interesting positive value of km s-1 for the k-term, while other kinds of pulsating stars have negative values (ranging from to 0 km s-1). We also found that Pup shows the same 2K velocity amplitude ( km s-1) regardless of the spectral line considered in our sample (45 lines), while this is not the case for stars with amplitudes larger than 22.5 km s-1 , where a trend is indeed found as a function of the the line depth. This behaviour, if confirmed, would mean that the atmospheric velocity gradient correction on the Baade-Wesselink projection factor, , is equal to 1.0 for any type of pulsating star as soon as its 2K velocity amplitude is lower than 22.5 km s-1. Finally, we found that the period-projection factor relation might be common to classical Cepheids and Scuti, while the Cep star Lup stands at 8 above the relation.
The excitation of different pulsation modes (fundamental and overtone radial, pressure and gravity nonradial) usually makes the use of Sct stars as distance indicators problematic. For Pup, our analysis of light and radial velocity curves identified the dominant mode as the fundamental radial one. Because it is a very bright star with an accurate Hipparcos parallax, Pup can be now considered as the best standard candle for the Sct class. The Hipparcos absolute magnitude gives us a luminosity =1.38. Combined with =6650-6800 K, this implies that Pup is very close to the red border of the instability strip, probably leaving the central part where most of the HADS stars are located (Pamyatnykh 2000).
Moreover, from the Hipparcos parallax ( mas), the mean radius of (Antoci et al. 2013), and our value of the projection factor together with our radial velocity curve (in particular, km s-1), we were able to infer an absolute angular diameter variation of 11 as (or 0.7%). Unfortunately, there are no K photometric observations of Pup that cover a full pulsation cycle to which one might apply the infrared surface brightness relation and confirm these findings.
Acknowledgements.
The authors wish to thank the anonymous referee for useful comments. EP and MS acknowledge financial support from the Italian PRIN-INAF 2010 Asteroseismology: looking inside the stars with space- and ground-based observations. MR scknowledges financial support from the FP7 project SPACEINN: Exploitation of Space Data for Innovative Helio- and Asteroseismology. VSS is an Aspirant PhD fellow of the Fonds voor Wetenschappelijk Onderzoek, Vlaanderen (FWO), Belgium. NN and EP acknowledge the Observatoire de la Côte d’Azur for the one-month grant that has allowed EP to work at OCA in April and May 2013.References
- Antoci et al. (2013) Antoci, V., Handler, G., Grundahl, F. et al. 2013, MNRAS, 435, 1563
- Balona et al. (1981) Balona, L., Dean, J.F., & Stobie, R.S. 1981, MNRAS, 194, 125
- Balona & Stobie (1980) Balona, L., & Stobie, R.S. 1980, MNRAS, 190, 931
- Bessell (2000) Bessell, M.S. 2000, PASP, 112, 961
- Breger (1974) Breger, M. 1974, ApJ, 192, 75
- Breger & Bregman (1975) Breger, M., & Bregman, J.N. 1975, ApJ, 200, 343
- Claret & Bloemen (2011) Claret, A. & Bloemen, S. 2011, A&A, 529, 75
- Cousins (1951) Cousins, A.W. 1951, Observatory, 71, 199
- Dall & Frandsen (2002) Dall, T.H., & Frandsen S. 2002, A&A, 386, 964
- Donati et al. (1997) Donati, J.-F., Semel, M., Carter, B.D., Rees, D.E., & Collier Cameron, A. 1997, MNRAS, 291, 658
- Dravins et al. (1977) Dravins, D., Lind, J., & Särg, K. 1977, A&A, 54, 381
- Eggen (1956) Eggen, O.J. 1956, PASP, 68, 238
- ESA (1997) ESA 1997, The Hipparcos and Tycho Catalogues, ESA SP-1200
- Fokin (1996) Fokin, A. B., Gillet, D., & Breitfellner, M. G. 1996, A&A, 307, 503
- Fracassini et al. (1983) Fracassini, M., Pasinetti, L.E., Castelli, F., Antonello, E., & Pastori, L. 1983, Ap&SS, 97, 323
- Getting (1934) Getting, I.A. 1934, MNRAS, 95, 139
- Guiglion et al. (2013) Guiglion, G., Nardetto, N., Mathias, P., et al. 2013, A&A, 550, 10
- Hadrava et al. (2009) Hadrava, P., Slechta, M., & Skoda, P. 2009, A&A, 507, 397
- Kiss et al. (1999) Kiss, L.L., Csak, B., Thomson, J.R, & Szatmaty, K. 1999, Inf. Bull. Var. Stars n. 4660
- Kurtz (1976) Kurtz, D.W. 1976, ApJS, 32, 651
- Laney & Joner (2009) Laney, C. D., & Joner, D.J. 2009, AIPC, 1170, 93
- Lutz & Kelker (1973) Lutz, T.E., & Kelker, D.H. 1973, PASP, 85, 573
- Mantegazza et al. (2000) Mantegazza, L, Zerbi, F.M., & Sacchi, A. 2000, A&A, 354, 112,
- Mathias et al. (1993) Mathias, Ph. & Gillet, D., 1993, A&A, 278, 511
- Mathias et al. (1995) Mathias, Ph., Gillet, D., Fokin, A. B., Chadid, M., 1995, A&A, 298, 843
- Mathias et al. (1997) Mathias, Ph., Gillet, D., Aerts, C., & Breitfellner, M.G. 1997, A&A, 327, 1077
- Mathias et al. (2006) Mathias, Ph., Gillet, D., Fokin, A. B., et al. 2006, A&A, 457, 575
- Mayor et al. (2003) Mayor, M., Pepe, F., Queloz, D., et al. 2003, The Messenger, 114, 20
- McNamara (2011) McNamara, D.H. 2011, AJ, 142, 110
- Moon & van Antwerpen (2009) Moon, T. & van Antwerpen, C. 1997, JAAVSO, 37, 3
- Nardetto et al. (2004) Nardetto, N., Fokin, A., Mourard, D., et al. 2004, A&AP, 428, 131
- Nardetto et al. (2006a) Nardetto, N., Mourard, D., Kervella, P., et al. 2006a, A&A, 453, 309
- Nardetto et al. (2006b) Nardetto, N., Fokin, A., Mourard, D., et al. 2006b, A&A, 454, 327
- Nardetto et al. (2007) Nardetto, N., Mourard, D., Mathias, P., et al. 2007, A&A, 471, 661
- Nardetto et al. (2008) Nardetto, N., Stoekl, A., Bersier, D., et al. 2008, A&A, 489, 1255
- Nardetto et al. (2009) Nardetto, N., Gieren, W., Kervella P., et al. 2009, A&A, 502, 951
- Nardetto et al. (2013) Nardetto, N., Mathias, P., Fokin, A., et al. 2013, A&A, 553, 112
- Oudmaijer et al. (1998) Oudmaijer, R.D, Groenewegen, M.A.T., & Schrijver, H. 1998, MNRAS, 294, L41
- Pamyatnykh (2000) Pamyatnykh, A.A. 2000, Delta Scuti and Related Stars, ed. M. Breger & M.H. Montgomery, ASP Conf. Ser., 210, 215
- Pilecki et al. (2013) Pilecki, B., Graczyk, D., Pietrzynski, G. et al. 2013, MNRAS, 436, 953
- Ponsen (1963) Ponsen, J. 1963, Bull. Astron. Inst. Netherlands, 17 , 44
- Poretti (2001) Poretti, E. 2001, A&A, 371, 986
- Poretti et al. (2008) Poretti, E., Clementini, G., Held, E.V., et al. 2008, ApJ, 685, 947
- Poretti et al. (2011) Poretti, E., Rainer, M., Weiss, W.W., et al. 2011, A&A, 528, A147
- Prugniel et al. (2011) Prugniel, Ph., Vauglin, I., & Koleva, M. 2011, A&A, 531, A165
- Stetson (1991) Stetson, P. 1991, ApJ, 102, 589
- Storm et al. (2011a) Storm, J., Gieren, W., & Fouqué, P. et al. 2011a, A&A, 534, A94
- Storm et al. (2011b) Storm, J., Gieren, W., & Fouqué, P. et al. 2011b, A&A, 534, A95
- Stuetz et al. (2006) Stuetz, Ch., Bagnulo, S., Jehin, E., et al. 2006, A&A, 451, 285
- Suárez et al. (2005) Suárez, J.C., Bruntt, H., & Buzasi, D. 2005, A&A, 438, 633
- Templeton et al. (1997) Templeton, M.R., McNamara, B.J., Guzik, J.A., et al. 1997, AJ, 114, 1592
- Thulassi Doss (1969) Thulassi Doss, A. 1969, Kodaikanal Obs. Bull., 191
- Torres (2010) Torres, G. 2010, AJ, 140, 1158
- Vaniĉek (1971) Vaniĉek, P. 1971, Ap&SS, 12, 10
- van Leeuwen (2007) van Leeuwen, F. 2007, A&A, 474, 653
- Yang et al. (1987) Yang, S., Walker, G.A.H., & Bennett, P. 1987, PASP, 99, 425
- Zima et al. (2006) Zima, W., Wright, D., Bentley, J., et al. 2006, A&A, 455, 235