∎
22email: ivaltchanov@sciops.esa.int 33institutetext: R. Hopwood 44institutetext: Physics Department, Imperial College London, South Kensington Campus, SW7 2AZ, UK 55institutetext: E. Polehampton 66institutetext: RAL Space, Rutherford Appleton Laboratory, Didcot OX11 0QX, UK;
Institute for Space Imaging Science, Department of Physics & Astronomy, University of Lethbridge, Lethbridge, AB T1K3M4, Canada 77institutetext: D. Benielli 88institutetext: Aix Marseille Université, CNRS, LAM (Laboratoire d’Astrophysique de Marseille) UMR 7326, 13388, Marseille, France 99institutetext: T. Fulton & P. Imhof 1010institutetext: Blue Sky Spectroscopy, Lethbridge, AB, T1J 0N9, Canada;
Institute for Space Imaging Science, Department of Physics & Astronomy, University of Lethbridge, Lethbridge, AB T1K3M4, Canada 1111institutetext: T. Konopczyński 1212institutetext: Wrocław University of Technology, 27 Wybrzeże Wyspiańskiego St, 50-370 Wrocław, Poland
Herschel Science Centre, ESAC, P.O. Box 78, 28691 Villanueva de la Cañada, Madrid, Spain 1313institutetext: T. Lim 1414institutetext: RAL Space, Rutherford Appleton Laboratory, Didcot OX11 0QX, UK 1515institutetext: N. Lu 1616institutetext: NHSC/IPAC, 100-22 Caltech, Pasadena, CA 91125, USA 1717institutetext: N. Marchili 1818institutetext: Universitá di Padova, I-35131 Padova, Italy 1919institutetext: D. Naylor 2020institutetext: Institute for Space Imaging Science, Department of Physics & Astronomy, University of Lethbridge, Lethbridge, AB T1K3M4, Canada 2121institutetext: B. Swinyard 2222institutetext: RAL Space, Rutherford Appleton Laboratory, Didcot OX11 0QX, UK;
Dept. of Physics & Astronomy, University College London, Gower St, London, WC1E 6BT, UK
Relative pointing offset analysis of calibration targets with repeated observations with Herschel-SPIRE Fourier-Transform Spectrometer ††thanks: Herschel is an ESA space observatory with science instruments provided by European-led Principal Investigator consortia and with important participation from NASA.
Abstract
We present a method to derive the relative pointing offsets for SPIRE Fourier-Transform Spectrometer (FTS) solar system object (SSO) calibration targets, which were observed regularly throughout the Herschel mission. We construct ratios of the spectra for all observations of a given source with respect to a reference. The reference observation is selected iteratively to be the one with the highest observed continuum. Assuming that any pointing offset leads to an overall shift of the continuum level, then these represent the relative flux loss due to mispointing. The mispointing effects are more pronounced for a smaller beam, so we consider only the FTS short wavelength array (SSW, 958–1546 GHz) to derive a pointing correction. We obtain the relative pointing offset by comparing to a grid of expected losses for a model source at different distances from the centre of the beam, under the assumption that the SSW FTS beam can be well approximated by a Gaussian. In order to avoid dependency on the point source flux conversion, which uses a particular observation of Uranus, we use extended source flux calibrated spectra to construct for the SSOs. In order to account for continuum variability, due to the changing distance from the Herschel telescope, the SSO ratios are normalised by the expected model ratios for the corresponding observing epoch. We confirm the accuracy of the derived pointing offset by comparing the results with a number of control observations, where the actual pointing of Herschel is known with good precision. Using the method we derived pointing offsets for repeated observations of Uranus (including observations centred on off-axis detectors), Neptune, Ceres and NGC 7027. The results are used to validate and improve the point-source flux calibration of the FTS.
Keywords:
SPIRE Fourier Transform SpectrometerCalibration Spectroscopy Pointing Herschel Observatory Uranus Neptune Ceres NGC 70271 Introduction
The Spectral and Photometric Imaging REceiver (SPIRE: Griffin et al. 2010) is one of the three focal plane instruments on board the ESA Herschel Space Observatory (Pilbratt et al., 2010). SPIRE consists of an imaging photometric camera and an imaging Fourier-Transform Spectrometer (FTS). The FTS works on the principle of interferometry: the incident radiation is separated in two beams that travel different optical paths before recombining. Thus the signal, that is measured by the FTS, is not the direct flux density in the passband, but the Fourier component of the spectral content (see Swinyard et al. 2010, 2013 and the SPIRE Observers’ Manual111The SPIRE Observers’ Manual is available at the Herschel Science Centre web:
http://herschel.esac.esa.int/Docs/SPIRE/pdf/spire_om.pdf for more details). The final FTS spectra, after the inverse Fourier transform, cover two wide frequency bands: SLW (447–990 GHz) and SSW (958–1546 GHz) at high (HR, GHz) and low (LR, GHz) spectral resolution.
The SPIRE FTS flux calibration is a two stage process (see Swinyard et al. 2010, 2013 for more details): firstly, the telescope is used to derive the extended source calibration, which converts the interferogram signal timeline from Volts to W m-2 Hz-1 sr-1 and provides level-1 spectra. Secondly, extended data is converted to flux density units of Jy ( W m-2 Hz-1) to provide point source calibrated (level-2) spectra. FTS uses Uranus as the primary point source calibrator.
The FTS flux calibration is split into two epochs, due to a change in the position of the internal beam-steering mirror (BSM) at the start of the Herschel operational day (OD) 1011 (19 Feb 2012, see Swinyard et al. 2013). The change effectively moved the centre of the FTS beam closer to the telescope optical axis. The earlier BSM position was at with respect to the telescope commanded sky position. Therefore the currently implemented point-source flux calibration uses two sets of Uranus observations: “before” and “after” od 1011.
It is important to know the pointing offset for the primary calibrator. There is no a priori knowledge of the actual pointing of the Herschel telescope for staring observations with the FTS, i.e. in sparse mode. We know the commanded pointing error (or the absolute pointing error, APE) of Herschel is at 68% confidence level throughout the Herschel mission, with significant improvement for observations after 11 Mar 2013 (or Herschel’s operational day od 1032), down to APE (see Sánchez-Portal et al. 2013 for details). The uncertainty in the pointing can lead to significant differences in the derived flux calibration, if a perfectly centred source is assumed. An additional source of pointing uncertainty is the stability of the pointing (or the relative pointing error RPE) once the telescope is commanded to the target position. The RPE is estimated at for moving targets (i.e. solar system objects, SSO) and smaller for non-moving ones (Sánchez-Portal et al., 2013). This is insignificant compared to the smallest SPIRE FTS beam ( at 1500 GHz, see later) and for the rest of the analysis we consider the pointing to be perfectly stable. Nevertheless, we include the RPE in the error budget for the results.
We have determined the pointing offsets for all Uranus observations, including those currently used for the point-source calibration. Hence the presented work has important consequences for the flux calibration scheme as well as for future improvements by combining more than one observation of the primary calibrator.
Adding more calibration targets with repeated observations is a consistency check for the method itself and for the derived point source flux calibration scheme, especially for targets with relatively well known and accurate models. For example, without knowing the Neptune pointing we cannot conclude if the flux calibration scheme is good, because any pointing offset of Neptune will lead to a difference of the observed versus the model flux of Neptune, which will not be related to the accuracy of the flux calibration scheme.
The structure of this paper is the following: in the next section (§ 2) we present the method, using two types of synthetic source models – a Dirac -function or a disk with a given radius and we derive a grid of the expected flux losses for a source at a range of distances from the centre of the FTS Gaussian beam. Then in § 3 we present the results on the relative pointing offsets for Uranus, Neptune, Ceres and NGC 7027, concentrating mostly on Uranus as the primary calibrator for the SPIRE Spectrometer. We end the paper in § 4 with our conclusions and some insights on possible further improvements in the flux calibration scheme.
2 Method
The method uses level-1 data of repeated FTS observations of calibration targets, performed in high (HR) or low (LR) spectral resolution. All level-1 data were reprocessed with the latest user reprocessing script in the Herschel Interactive Processing Environment (hipe, Ott et al. 2010) version 11 and SPIRE calibration tree version spire_cal_11_0. To avoid any dependence on Uranus, we use level-1 data, because level-2 spectra are calibrated using a particular Uranus observation. In addition, we consider only an overall continuum shift and ignore any change in the spectral slope or other non-linear effects.
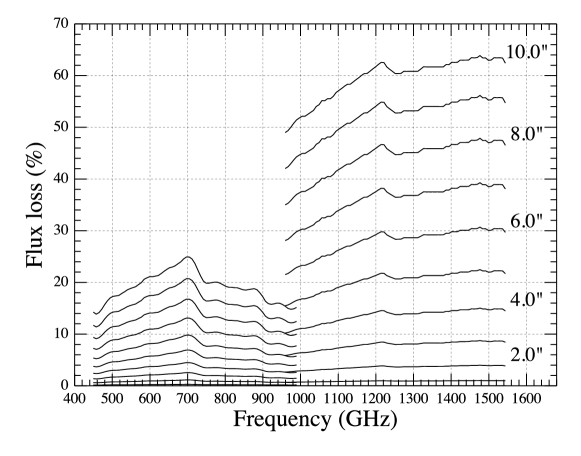
The analysis is performed solely using the FTS short wavelength array central detector, SSWD4. A simple Gaussian for the beam provides a good approximation over the frequencies of interest, 900–1500 GHz (see Makiwa et al. 2013 for more details) where the full width at half maximum (FWHM) is of the order of 17′′. A smaller beam, however, means any pointing offset leads to more significant flux loss. This is shown in Fig. 1 for a perfect point source (a -function) placed at different offsets from the FTS beam centre. And indeed, the flux loss for SLW even at the extreme offset is 15-25%, while it is 50-60% in SSW.
As seen by Herschel, Uranus, Neptune and Ceres are variable sources due to their distance from the Sun, their rotation and the telescope position on its orbit around the second Lagrange point L2. The changes in the brightness due to the variability will have the same effect as a pointing offset, i.e. overall continuum shift. This complicates the analysis because we need to know the predicted planet flux for the exact time of the observation. The planetary models used in this analysis are ESA-4 for Uranus (based on the updated model of Orton et al. 2013) and ESA-3 for Neptune (based on the updated model of Moreno 1998)222Both planets models are available at: ftp://ftp.sciops.esa.int/pub/hsc-calibration/PlanetaryModels/. The absolute systematic flux calibration uncertainties in these models, derived by comparing Uranus and Neptune, are of the order of 3% (Swinyard et al., 2013). For Ceres we use the models by Müller & Lagerros (2002), which are more uncertain, at %, because of the systematic phase variance due to the use of shorter wavelength data from ISO.
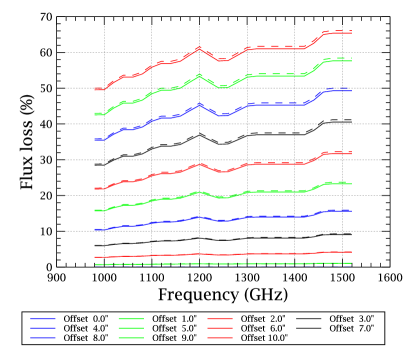
To derive the flux loss we assume the FTS has a Gaussian beam with FWHM at a given frequency . We calculate the flux loss for two cases of a source shape: (1) a perfect point source represented by a Dirac -function and (2) a disk with radius , which in the 1D case is a tophat function:
| (1) |
In both cases, the source is moved on a grid of pointing offsets from 0 to a maximum with respect to centre of the Gaussian beam and then it is convolved with the beam. That is
| (2) |
for source, and
| (3) |
for a uniform disk of radius , where , is a normalisation constant and is the error function. For a uniform disk centred in the beam, i.e. , then is the beam correction factor as used in the flux calibration scheme (Swinyard et al., 2013). The flux loss at a given frequency is then
| (4) |
where comes either from Eq. 2 or Eq. 3. The results are shown in Fig. 2. In the case of Uranus, with a typical size of , the tophat and the -function results are different by less than 1%, even for an extreme pointing offset of . For Neptune, which has an angular radius smaller than Uranus – typically around – this difference is negligible.

Let us assume a reference observation ¡ref¿ with the source exactly in the centre of the beam. If the source has constant brightness then
| (5) |
will be a measure of the flux loss at frequency , and the loss can be considered as only due to the pointing offset of ¡obs¿ with respect to ¡ref¿. A source with constant brightness included in this study is NGC 7027 but for the solar system objects Uranus, Neptune and Ceres, the brightness depends on when they were observed, which means the direct ratio has to be corrected for the predicted flux from the planet, i.e.
| (6) |
where is the ratio of the modelled fluxes at the two epochs of ¡ref¿ and ¡obs¿. Note that the model ratio is independent of the frequency, i.e. the models for observations at different epochs only differ by an overall continuum shift, independent of the frequency.
The choice of the reference observation is iterative. All ratios are constructed taking an arbitrary ¡ref¿ observation and then we pick the one that has the lowest , below or at zero. Indeed, if the selected reference observation is the one where the target is closest to the centre of the beam then there will be no smaller than zero, within the margin of the model uncertainties.
An HR observation is always selected as reference. In order to avoid large fluctuations in the ratios we smooth it with a 20 GHz boxcar function, after performing the division. For LR observations we interpolate the smoothed reference HR spectra to the same frequency grid as the LR observation, before deriving the ratio. This avoids huge fluctuations, especially in the case of Neptune, where there are emission and absorption lines present in the spectra.
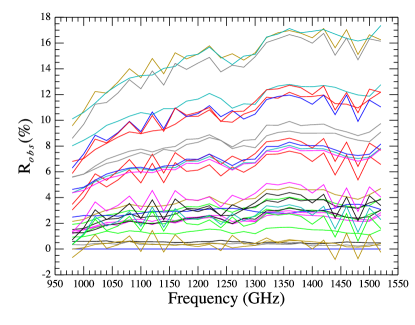
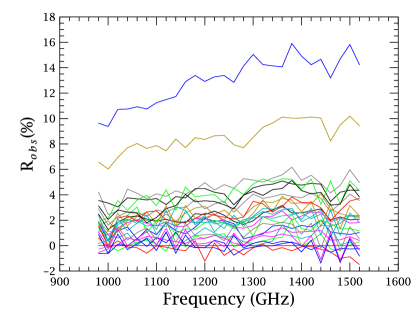
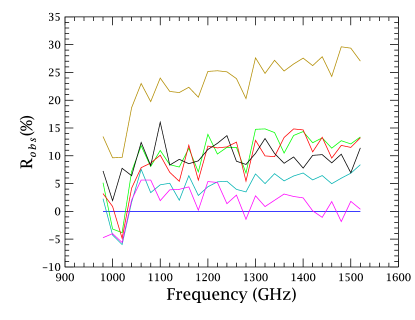
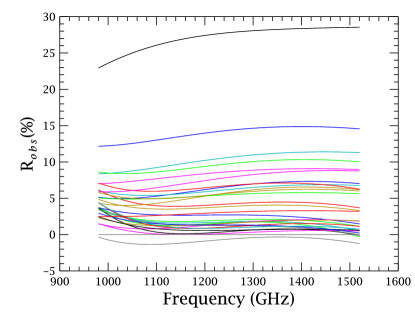
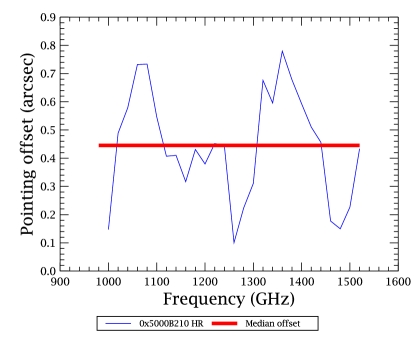
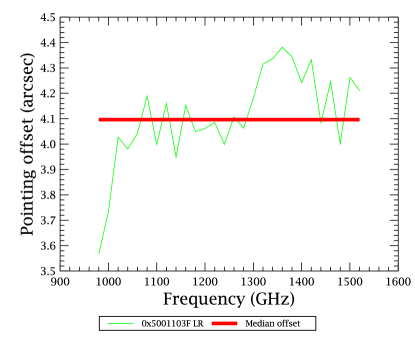
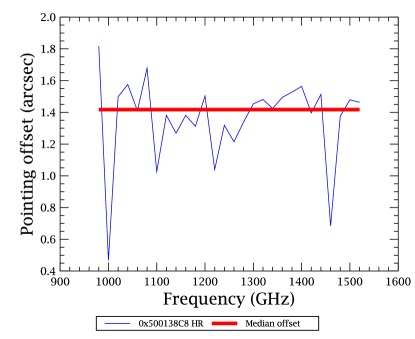
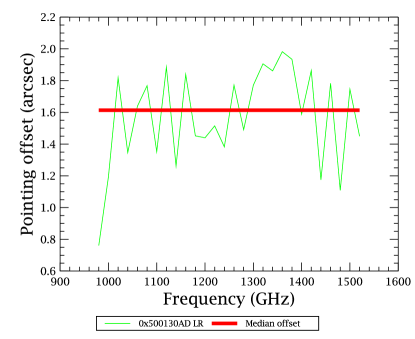
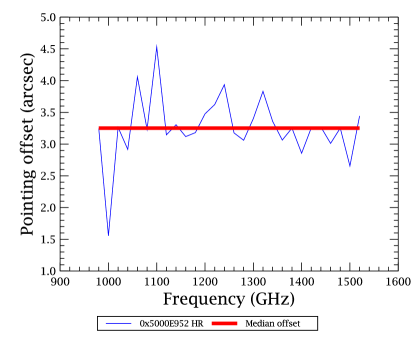
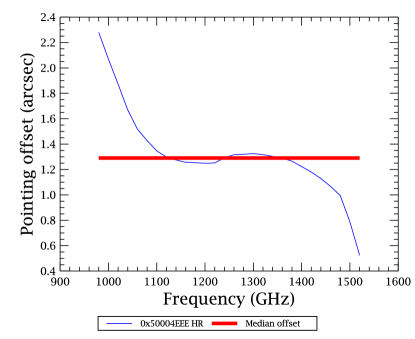
Fig. 3 shows the for all targets included in this study. The relative pointing offset is derived by comparing with the grid of simulated offsets (i.e. Fig. 2). If the flux loss is only due to pointing then the derived pointing offset should be constant with frequency. The results for a few observations are shown in Fig. 4. We calculate the median offset and the median absolute deviation (as a robust measure of the spread) considering frequencies from 1100 to 1400 GHz, in order to avoid large fluctuations near the band edges.
As the method is relative, the uncertainties coming from the models (for SSOs) cancel out and the only factors entering the error budget are the pointing stability (the RPE) of (assumed perfect for the method) and the uncertainty of 1% on coming from the statistical repeatability of the observations (Swinyard et al., 2013). In most cases the RPE is the dominant uncertainty in the derived offsets.
3 Results
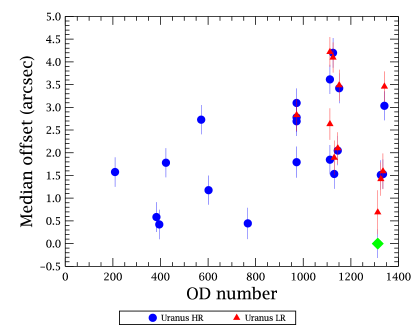
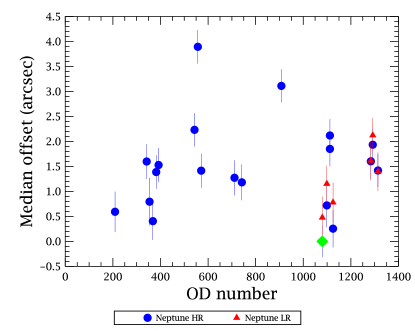
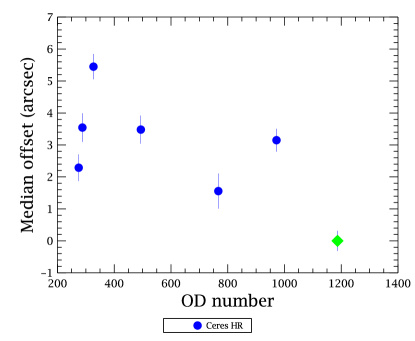
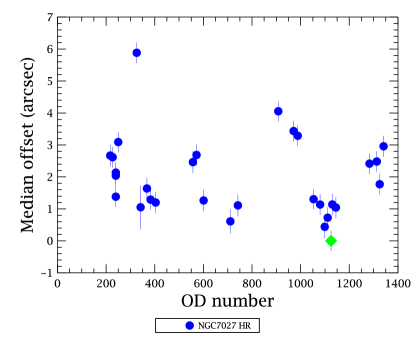
The above method was applied to all observations of Uranus, Neptune, Ceres and NGC 7027 and the results are shown in Fig. 5 and tabulated in Tabs. 1–5. For Uranus and Neptune, we also include low resolution observations. Note that for Neptune, Ceres and NGC 7027 we used a -function for the source shape.
| OD | OBSID (hex) | Res | Offset (′′) | Comments |
| 1313 | 1342257307 (0x5001389B) | HR | ¡ref¿ | |
| 1342257305 (0x50013899) | LR | |||
| 209 | 1342187880 (0x50002968) | HR | ||
| 383 | 1342197472 (0x50004EE0) | HR | ||
| 395 | 1342198273 (0x50005201) | HR | ||
| 423 | 1342200175 (0x5000596F) | HR | ||
| 571 | 1342210844 (0x5000831C) | HR | ||
| 602 | 1342212338 (0x500088F2) | HR | ||
| 767 | 1342222864 (0x5000B210) | HR | ||
| 972 | 1342237013 (0x5000E955) | HR | ||
| 1342237014 (0x5000E956) | HR | |||
| 1342237016 (0x5000E958) | LR | |||
| 1342237017 (0x5000E959) | HR | bsm_old | ||
| 1342237017 (0x5000E959) | HR | bsm_new | ||
| 1112 | 1342246283 (0x50010D8B) | LR | bsm_old | |
| 1342246283 (0x50010D8B) | LR | bsm_new | ||
| 1342246285 (0x50010D8D) | HR | bsm_old | ||
| 1342246285 (0x50010D8D) | HR | bsm_new | ||
| 1125 | 1342246974 (0x5001103E) | HR | ||
| 1342246975 (0x5001103F) | LR | |||
| 1130 | 1342247100 (0x500110BC) | HR | ||
| 1342247101 (0x500110BD) | LR | |||
| 1145 | 1342247618 (0x500112C2) | HR | ||
| 1342247619 (0x500112C3) | LR | |||
| 1151 | 1342247767 (0x50011357) | HR | ||
| 1342247766 (0x50011356) | LR | |||
| 1326 | 1342257926 (0x50013B06) | HR | ||
| 1342257927 (0x50013B07) | LR | |||
| 1335 | 1342258697 (0x50013E09) | HR | ||
| 1342258696 (0x50013E08) | LR | |||
| 1341 | 1342259588 (0x50014184) | HR | ||
| 1342259587 (0x50014183) | LR |
3.1 Uranus
The results for Uranus, for the central detector SSWD4, are shown in Tab. 1 and in Fig. 5 (upper left panel). The current point source calibration in spire_cal_11_0 uses deep (22 repetitions) Uranus observations: obsid 1342197472 (HR) from od 383 and obsid 1342237016 (LR) from od 972 for observations before od 1011 and obsid 1342246285 and obsid 1342246283 from od 1112 for HR and LR respectively, for observations after od 1011 (see Swinyard et al. 2013 for more details). In od 1112, the observations of Uranus were followed by a specially designed LR map on the target, which was used to derive a pointing offset of . This offset was used to correct the “after” observations of Uranus before using them for point source conversion. Hence it is important to confirm the derived correction by an independent estimation. The results of the method, shown in Tab. 1, for the two Uranus observations performed on the same od 1112 are (HR, bsm_new case) and (LR, bsm_new case). The agreement is within the uncertainties for the HR observation, while it is marginally consistent with the LR observation. A similar LR map was taken for the observations of Uranus in od 1313 and the map derived offset is . Our method reproduces this offset quite well: the LR observation obsid 1342257305 is at , while our reference HR observation obsid 1342257307 is by definition at zero offset. This is in support that Uranus during the reference observation was indeed well centred. This also provides a good consistency check for the method.
Additional consistency check of the method are the two special Uranus observations in od 1112: obsid 1342246285 (HR) and obsid 1342246283 (LR), with the beam-steering mirror at the two positions “bsm_old” and “bsm_new”. From the results in Tab. 1 we see a difference of 1.6′′ (LR) and 1.8′′ (HR), which is in very good agreement with the known 1.7′′ offset between the two BSM positions.
As can be seen from Fig. 5 and Tab. 1, there is no systematically worse pointing for Uranus observations before od 1011, when the BSM mirror home position was at 1.7′′ with respect to the optical axis. We attribute this to the small BSM offset, in comparison to the smallest FTS beam, as well as the similar magnitude of the APE uncertainty, which makes it such that no systematic effects are seen.
3.2 Uranus on off-axis detectors
In addition to the observations of Uranus in the central detectors (SSWD4 and SLWC3), we also performed observations on the unvignetted SSW off-axis detectors, i.e. those with centres within from SSWD4. These observations were used to derive the point source conversion for the off-axis detectors. This calibration is useful when there are serendipitous point sources in the field of the FTS that fall on an off-axis detector or in the case of spectral mapping observations with both point sources and extended emission. As this calibration is also important, we assess the pointing accuracy of the associated Uranus observations.
The results after applying the relative pointing method, using as reference obsid 1342257307 from od 1313, are shown in Tab. 2 and they indicate that the pointing offsets vary significantly: from 2-3′′to 6-7′′. These large pointing offsets reflect the fact that the accurate positions of the off-axis detectors, measured during the Herschel Performance Verification phase, were not updated in the Spacecraft-to-Instrument Alignment Matrix (SIAM) — for some detectors the error is . The SIAM was used to move the telescope in order to center the target on a particular off-axis detector for the observations in od 767 and od 972, while a differential telescope offset, with respect to the central detector, was used during the observations in od 383. This can explain the systematically better pointing results for od 383 observations. The reason that the SIAM apertures were never corrected for off-axis detectors was that all standard science observations were aligned using the SIAM for the central detectors (i.e. the error only affects this particular set of calibration observations).
With the proposed method and results we can properly calibrate the off-axis detectors with Uranus, after correcting them for the pointing offsets. This will improve significantly the point-source flux calibration, as in some cases the correction is up to 30-35%. This has implications for the overall flux calibration of the off-axis detectors and also for mapping observations, when they are converted to point-source flux density units (Jy).
Regarding the off-axis detectors in SLW, some of them are co-aligned with SSW detectors, although the SLW beam centres do not perfectly match the SSW beam centres. This intrinsic misalignment is not taken into account in the current calibration scheme, however we expect the effects of this correction to be at less than a 3% level, because of the large SLW beam.
| Detector | OD | OBSID (hex) | Offset (′′) |
|---|---|---|---|
| SSWC2/SLWD3 | 383 | 1342197477 (0x50004EE5) | |
| SSWC5/SLWB3 | 383 | 1342197476 (0x50004EE4) | |
| SSWE5/SLWB2 | 383 | 1342197473 (0x50004EE1) | |
| SSWF3/SLWC2 | 383 | 1342197475 (0x50004EE3) | |
| SSWB3/SLWC4 | 383 | 1342197478 (0x50004EE6) | |
| SSWE2/SLWD2 | 383 | 1342197474 (0x50004EE2) | |
| SSWE4 | 767 | 1342222865 (0x5000B211) | |
| SSWE3 | 767 | 1342222866 (0x5000B212) | |
| SSWD3 | 767 | 1342222867 (0x5000B213) | |
| SSWC3 | 767 | 1342222868 (0x5000B214) | |
| SSWC4 | 767 | 1342222869 (0x5000B215) | |
| SSWD2 | 972 | 1342237021 (0x5000E95D) | |
| SSWD6 | 972 | 1342237022 (0x5000E95E) | |
| SSWB2 | 972 | 1342237019 (0x5000E95B) | |
| SSWB4 | 972 | 1342237020 (0x5000E95C) | |
| SSWF2 | 972 | 1342237023 (0x5000E95F) |
3.3 Neptune
The relative pointings for Neptune are shown in Tab. 3 and in Fig. 5, upper right panel. The results for the observations in od 1112, at the two BSM positions, are not showing the expected difference of . We attribute this discrepancy to the unfortunate direction on the sky of the 1.7′′ BSM offset (which is always fixed in instrument coordinates) from the old to the new position, placing the planet between both beam centres.
Similarly to Uranus, we see a good agreement between observations performed during the same day and observations in LR and HR mode. There is no systematic off-pointing for observations before od 1011.
| OD | OBSID(hex) | Res | Offset (′′) | |
|---|---|---|---|---|
| 1080 | 1342245081 (0x500108D9) | HR | ||
| 1342245080 (0x500108D8) | LR | |||
| 209 | 1342187887 (0x5000296F) | HR | ||
| 342 | 1342195348 (0x50004694) | HR | ||
| 354 | 1342195771 (0x5000483B) | HR | ||
| 368 | 1342196617 (0x50004B89) | HR | ||
| 382 | 1342197368 (0x50004E78) | HR | ||
| 392 | 1342198429 (0x5000529D) | HR | ||
| 543 | 1342208385 (0x50007981) | HR | ||
| 557 | 1342209855 (0x50007F3F) | HR | ||
| 571 | 1342210841 (0x50008319) | HR | ||
| 711 | 1342219564 (0x5000A52C) | HR | ||
| 742 | 1342221703 (0x5000AD87) | HR | ||
| 908 | 1342231992 (0x5000D5B8) | HR | ||
| 1099 | 1342245866 (0x50010BEA) | HR | ||
| 1342245865 (0x50010BE9) | LR | |||
| 1112 | 1342246280 (0x50010D88) | HR | bsm_old | |
| 1342246280 (0x50010D88) | HR | bsm_new | ||
| 1125 | 1342246977 (0x50011041) | HR | ||
| 1342246976 (0x50011040) | LR | |||
| 1284 | 1342255278 (0x500130AE) | HR | ||
| 1342255277 (0x500130AD) | LR | |||
| 1292 | 1342256096 (0x500133E0) | HR | ||
| 1342256095 (0x500133DF) | LR | |||
| 1314 | 1342257352 (0x500138C8) | HR | ||
| 1342257350 (0x500138C6) | LR |
| OD | OBSID (hex) | Offset (′′) |
|---|---|---|
| 1187 | 1342249467 (0x500119FB) | |
| 275 | 1342190673 (0x50003451) | |
| 288 | 1342191220 (0x50003674) | |
| 327 | 1342193667 (0x50004003) | |
| 494 | 1342204878 (0x50006BCE) | |
| 767 | 1342222862 (0x5000B20E) | |
| 972 | 1342237010 (0x5000E952) |
| OD | OBSID (hex) | Offset (′′) |
|---|---|---|
| 1125 | 1342246971 (0x5001103B) | |
| 217 | 1342188197 (0x50002AA5) | |
| 227 | 1342188670 (0x50002C7E) | |
| 240 | 1342189121 (0x50002E41) | |
| 240 | 1342189124 (0x50002E44) | |
| 240 | 1342189125 (0x50002E45) | |
| 250 | 1342189543 (0x50002FE7) | |
| 326 | 1342193812 (0x50004094) | |
| 342 | 1342195347 (0x50004693) | |
| 368 | 1342196614 (0x50004B86) | |
| 383 | 1342197486 (0x50004EEE) | |
| 404 | 1342198921 (0x50005489) | |
| 557 | 1342209856 (0x50007F40) | |
| 572 | 1342210858 (0x5000832A) | |
| 601 | 1342212324 (0x500088E4) | |
| 711 | 1342219571 (0x5000A533) | |
| 742 | 1342221697 (0x5000AD81) | |
| 908 | 1342231993 (0x5000D5B9) | |
| 971 | 1342237007 (0x5000E94F) | |
| 988 | 1342238245 (0x5000EE25) | |
| 1053 | 1342243593 (0x50010309) | |
| 1080 | 1342245075 (0x500108D3) | |
| 1099 | 1342245861 (0x50010BE5) | |
| 1111 | 1342246255 (0x50010D6F) | |
| 1130 | 1342247106 (0x500110C2) | |
| 1145 | 1342247623 (0x500112C7) | |
| 1283 | 1342255260 (0x5001309C) | |
| 1313 | 1342257340 (0x500138BC) | |
| 1325 | 1342257918 (0x50013AFE) | |
| 1341 | 1342259592 (0x50014188) |
3.4 Ceres
Ceres is another SSO included in the analysis, with 7 observations all in HR mode, for which the results are show in Tab. 4 and in Fig. 5, bottom left. The results can be used to improve the current Ceres models. There are other asteroids with repeated FTS observations and this method can be applied to correct for pointing effects in their scientific analysis (Lim et al, in preparation).
3.5 NGC 7027
The results for NGC 7027 are shown in Tab. 5 and in Fig. 5, bottom right. The case of NGC 7027 is sightly complicated because the source has many emission lines and in order to apply the reference ratio method we need to extract the continuum. We did this by simultaneously fitting the brightest lines and the continuum in the level-2 spectrum. The fitted continuum — a polynomial of a second order — is then used to calculate . We note that the use of a second order polynomial is potentially a poor fit at frequencies above 1400 GHz and below 1100 GHz (see Fig. 4), but as we limit the median estimation within [1110,1400] GHz then the effects do not bias the results. There was only one peculiar case (in italic in Tab. 5) where we had to explicitly mask the spectra near the band edges, before performing the polynomial fit. Without this masking the fit was poor and the polynomial fit was significantly overestimating the continuum.
In od 326 Herschel suffered a general telescope mispointing, due to the use of a wrong SIAM. The only observation we have in this OD is for NGC 7027 (obsid 1342193812) and the derived pointing offset of . This is in excellent agreement with the known offset of the SIAM on od 326 (), giving another good consistency check of the method.
3.6 Illustration of the pointing correction
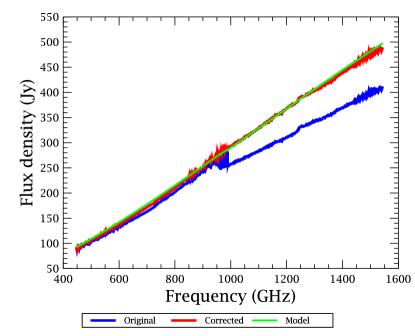
To illustrate how the results of this study can be used to correct spectra for pointing offsets, and consequently to improve the FTS calibration, we selected one Uranus observation, obsid 1342246974 from od 1125 – one of the most deviating ones, with a derived pointing offset of 4.2′′. Fig. 6 shows the original spectra from the central detectors SSWC3 and SSWD4 (in blue) and the corrected spectra, assuming a pointing offset of 4.2′′(in red). While the correction for the SLW spectrum is less than 5%, we see a dramatic change in the continuum level of SSW, which improves significantly the spectral shape and the stitching of the two FTS bands. The corrected spectrum is also much closer to the model prediction (shown in green), which gives a good consistency check for the method. This example shows the potential of the method for improvements of the spectra of calibration targets and the overall calibration.
The illustration shown in Fig. 6 gives an interesting idea that, even in the case of not knowing the pointing of a given observation of a point-source, the difference between SSW and SLW in the overlap region could be used as a crude guess on the pointing offset. Of course this can only be done for point sources with high signal-to-noise, because this overlap region is the noisiest part of the FTS spectra. Nevertheless, this simple alternative way of correcting the effect of pointing is worth considering as it could be applied to science observations which do not have a well pointed reference observation for comparison.
4 Conclusions and further prospects
The method presented in this paper provides means to derive the relative pointing offsets for FTS data, with respect to a reference observation. It is important to note that with this method we cannot retrieve the actual pointing, but only the offset relative to a selected observation. The greater the number of observations of a particular calibration target the higher the chances there will be an observation or observations in which the target will be well centred in the beam.
Our conclusions are mainly focused on the results for Uranus, as this planet is used as the primary FTS calibrator. The results on the other calibration targets are also valuable and can be used in a number of studies that may improve our understanding of the accuracy and the repeatability of the line and continuum measurements.
The derived relative pointing offsets for Uranus unequivocally indicate that during obsid 1342257307 from od 1313, our reference observation, the planet was very close to the centre of the SSW beam. This was also confirmed by the low resolution spectral map of Uranus taken directly after the sparse observation, with inferred position of of Uranus with respect to the expected position. This is the uncertainty in the transition from relative to absolute pointing offsets for Uranus. In addition, we presented a number of consistency checks in support of the method and we are confident that the reported pointing offsets are correct, within the uncertainties introduced by the telescope jitter and the planets models.
Although obsid 1342257307 from od 1313 is better centred in the beam and no pointing correction is needed, it is significantly shallower, with only 4 repetitions, in comparison with the current observations used for the HR mode point-source calibration: obsid 1342197472 from od 383 and obsid 1342246285 from od 1112, both with 22 repetitions. Hence, it is not advisable to use it for the point source conversion because of the lower signal to noise in the Uranus spectrum.
We confirm the pointing offsets of the deep Uranus observations from od 1112 used in the current flux calibration scheme. We note that the flux calibration used up to HIPE v10, for all observations, was based on the deep observation obsid 1342197472 from od 383. Our results clearly indicated that Uranus was very close to the beam centre, at a sub-arcsec offset, during this observation. This means the current FTS point-source flux calibration, used for observations taken before the BSM change (or for all observation before HIPE v10), is of a similar accuracy to the calibration now adopted for observations after the BSM change, which uses an observation corrected for pointing.
The results we provide for Uranus observations on a number of off-axis detectors indicate up to 6-7′′pointing offsets. These were not taken into account in the current (SPIRE_CAL_11_0) flux calibration, which means that there is a large overestimation of the conversion factors. Therefore, the interpretation of point-source calibrated data from the off-axis detectors or from spectral maps must be carefully reconsidered for a possible flux loss. The results from this study will be incorporated in the next update of the FTS calibration.
Having the correct pointing offsets makes it possible to combine all available observations of a given calibration target, because we can effectively correct each one for the pointing. This procedure will decrease the overall noise in the spectrum, however, one has to be careful because the systematic noise properties of observations at different off-axis positions will be different. Nevertheless we envisage to apply this idea to the upcoming calibration of the FTS and evaluate the pros and cons with respect to the current calibration scheme.
The improvements in the FTS calibration, incorporating the results from this study, are part of the on-going work of the FTS team.
Acknowledgments
SPIRE has been developed by a consortium of institutes led by Cardiff University (UK) and including Univ. Lethbridge (Canada); NAOC (China); CEA, LAM (France); IFSI, Univ. Padua (Italy); IAC (Spain); Stockholm Observatory (Sweden); Imperial College London, RAL, UCL-MSSL, UKATC, Univ. Sussex (UK); and Caltech, JPL, NHSC, Univ. Colorado (USA). This development has been supported by national funding agencies: CSA (Canada); NAOC (China); CEA, CNES, CNRS (France); ASI (Italy); MCINN (Spain); SNSB (Sweden); STFC (UK); and NASA (USA).
References
- Griffin et al. (2010) Griffin M.J., Abergel A., Abreu A., et al., 2010, A&A, 518, L3
- Makiwa et al. (2013) Makiwa G., Naylor D., Ferlet M., et al., Applied Optics, 52, 16, 20132013
- Moreno (1998) Moreno R., 1998, PhD thesis, Université de Paris VI
- Müller & Lagerros (2002) Müller Th. & Lagerros J.S.V, 2002, A&A, 381, 324
- Orton et al. (2013) Orton G.S., Fletcher L.N., Moses J.I., et al., 2013, Icarus, submitted
- Ott et al. (2010) Ott S., in ASP Conference Series Vol. 434 (ADASS XVIII), 139
- Pilbratt et al. (2010) Pilbratt G.L., Riedinger J.R., Passvogel T., et al., 2010, A&A, 518, L1
- Sánchez-Portal et al. (2013) Sánchez-Portal M. et al., 2013, this issue
- Swinyard et al. (2010) Swinyard B.M., Ade P., Baluteau J.-P. et al., 2010, A&A, 518, L4
- Swinyard et al. (2013) Swinyard B., Polehampton E., Hopwood R. et al., 2013, in preparation