Collapse of quasi two dimensional wet granular columns
Abstract
This paper deals with the experimental characterization of the collapse of wet granular columns in the pendular state, with the purpose of collecting data on triggering and jamming phenomena in wet granular media. The final deposit shape and the runout dynamics were studied for samples of glass beads, varying particle diameter, liquid surface tension and liquid amount. We show how the runout distance decreases with increasing water amount (reaching a plateaux for ) and increases with increasing Bond number, while the top and toe angles, and the final deposit height increase with increasing water amount and decrease with decreasing Bond number. Dimensional analysis allowed to discuss possible scalings for the runout length and the top and toe angles: a satisfying scaling was found, based on the combination of Bond number and liquid amount.
pacs:
47.57.Gc,45.70.Ht,83.80.FgI Introduction
Triggering and jamming mechanisms are an important research subject for many fields of science, since they contain theoretical and practical implications. In the granular materials research field, jamming and triggering prediction is a key aspect for the control of industrial processes (storage, handling and transport) as well as for the understanding of natural phenomena (landslides, rock avalanches). Recent research has been carried out on the collapse of granular columns, an unsteady reference problem which involves both triggering and jamming of the flow. The typical experiment is very simple: An axisymmetric Lube et al. (2004); Lajeunesse et al. (2004) or rectangular Lube et al. (2005); Siavoshi and Kudrolli (2005); Lajeunesse et al. (2005); Balmforth and Kerswell (2005) column is allowed to collapse by lifting, respectively, the containing cylinder or a containing wall. The material collapses generally evolving to a pile with a typical inclination slightly lower than the angle of repose. In the cited works, the position of the avalanche which follows the triggering of the motion was usually registered in time to reconstruct collapse dynamics; the final runout distance and heap height were also estimated in order to develop scaling laws for the final deposit. In the various works available in the literature, the effect of the initial aspect ratio, the size and shape of the grains, and the roughness of the bottom surface were evaluated for the case of dry granular materials. For this case, discrete element simulations were also performed with different approaches (classical molecular dynamics or contact dynamics methods) generally confirming the experimental results Zenit (2005); STARON and HINCH (2005), and evaluating the effect of particle parameters such as interparticle friction and restitution coefficients Staron and Hinch (2007). Various models have also been proposed to explain the obtained experimental data Mangeney-Castelnau et al. (2005); Kerswell (2005); Larrieu et al. (2006); Doyle et al. (2007). All the cited works were concerned with dry cohesionless materials; more recently, Meriaux and Triantafillou Meriaux and Triantafillou (2008) have extended the research to the case of dry cohesive powders, by means of experiments on rectangular column collapse.
In this work we push forward the research on granular column collapse by analyzing the behavior of wet granular materials. Wet granular materials are very interesting because the presence of water in the granular medium greatly affects phenomena even in very small amounts Hornbaker et al. (1997). This research represents a first attempt in the investigation of the effect of small quantities of fluid on triggering and jamming.
Different amounts of liquids with different surface tension values were mixed within samples of glass beads of different size ( = 2, 3, and 5 mm) focusing on low degrees of saturation (pendular state). Such wet materials were first poured in a rectangular box and then allowed to flow by removing a lateral wall. The dependence of the kinematics and the final state of the system on grain size and water content was particularly investigated.
II Materials and Methods
II.1 Experimental set-up
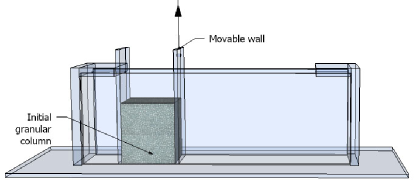
Experiments of granular column collapse were performed in a rectangular channel as displayed in Figure 1. The channel was made of transparent glass plates, lateral walls being 35 cm long, 12 cm high, with a gap of 5 cm between them. A 5 x 15 cm glass plate was used as the removable confining wall for the experiment.
As the focus of the present work was to understand the effect of wetting on collapse dynamics, and mainly to investigate different water amounts and particle diameters, the influence of the initial aspect ratio of the column (which was studied, for the dry case, in a number of experimental and numerical works) was not addressed. The initial dimension of the column was therefore kept fixed to length =7 cm, height =8 cm and thickness = 5 cm for all the experiments. The sample was first prepared by slowly adding a certain amount of liquid to the material in a separate vessel; the sample was then manually mixed for a time long enough to ensure homogeneity of liquid bonds. The degree of homogeneity was assessed by means of tomographic measurements, as detailed in the following section. The material was then poured in the experimental box with a funnel. The effective amount of liquid in the material was quantified by weighing the dry, empty preparing container and the container after having poured the spheres into the column. It was important to quantify precisely the amount of water in the sample since the water involved was a very scarce quantity (2 - 17 mL in our tests). The experiment was performed by lifting the moving wall by dropping a sufficiently large weight with a weight-and-pulley system, allowing the column to collapse freely under the action of gravity. Analysing the recorded movies, it was verified that the lifting was perfectly reproducible, with a lifting time of approximately 0.1 seconds.
Glass spheres ( 2532 ) in three particle sizes ( 2, 3 and 5 mm) were used for the experiments.
Two different liquids were tested: distilled water and a solution of water with a fluorinated surfactant (1-perfluorotooctyl-3-propan-2-ol) with a concentration of 0.5 g/l, which had the effect of lowering the surface tension of water. Surface tension was measured using a KRUSS K6 tensiometer. Tests with surfactant will be denoted with a ‘T’ in the following. For each test, 5 repetitions were made. Contact angle measurements of the two fluids on the particles were performed by taking microscopical photos of little drops on a flat glass surface cleaned with ethanol. Measured parameters are reported in Table 1. It can be noticed that while lowering the surface tension, the surfactant worsens the wetting properties of the solution, inducing an increase of the contact angle.
| Distilled water | Water + surfactant | ||
| mN/m | 72.75 | 17.10 | |
| o | 15 | 40 |
Regarding the amount of liquid, different weights were tested 0 (dry), 0.5, 1, 2, 4 %, expressed in percentages of the solid weight. Such values correspond to a low degree of saturation and belong to the so-called pendular state Newitt and Conway-Jones (1958), where simple liquid bridges between pairs of particles tend to form within the material.
II.2 Measurement techniques
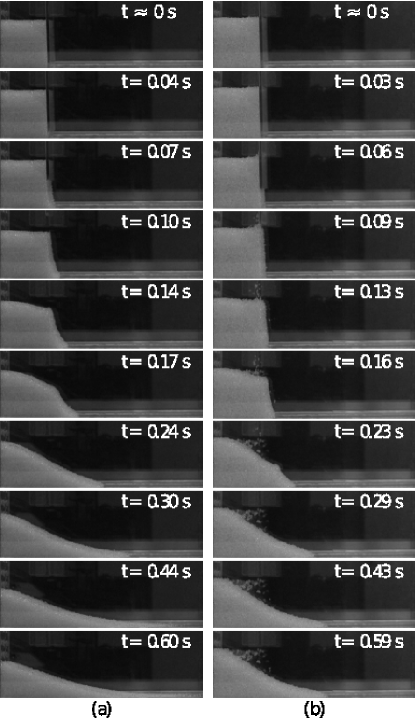
During each experiment, the evolution of the system was tracked by taking pictures at fixed time intervals using a CCD camera. In particular, a high resolution semi-professional CCD camera was used (CASIO EX-F1), which was operated at 30 fps, with an exposure time of 1/400 s and a resolution of 2816x2112 pixels. The analysis of the image sequence allowed to track the evolution of the granular mass during time, measuring run-out length, height of the pile, and the angles of the slope at every time-step. Two examples of the column collapse as recorded in the experiments are reported in Figure 2. The acquisition and the lifting of the wall were not automatically synchronized in the tests. In order to analyze the time evolution of the different tests the frame acquisition and the start of the experiments had to be synchronized by determining the zero reference time. As was already stated, an analysis of the moving wall kinematics highlighted that the movement of the wall was fairly reproducible: The friction with the material being nearly negligible, the wall was lifted with a constant acceleration equal to gravity. For each test the wall position in the first 4-5 frames was fitted to a parabolic equation in order to obtain the zero reference time, which was identified with the time when the wall started to move upwards. The image sequences were then processed in order to obtain descriptive parameters as detailed in the following sections. The frames captured at the very beginning of the collapse allowed to appreciate that the wall lifting was fast enough in order to have no strong effects on the dynamics of the column. Due to the presence of capillary bridges, in wet tests some groups of particles were dragged updwards by the moving wall or remained stick at the lateral walls; this was a phenomenon which could not be avoided but seemed not to have global effects on the collapse.
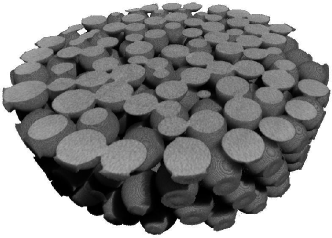
Since the behavior of the material depends critically on the number of liquid bridges, it was considered as an important issue to characterize the effect of the preparation procedure on the initial state of the system. In particular it was needed to gain some knowledge on the degree of uniformity of liquid distribution, and on the number of contacts supporting a liquid bridge. In order to address this problem, some experiments were performed using an X-ray microtomography scanner (Skyscan 1172). In these tests, first a certain amount of wet material with was prepared by manually mixing 200 g of 2 mm glass spheres with a 9 % solution of KI (potassium iodide) in distilled water. KI was chosen for its X-ray contrasting properties; the surface tension of the solution used was only slightly higher (less than 1 mN/m) than that of pure water. The effect of KI on capillary forces was therefore considered as negligeable. A small portion ( 20 g) of the material was then poured in a cylindrical sample holder, which was then introduced in the tomographical apparatus and scanned. Care was taken in order to standardize the mixing procedure; it was however found that a relatively short manual stirring ( 30 s) ensured a proper distribution of the liquid. As a matter of fact, a semiquantitative study was performed on the tomographic images (a reconstruction example is reported in Figure 3), analyzing three different groups of adjacent slices (located respectively near the top, in the middle, and near the bottom of the sample) in order to evaluate the liquid bridge distribution. For each group of slices (where 80 particles were present), the contact network was analyzed particle by particle, and it was found that only 4% of the contacts did not support a liquid bridge; many bridges were formed between non contacting particles, and only three triple funicular bridges were found in the whole sample. This analysis was devoted only to understand the efficiency of mixing and allowed to verify that the procedure of manual mixing adopted resulted in a sufficiently homogeneous wet contact network. Further details like the effect of the grain size and liquid properties on the final liquid distribution were not investigated in this work and should be included in further studies.
III Results
As was evident from Fig. 2, the presence of a small amount of liquid between the particles strongly affected both the final shape of the deposit and the collapse dynamics. As the typical situations present in the figure show (2 mm glass spheres without liquid and with distilled water at 1 %), the wet material appeared generally to have a longer “induction” time, as well as a shorter dynamic phase. Moreover, the deposit had a shorter runout in the wet case, as well as an higher final maximal height. All the tests were quantitatively analyzed by means of descriptive parameters concerning the final deposit shape and runout dynamics as functions of particle size, fluid amount and surface tension, and the results are presented in the following.
III.1 Effect of particle size, fluid amount and surface tension on the final deposit
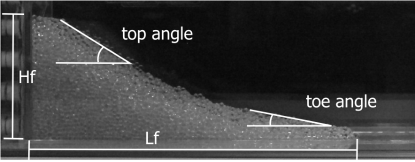
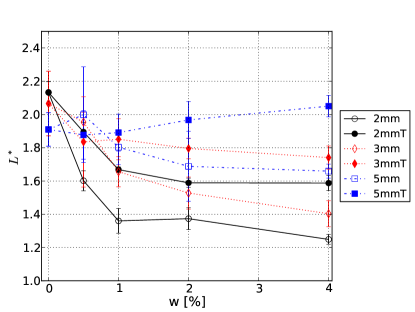
In this section the influence of a wetting fluid on the final configuration attained by the material after run-out is discussed. A typical example of the final deposit shape is given in Fig. 4: Notably one can identify a surface slope with two different inclination angles, a higher one near the top () and a lower one at the end of the deposit (in the following referred to as “toe angle”, ). The geometry of the final deposit can be also characterised by its vertical and horizontal extent, namely and . In the following the dependence of these parameters on the different variables explored will be discussed. Coherently with the previous literature, lengths are rescaled and non-dimensionalized by studying and , with and being the initial height and length of the column.
In previous literature Lube et al. (2005), in dry conditions the deposit shape was found not to depend on particle size. The data presented in Fig. 5-8 partially confirm this experience: There are few differences in the parameters quantifying the final deposit geometry between the dry tests (%). As is evident in the following, the presence of capillary forces induced by small amounts of liquids contributes to break the scale invariance, with different behaviours for different particle diameters.
Analyzing the rescaled run-out length, , reported in Figure 5, one can notice a separation of behaviours. For all the tests, with the exception of 5 mm particles wetted with the water plus surfactant solution, decreases when increasing the amount of fluid, with a plateaux after ; moreover, is longer for low surface tension liquid and for larger particles. This results can be explained by the fact that the balance between body and capillary forces at particle scale is affected by both particle diameter and surface tension of the liquid. Qualitatively (a quantitative discussion will be given in a dedicated section in the following), for larger particles body forces prevail, and the liquid has a lower influence on the statics and dynamics of the granular material; decreasing surface tension of the liquid has the same effect of increasing particle size. For the 5 mm particles wetted with water plus surfactant, is nearly independent of below and has a value equal to the dry case. A slight increase in runout length is found for higher water contents, suggesting that probably lubrication effects come into play. The presence of a viscous fluid between particles offers a dynamic resistance which, in a dynamic situation, can increase the average interparticle distance, therefore reducing the number of contacts. This makes the capillary forces to be smaller, and reduces the frictional resistance of the material. Grosso modo, viscous forces increase for increasing viscosity, particle diameter (), and liquid bridge volume ( for ). In its turn, the capillary force is not a simple function of the particle diameter. For example, following Richefeu et al. Richefeu et al. (2008), for equal spheres the capillary force can be approximated by as , where is the particle radius, the gap, and a constant. Given that, depending on system preparation, the gap (and the liquid bridge volume itself) may depend on the particle radius, it is not possible to identify a general behavior. However, for sufficiently dense systems, where liquid bridges are located at the contact points, the force reduces to a linear increasing function of the particle diameter. The different scalings associated with the interparticle forces are in agreement with the experimental results which show a slight increase in runout length for the case with lowest surface tension and largest particle diameter. In order to evaluate more precisely eventual lubrication effects, other tests should be performed, particularly varying the viscosity Xu et al. (2007).
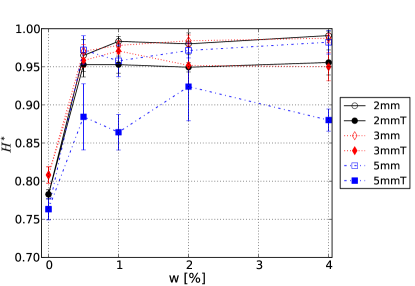
The next shape parameter to be analyzed is the rescaled pile height, . As shown in Figure 6, increases as a wetting liquid is added to the material, with little dependence on liquid amount. For nearly all wet cases the collapse event does not affect the maximum height of the pile, which remains approximately the same as before the event. The only exception is the case with mm and low surface tension solution, which shows intermediate values of .
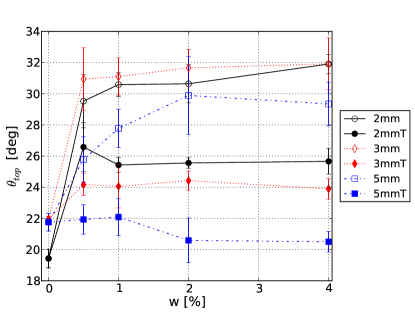
This saturation behavior can be explained by thinking in terms of repose angles. For simplicity, let’s suppose that the material after runout has a triangular shape, with height and length . Mass conservation implies that . It will be obviously that . If we suppose that the average slope is approximately equal to the angle of repose, which is a property of the system (depending on the material, the amount of water, and the type of liquid), we can conclude that there is a limiting value of the angle of repose above which . This limiting angle is ; in our case this corresponds to . In Figure 7 one can see how the top angle increases from 20 to 30 degrees when adding a liquid to 2mm spheres, allowing us to suggest that in wet conditions the angle of repose reaches, for the present aspect ratio, the critical value which determines .
Data for the “top angle” are displayed in Figure 7. Here one can clearly see a significant increase of the top angle of the heap when liquid is added to the material, though only a slight dependence is found on the liquid amount. A nice separation of behaviours is found depending on surface tension of the liquid, with the angles belonging to low surface tension tests being generally lower (with again the limit behavior of the mm with surfactant test, which has the lower values with negligible variations with respect to the dry case). This separation was present also in the heap height data.
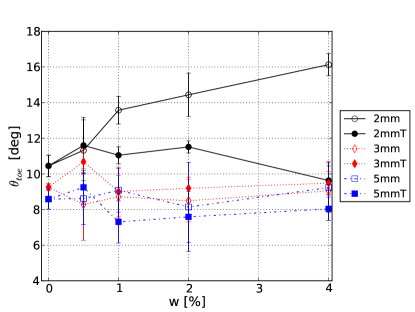
Regarding the “toe angle”, , as displayed in Figure 8, some clear information can be extracted from the data: a significant difference between the dry and wet case was not found, apart from the test with the lowest Bond number, that is, the test with mm and water as a liquid. For this case an increasing amount of liquid determines an increasing toe angle. For nearly all the tests the liquid seems not to affect the toe repose angle. This can be related to capillary bridge dynamics: It is at the toe where liquid bridges, if not too strong, break with higher frequency and therefore it can be reasonable that the heap slope at this point will resemble the dry case.
III.2 Effect of particle size, fluid amount and surface tension on the run-out dynamics
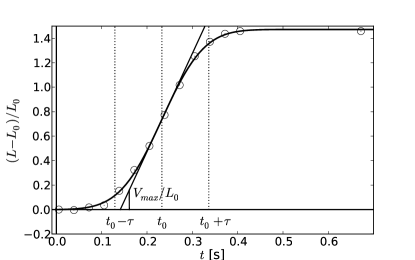
In this second part of the study, we analyze the run-out dynamics of the granular column and its dependence on particle size, amount of wetting fluid and surface tension. As described in the previous literature Lube et al. (2004, 2005), when tracking the distance made by the advancing front () along time, we can identify (i) a region of accelerated motion, (ii) a region of nearly constant velocity, and (iii) a decelerating period at the end of which the flow is stopped. In Refs. Lube et al. (2004, 2005) it was also shown that for aspect ratios (in this work ), the second region tends to disappear, the dynamics therefore consisting only of two (accelerating and decelerating) phases. An example of the dynamics recorded from the experiments is shown in Figure 9. In fact, for the present data, it was found that the run-out length behavior could be well described by a sigmoidal function with three parameters ,,:
| (1) |
where is the half-time, i.e. the time when , is the maximum velocity (occurring at ), is the time span, giving information on the broadness of the runout profile. The derivative of the curve is a gaussian curve centered in ; the velocity profile in time is therefore nearly symmetrical around . For each set-up, the function was fitted on the data giving estimated values for the parameters, and the 95 % confidence interval for the parameters was also estimated using Student’s t-test.
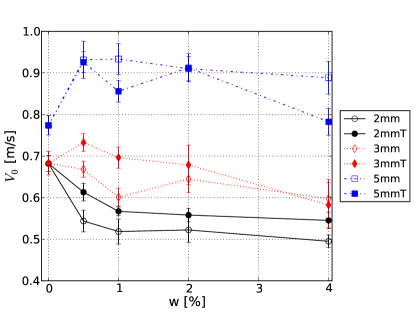
In Figure 10, values of the maximum attained velocity are reported for all the experimental conditions. At first it has to be noted that, in dry conditions, again a slight difference exists between tests with different particle diameters. As previous literature results suggest particle diameter invariance, this discrepancy may be explained by finite size effects: Given that the experimental set-up is not scaled with particle diameter, for coarser particles the ratio probably reaches a critical value such that sidewalls influence differently the dynamics. This has to be kept in mind also in the wet data analysis. When adding liquid, we see a somewhat complex behavior: for mm particles, is slightly increased with respect to the dry case, while it decreases for smaller particles. For and mm, velocities in low surface tension tests are slightly larger than the respective high surface tension ones.
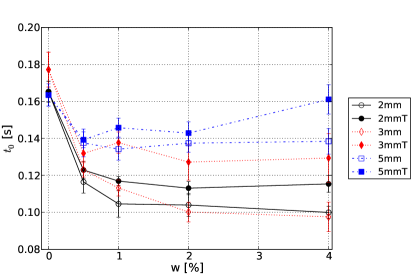
Fitted values of runout half-time are displayed in Figure 11. At first, it is evident that adding liquid decreases, reaching a plateau for %. The collapse event therefore reaches its half-life more rapidly in wet conditions than in dry ones. This is clearly related to the smaller runout length observed for wet conditions. Generally, low surface tension tests have a longer half-time than their corresponding high surface tension ones.
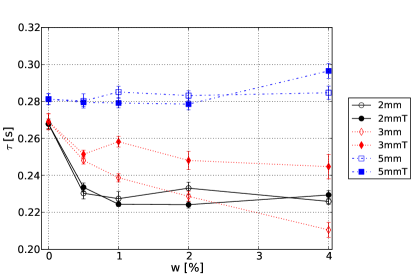
As regards the time span of the collapse, , which results are collected in Figure 12, there is again a clear distinction between small and coarse particles. For 5 mm particles seems not to be affected by the presence of liquid nor by its surface tension, while smaller particles show a large dependence on water content and, for the 3 mm case, on liquid surface tension. Analysis of the dynamics therefore suggests that some clear patterns exist, which are however complicated by the various phenomena involved (friction, capillarity, finite size effects, eventually lubrication of contacts, etc.).
IV Discussion
Results presented in the previous section highlighted an important feature of wet granular media: While in dry conditions the collapse phenomenon seems to be independent of particle size, the addition of a wetting fluid breaks this invariance inducing a dependence on particle diameter and surface tension. Moreover, a dependence on liquid amount was found for .
The emergence of a dependence on particle size is obviously related to the effect of particle size on capillary forces. Dimensional analysis can help in understanding and comparing the importance of the phenomena involved in the experiments. The simplest dimensional number can be constructed by comparing capillary and body forces. This is the Bond number, which is defined as:
| (2) |
In the experimental campaign, two parameters forming Bond number were varied independently: particle diameter and liquid surface tension . If Bond number was sufficient for scaling, we would find that lowering the surface tension by a factor of 4 would be equal to doubling the particle diameter. That is, 2 mm particles wetted with the low surface tension liquid should behave nearly the same as 5 mm particles for the larger : that is not too far from what was found for , and . However, as discussed in previous sections, particularly for a dependence of the system behavior on water amount was clearly highlighted. Therefore Bond number alone cannot explain properly the experimental results, since it does not contain information on the liquid content. Bond number simply compares body and capillary forces on two particles in contact (for which the capillary force does not depend on bridge volume). Detailed empirical or analytical models of particle-particle interactions could be adopted to introduce the effect of on the strength of a capillary bridge, with the purpose of constructing a more refined dimensionless number. For example Lambert et al. (2008) provide a theoretical formulation of the capillary force as function of the capillary volume and gap based on the minimum energy approach. Other empirical and semi-empirical relations can be found in Willett et al. (2000) and Richefeu et al. (2008). For a fixed liquid content and assuming a homogeneous distribution a mean capillary volume can be obtained.
However since runout dynamics is rather complex (multiple bridges exist for each particle, not all the contacts in principle support a bridge, etc.), simplifying assumptions should be adopted in order to adapt the single contact models to real experimental conditions. In particular, assumptions on the coordination number, on the average distance between particles and on the distribution of bridge volumes should be done. To avoid the complications related to such a detailed approach, and with the aim of finding scaling laws as simple as possible, we prefer to look for a combination of dimensionless numbers as a scaling parameter.
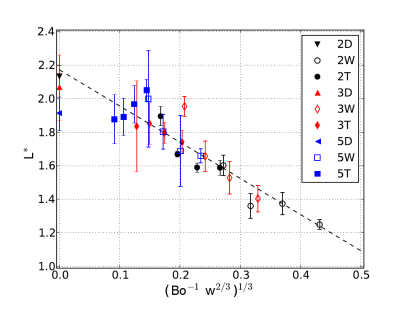
In particular, focusing on the runout length, as reported in Figure 13, it was found that raw data can be progressively reduced to a master curve when plotted against . The master curve expression is . 5 mm spheres wetted with the low liquid surface tension fall on the same curve but do not scale correctly on water content, supporting the hypothesis that some additional effect has to be considered (for example, lubrication). A nice result is that also data from dry tests do not fall too far from the curve.
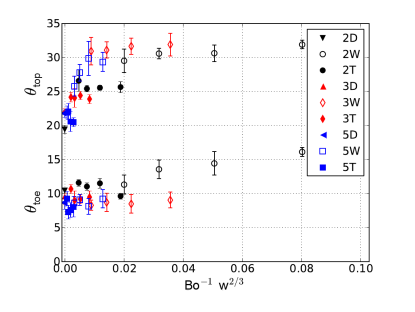
As reported in Figure 14, also the top and toe angles are described by the scaling parameter . In particular, the scaling resumes quite well how these angles depend on particle diameter, surface tension and liquid amount. The 2/3 exponent on is clearly related to the “surface” nature of the capillary interactions, which suggests that the behavior will scale more likely with the wet area of contact, which is proportional to , than with the liquid bridge volume, which is proportional to .
Another parameter which it would be useful to characterize with dimensional analysis is the maximum velocity of the collapsing event, . Various permutations of variables forming dimensionless numbers with were tested. Some examples are the particle scale Froude number , the flow scale Froude number, e.g. , or more complex numbers taking into account particle-geometry interactions, like, e.g. . Unfortunately a satisfying scaling was not found, and more data should be collected, particularly for different aspect ratios of the initial column. As already suggested, the difficulty in finding a general behavior may come from finite size effects. To overcome this issues, axisymmetrical collapse experiments should be performed, as it was done for the dry column collapse Lube et al. (2004); Lajeunesse et al. (2004).
V Conclusions
The focus of this work was the experimental characterization of the collapse of wet granular columns in the pendular state. The final deposit shape and the runout dynamics were studied for samples of glass beads, varying particle diameter, liquid surface tension and liquid amount. Data generally showed that the runout length decreases with increasing water amount (reaching a plateaux for ) and increases with increasing Bond number, while the top and toe angles, and the final deposit height increase with increasing water amount and decrease with decreasing Bond number. Some differences were always observed for the largest Bond number case, where probably lubrication effects take place. Probable size effects were highlighted regarding the runout maximum velocity.
Dimensional analysis allowed to discuss possible scalings for the runout length and the top and toe angles: A satisfying scaling was found, based on the dimensionless group .
This work aims to be a first step in the understanding of the effect of capillary bridges on the mechanics of dense granular flows, and particularly on the collapse dynamics. The data presented in this work can be used as a reference for further studies, in order to develop refined scaling laws; on the other hand, it can be useful to compare collapse data to numerical simulations of wet granular collapse in order to validate micromechanical models of capillary bridge dynamics.
Acknowledgements.
The authors gratefully acknowledge the Surfaces and Interfaces Physics Laboratory Group of the University of Padova and particularly Giorgio Delfitto, Davide Ferraro and Tamara Toth for the contact angle measurements, and for the helpful discussions on surface wettability.References
- Lube et al. (2004) G. Lube, H. E. Huppert, Sparks, and M. A. Hallworth, Journal of Fluid Mechanics 508, 175 (2004).
- Lajeunesse et al. (2004) E. Lajeunesse, Mangeney-Castelnau, and J. A., Vilotte, Physics of Fluids 16, 2371 (2004).
- Lube et al. (2005) G. Lube, H. Huppert, R. Sparks, and A. Freundt, Physical Review E - Statistical, Nonlinear, and Soft Matter Physics 72, 1 (2005).
- Siavoshi and Kudrolli (2005) S. Siavoshi and A. Kudrolli, Physical Review E - Statistical, Nonlinear, and Soft Matter Physics 71, 1 (2005).
- Lajeunesse et al. (2005) E. Lajeunesse, J. Monnier, and G. Homsy, Physics of Fluids 17 (2005).
- Balmforth and Kerswell (2005) N. Balmforth and R. Kerswell, Journal of Fluid Mechanics 538, 399 (2005).
- Zenit (2005) R. Zenit, Physics of Fluids 17, 031703 (2005).
- STARON and HINCH (2005) L. Staron and E. J. Hinch, Journal of Fluid Mechanics 545, 1 (2005).
- Staron and Hinch (2007) L. Staron and E. Hinch, Granular Matter 9, 205 (2007).
- Mangeney-Castelnau et al. (2005) A. Mangeney-Castelnau, F. Bouchut, J. Vilotte, E. Lajeunesse, A. Aubertin, and M. Pirulli, Journal of Geophysical Research B: Solid Earth 110, 1 (2005).
- Kerswell (2005) R. Kerswell, Physics of Fluids 17, 1 (2005).
- Larrieu et al. (2006) E. Larrieu, L. Staron, and E. Hinch, Journal of Fluid Mechanics 554, 259 (2006).
- Doyle et al. (2007) E. Doyle, H. Huppert, G. Lube, H. Mader, and R. Sparks, Physics of Fluids 19 (2007).
- Meriaux and Triantafillou (2008) C. Meriaux and T. Triantafillou, Physics of Fluids 20 (2008).
- Hornbaker et al. (1997) D. J. Hornbaker, R. Albert, I. Albert, A.-L. Barabasi, and P. Schiffer, Nature 387, 765 (1997).
- Newitt and Conway-Jones (1958) D. M. Newitt and J. M. Conway-Jones, Trans. Inst. Chem. Eng. 36, 422 (1958).
- Richefeu et al. (2008) V. Richefeu, M. S. El Youssoufi, R. Peyroux, and F. Radjaï, International Journal for Numerical and Analytical Methods in Geomechanics 32, 1365 (2008), ISSN 1096-9853.
- Xu et al. (2007) Q. Xu, A. V. Orpe and A. Kudrolli, Physical Review E - Statistical, Nonlinear, and Soft Matter Physics 76, 031302 (2007).
- Lambert et al. (2008) P. Lambert, A. Chau, A. Delchambre, and S. Regnier, Langmuir 24, 3157 (2008).
- Willett et al. (2000) C. D. Willett, M. J. Adams, S. A. Johnson, and J. P. K. Seville, Langmuir 16, 9396 (2000).