Molecular Dynamics Simulations of the Nucleation of Water: Determining the Sticking Probability and Formation Energy of a Cluster
Abstract
We performed molecular dynamics (MD) simulations of the nucleation of water vapor in order to test nucleation theories. Simulations were performed for a wide range of supersaturation ratios (-) and water temperatures (- K). We obtained the nucleation rates and the formation free energies of a subcritical cluster from the cluster size distribution. The classical nucleation theory (CNT) and the modified classical nucleation theory (MCNT) overestimate the nucleation rates in all cases. The semi-phenomenological (SP) model, which corrects the MCNT prediction using the second virial coefficient of a vapor, reproduces the formation free energy of a cluster with the size to within 10 % and the nucleation rate and cluster size distributions to within one order of magnitude. The sticking probability of the vapor molecules to the clusters was also determined from the growth rates of the clusters. The sticking probability rapidly increases with the supersaturation ratio , which is similar to the Lennard-Jones system.
I INTRODUCTION
The classical nucleation theory (CNT) is the most widely used model for describing homogeneous nucleation and provides the nucleation rate as a function of the supersaturation ratio and the surface tension of a condensed phasevolmer ; beck ; zeld ; feder . However, many studies have reported that the CNT fails to describe experimentally obtained resultsschmitt1 ; schmitt2 ; miller ; adams ; dill ; oxtoby ; delale ; viisanen1993 ; wright ; laaksonen ; viisanen1994 ; kane ; kaarle ; luijten ; anisimov2001 ; wolk ; mikheev ; khan ; kim ; holten ; brus2008 ; brus2009 ; manka . In the case of water, the deviations between the nucleation rates predicted by the classical nucleation theory and the experimental values are in the order of -viisanen1993 ; miller ; luijten ; wolk ; mikheev ; khan ; kim ; holten ; brus2008 ; brus2009 ; manka . The nucleation rates obtained by molecular dynamics (MD) and Monte Carlo (MC) simulations also significantly differ from the predictions of the CNTford1997 ; kusaka1998 ; ym1 ; ym2 ; wolde1998 ; kusaka1999 ; oh1999 ; senger ; wolde1999 ; laasonen ; oh2000 ; tanimura ; vehkam ; chen2001 ; schaaf ; yoo ; toxvaerd ; toxvaerd2 ; tanaka2005 ; matsubara2007 ; tanaka2011 ; diemand2013 . The nucleation rate is governed by the formation free energy of a critical cluster, which is the smallest thermodynamically stable cluster. In the classical nucleation theory, the formation free energy is simply evaluated using the surface energy of the bulk material. Since the critical clusters are considered to be nano-sized, the error in the classical theory is thought to come from the difference in the properties of such a small cluster and a bulk material.
In previous studies, there have been significant advances in theoretical models of homogeneous nucleationdill ; oxtoby ; laaksonen ; delale ; laasonen ; reguera ; reguera-reiss ; kalikmanov2006 ; wedekind2007 ; merikanto2007 ; kalikmanov2008 . One of the most successful and useful models is the semi-phenomenological (SP) modeldill ; delale ; laaksonen , which corrects the evaluation of the formation energy of a cluster in the CNT by using the second virial coefficient of a vapor. The predictions of the SP model agree well with experimental data for various substances including waterdill ; delale ; laaksonen . By performing MD simulations of nucleation for Lennard-Jones systems, Tanaka et al.tanaka2005 ; tanaka2011 tested the SP model and found that it also agrees well with their MD simulations. However, only large supersaturation ratios were possible in their MD simulations. Recent large scale simulations by Diemand et al.diemand2013 found some deviations in the nucleation rate from the SP model in the case of a small supersaturation ratio.
Besides Lennard-Jones systems, many other MD simulations examining the nucleation process of water molecules have been carried out. Yasuoka and Matsumotoym2 investigated homogeneous nucleation for the first time using MD simulations of water molecules. The nucleation rate they obtained at 350 K was two orders of magnitude less than that predicted by the classical theory. Matsubara et al.matsubara2007 carried out MD simulations at various temperatures and supersaturation ratios, using a simple point charge/extended (SPC/E) water modelberendsen . They measured the nucleation rate, the critical nucleus size, and the formation free energy of a cluster and compared them with the various theoretical models. They showed that all theoretical models (CNT, SP model, and the scaled model) predict the nucleation rates obtained by the simulations to within one or two orders of magnitude. On the other hand, the formation free energy of a cluster derived by the simulations was considerably larger than that obtained with the theoretical models. They showed that the deviations in the formation free energy can be explained by the larger growth rate of clusters than that assumed by the theories. Recently, Zipoli et al.zipoli developed a new coarse-grained model for water to study nucleation from the vapor and obtained smaller nucleation rates than the previous studies.
In addition to the formation free energy of a cluster, the sticking probability of vapor molecules to clusters is another important factor for determining the nucleation rate. The sticking probability is usually assumed to be unity, despite the fact that the nucleation rate is proportional to in the nucleation theory. In the previous studiestanaka2011 ; diemand2013 , the sticking probability in a Lennard-Jones type system was examined through MD simulations, by observing the growth rate of stable clusters larger than the critical size. They showed that the sticking probability decreases with decreasing supersaturation ratio; however, the validity of their findings has not been confirmed. Therefore, it is worthwhile investigating the sticking probability for various materials.
In the present study, we performed MD simulations of water molecules
for a wide range of initial supersaturation ratios and temperatures.
We observed the nucleation rates and derived the formation free energy
by using the size distribution of the clusters. By comparing these
numerical results with theories, we can test the theoretical models.
We also obtained the sticking probability from the MD simulations
based on the previous methodtanaka2011 ; diemand2013 . In Section
II, we describe the numerical procedure for our MD simulations, and in
Section III we present our numerical results and compare the numerical
results with the theories. We also determine the sticking probability
and the dependence of the supersaturation ratio. In Section IV, we
summarize the results of the present study.
II NUMERICAL PROCEDURE AND ANALYSIS
We performed simulations of the nucleation process in systems of 4,000 of water molecules, using the SPC/E rigid water modelberendsen . We assumed (constant volume and temperature) ensembles and used a three-dimensional periodic boundary condition. Initially, the molecules are located randomly without being overlapped with others and the system is relaxed to be in the equilibrium state at 1000 K. Using this initial condition, we started the simulations. In our simulations, the number of water molecules was not so large. In order to improve the statistical accuracy, we performed 20 runs with different initial positions and velocities of molecules for each parameters of temperature and initial supersaturation ratio . The time step was set as 2.0 fs. The total number of time steps was - in each run. The simulation box contained 4000 water molecules and 4000 (or 8000) argon carrier gas molecules to control the temperature. To compute the long-range electrostatic interactions, we adopted the reaction field-zero methodschulz2009 in which a dielectric constant of infinity and a group-based cutoff are employed. In this study we set the cutoff radius to 3.5 nm.
The computational region is a cube with periodic boundaries. By varying the box size , we set the initial number density of molecules or the initial supersaturation ratio . The supersaturation ratio is defined as , where and are the partial pressure of the monomers and the pressure in a saturated vapor. The resulting supersaturation is approximately given by with the total pressure because of small amount of clusters larger than dimers. Simulations were performed for various temperatures and supersaturation ratios, i.e., -375 K and -25. The parameter sets for each run are shown in Table I. 28 parameter sets were chosen, so that the total number of simulations is 560. For a sufficiently high supersaturation ratio, the simulation gives a very large nucleation rate and the number of the vapor molecules decreases so quickly. In such a case, a steady nucleation with a constant supersaturation ratio is not realized. In our simulations, in order to observe steady nucleation, we chose lower supersaturation ratios compared with the previous studymatsubara2007 . For the interaction between carrier gas and water, we used the potential of the Lennard-Jones type:
| (1) |
where is the distance between argon and oxygen and the parameters and are given by and with , , kJ mol-1, and kJ mol-1 jorgensen . The carrier gas temperature was controlled directly with a Nosé-Hoover thermostat, while the temperature of the water was controlled indirectly through interaction with the carrier gas molecules. The temperature of the water molecules deviates from the temperature of the carrier gas because of the latent heat effect that results from condensation formation. We defined clusters using the bonding criterion that the interaction energy of a molecular pair is less than -10 kJ/molmatsubara2007 .
We obtained the nucleation rate and compared the number density of clusters based on the same method as in the previous studiestanaka2011 ; diemand2013 . We also derived the formation free energies from the cluster size distributiontanaka2014 . To derive the formation free energy of a cluster , where is the number of molecules in the cluster, we use the relation between the equilibrium size distribution and the formation free energy of a cluster tanaka2011 ; diemand2013 :
| (2) |
where is the number density of the monomers.
The steady nucleation rate is the net number of the transition from -mer to -mer and given by
| (3) |
where is the transition rate from a cluster of molecules, -mer, to (+1)-mer per unit time, i.e., the accretion rate, and is the transition rate from -mer to (-1)-mer per unit time, i.e., the evaporation rate of -mer. is given by
| (4) |
where is the thermal velocity, , and is the radius of a monomer, where is the mass of a molecule and is the bulk density. The evaporation rate is obtained from the principle of detailed balance in thermal equilibrium.
| (5) |
| (6) |
which leads to
| (7) |
Equation (7) shows agrees well with the number density of the clusters obtained by the MD simulations for subcritical clusters , because for . From Eq.(7), we obtain if and are given. For example is obtained by and . Also for a larger , we can obtain recursively. Matsubara et al.matsubara2007 calculated the equilibrium number density, using the different formula derived by Yasuoka and Matsumotoym1 from Fokker-Plank equation. Our formula leads to the same as Matsubara et al.matsubara2007 for (see Appendix).
In the theoretical models, the formulae for are given by
| (8) |
where , , and are the formation free energies of a cluster in the CNT,
the modified CNT (MCNT), and the SP model, respectively, and
and are parameters determined by the bulk surface energy and
second virial coefficienttanaka2011 ; diemand2013 .
In the classical theory, there is a theoretical inconsistency in the
dependence. Consequently the MCNT has often been used. In the next section,
we compare the CNT, MCNT and SP models with the our numerical results.
Although there are some differences between
the thermodynamic quantities
obtained by using SPC/E force and those by experiments of real water,
we should use those of SPC/E force for the
consistency to the model.
For thermodynamic quantities such
as the surface tension and the saturated vapor pressure of the SPC/E
water, we use the same data as Matsubara et al.matsubara2007
III RESULTS
III.1 A typical case
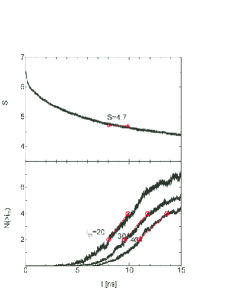
Let denote the number of clusters larger than a threshold size . Based on Yasuoka and Matsumoto methodym1 , we can obtain the nucleation rate from . Figure 1 shows time evolution of the supersaturation ratio and the number of clusters, , in a typical case where K and (run 5d in Table I). Note that is averaged over 20 runs with different initial positions and velocities of molecules. In Figure 1, we plot for 20, 30, and 40.
The threshold should be larger than the critical size for the evaluation of the nucleation rate. In this case, the critical size is estimated to be 14 (or 7) with the SP (or CNT) model. In this figure, the number of stable nuclei increases almost linearly in the period of ns. From the slope, the nucleation rate is measured with . In the evaluation of J, we chose the slope between the times at and 4, e.g., ns for =20. Then, the nucleation rate is obtained as , , and cm-3s-1, for , 30, and 40, respectively. In this evaluation of the nucleation rate, uncertainties of 20-30% exist, depending on the choice of and the time interval.
During this period of - ns, the average value of the
supersaturation and the temperature of the water molecules
were and K, respectively. Using these values,
we can calculate predicted by the theoretical models. In the
MCNT, the CNT and the SP models, the nucleation rate are obtained as
, , and cm-3s-1, respectively. The prediction of the SP
model is much closer to the values obtained in the MD simulations than
the MCNT and the CNT.
III.2 Nucleation rate
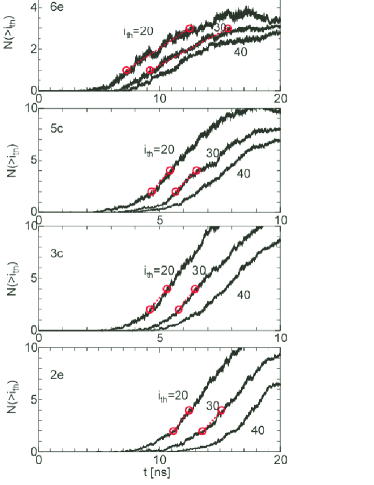
Fig. 2 shows the time evolutions of for 20, 30, and 40 in the various runs (6e, 5c, 3c and 2e). We evaluate the nucleation rates from the slopes between the times at and for all runs except run 6e. For run 6e, we use the slope between the times at and 3 because of the small number of clusters. The nucleation rates obtained in all MD simulations are listed in Table II, where we chose 20 for all runs because the size of critical cluster is estimated to be less than 20 for all runs (see Section III.D). As stated in the previous section, there are some uncertainties in the estimation of the nucleation rates. So we include the errors in the nucleation rates in Table II.
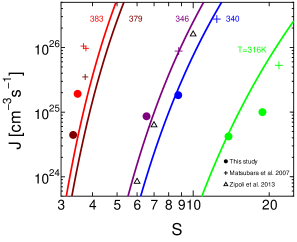
Fig. 3 shows the nucleation rates obtained by the MD simulations as a function of the supresaturation ratio for various temperatures. The previous results are also shown: crosses and triangles are the results by Matsubara et al.matsubara2007 and Zipoli et al.zipoli , respectively. The nucleation rates by SP model (solid curves) are also plotted. The obtained nucleation rates are about one-order-of-magnitude smaller than Matsubara et al.matsubara2007 because of the smaller supersaturation ratios. We find good agreements between the MD simulations and the SP model within one-order-of-magnitude in the cases of low temperatures for both our runs and the previous results.
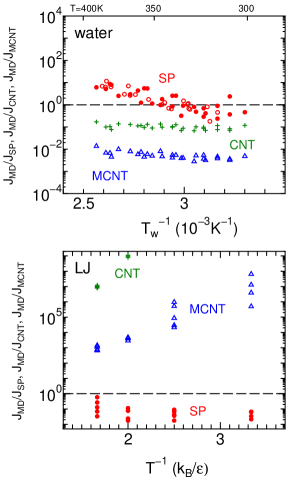
Figure 4 shows the ratios of the nucleation rates in the MD simulations (at ) to the rates obtained with the theoretical models. The results are plotted with circles for the SP model, triangles for the MCNT, and crosses for the CNT. The nucleation rates predicted by the SP model are within one order of magnitude of the MD simulations, whereas the nucleation rates predicted by the CNT and MCNT are much larger than the MD simulations. We also plotted the ratios , by using results by Matsubara et al.matsubara2007 (i.e., data in Table I in matsubara2007 ). Our results agree well with theirs. The ratio of gradually increases with temperature in both results. The nucleation rates obtained with the theoretical models are also listed in Table II.
In Figure 4, we also show the results of the Lennard-Jones systemtanaka2011 for reference. The SP model also predicts the nucleation rates to within one order of magnitude for the Lennard-Jones system, although the supersaturation ratios are limited to be small. In the case of the Lennard-Jones system, the CNT considerably underestimates the nucleation rates ( i.e., the ratio is much larger than ) at , where and are the depth of the Lennard-Jones potential and the Boltzmann constant, respectively. On the other hand, the CNT predictions agree with the nucleation rates obtained by the MD simulations to within two orders of magnitude in the case of water.
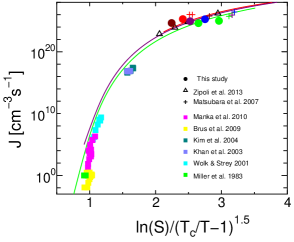
In Fig. 5, we show the nucleation rates as a function of
in order to compare our results with the
scaling relation proposed by Halehale . The data by the MD
simulations and the theoretical predictions are the same as those in
Fig. 3. For the MD simulations using SPC/E water model, we
set K for the consistency to the modelmatsubara2007 .
We also put the experimental data for water nucleation
miller ; wolk ; khan ; kim ; brus2009 ; manka .
For the experimental results and
Zipoli et al.zipoli , is set to be 647 Kwolk . From
Fig. 5, seems to be scaled by , but is not proportional to it.
III.3 Cluster size distributions
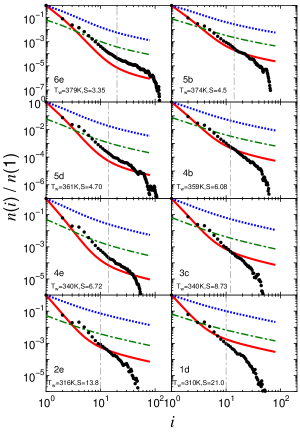
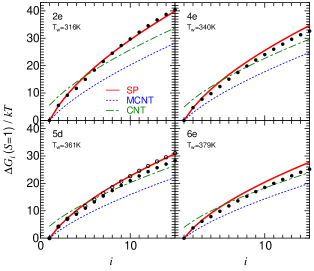
Figure 6 shows the size distributions obtained
from 8 runs at various temperatures and initial
supersaturation ratios. For each temperature, we show high- cases
(right column) and low- cases (left column). The MCNT
significantly overestimates the distributions (by factors ).
In all cases, the SP model predicts the size distributions more
accurately than both the MCNT and the CNT for clusters smaller than
the critical size. At the SP model agrees perfectly with the MD
simulations in all cases. However, the SP model disagrees with the
results of the MD simulations for large clusters. There is also a
relatively large deviation at . This is due to the stable
four-ring structuremerikanto2007 ; qian . These results for the size
distributions are consistent with the nucleation rate, as shown
Section II.B.
III.4 Formation free energy
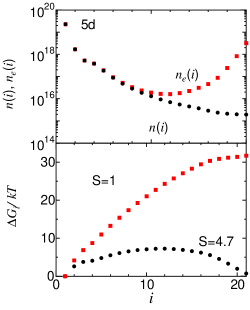
We derive the formation free energy of a cluster , using the equilibrium size distribution given by Eq.(7). In the derivation, we use the nucleation rate and obtained by the MD simulations and , where we use the value of measured by the simulations (see Section II.E. and Table II.) Using the -dependence of in Eq.(8) except the CNT, we also obtain at as
| (9) |
where is obtained from Eq.(2). corresponds to the contribution of the surface effect to the formation free energy of a cluster. If we know , we can predict and the nucleation rate for any value of .
Fig. 7 shows the size distribution of clusters obtained by MD simulations and the equilibrium one in run 5d. The formation free energies are shown for and in Fig. 7. From for , we obtain the maximum value of the formation free energy and the size of the critical cluster in run 5d, i.e., and . Table II shows the sizes of critical cluster obtained by the simulations for all runs.
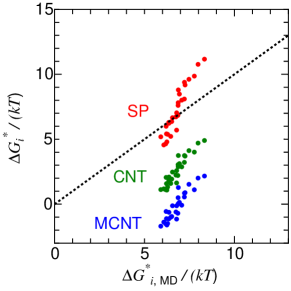
In Fig. 8, we compare the maximum value of the formation free energy at the critical cluster between the theoretical models and the MD simulations for all runs. Evaluating in the theoretical model, we use the values of the temperature and the supersaturation ratio obtained by the simulations shown in Table II. The CNT and MCNT considerably underestimate the maximum free energies. The SP model predicts the maximum free energies to a higher accuracy than the CNT and MCNT: the SP model predicts the maximum free energies within 30 %. In Matsubara et al.matsubara2007 , the similar comparison was performed. There are some differences between the our results and matsubara2007 . We confirmed that there is an inconsistency in Matsubara et al.matsubara2007 where they used slightly smaller temperatures in their figures than the true values of in Table I.matsubara2007 (private communications).
Figure 9 shows the formation free energy obtained by simulations at various temperatures. Predictions of the theoretical models are plotted with solid lines (SP model) and dashed lines (MCNT). The SP model exhibits much better agreement with the numerical results than the MCNT. The SP model reproduces the formation free energy of a cluster to within 10 %. The CNT also reproduces the formation free energy of a cluster better than the MCNT, but the gradient of the CNT data is different to the numerical results.
III.5 Sticking probability
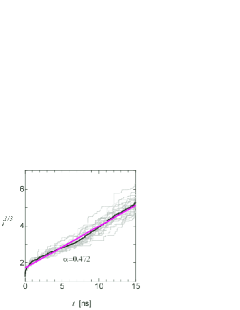
As shown in Section II, the nucleation rate is obtained from the equilibrium number density and the accretion rate which is proportional to the sticking probability . Using the growth rate of stable clusters obtained in the present MD simulation, we evaluated the sticking probability.
Tanaka et al.tanaka2011 evaluated the sticking probability from the growth rate of stable clusters, , neglecting the effect of evaporation. In the present study the evaporation effect was taken into account based on the method of Diemand et al.diemand2013 . The growth rate of clusters, , is given by
| (11) |
| (12) |
where we use .
As shown in Eq.(8), has a bulk term () and a surface term . Since the other terms in Eq.(8) are smaller than these terms, the sum, is approximately proportional to and
| (13) |
for . Hence for , we obtain
| (14) |
Equation (14) suggests that the evaporation becomes considerable when the supersaturation ratio is small. Accordingly, the sticking probability is given by
| (15) |
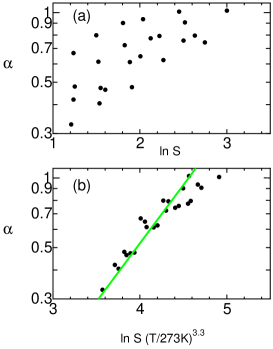
The time derivative of was evaluated from the MD simulations. Figure 10 shows the time derivative of for run 5d. Based on the slope, the sticking probability was measured to be . Using Eq.(15), we obtained the sticking probability for all runs. The values of are also listed in Table II. The results are shown in Figure 11 (a) as a function of supersaturation rate. By plotting a line of best fit, we obtained an empirical formula for the sticking probability:
| (16) |
(see Fig. 11 (b)). The sticking probability increases with the supersaturation ratio, which is consistent with the Lennard-Jones systemtanaka2011 ; diemand2013 . The formula (16) is valid within the parameter range of in which our MD simulations are done. In this range (), Eq.(16) indicates that increases with the temperature for a fixed . In the case of the flat surface and the equilibrium state (), on the other hand, the decreasing of with the increasing temperature is reported by the previous studymatsumoto1996 . Around the equilibrium state (), the sticking probability should be examined in the future work.
We evaluated , by using the growth rate of clusters larger than the critical size with Eq.(15). Matsubara et al.matsubara2007 evaluated the sticking probability (or the sticking coefficient), by directly measuring the condensation flux (i.e., accretion rate) for clusters smaller than or comparable to the critical size instead of the growth rate. Their values are one-order-of-magnitude greater than ours. This would indicate that the sticking probability might be different between the under-critical and the over-critical sizes. Matsubara et al.matsubara2007 suggested that their large sticking coefficients are due to the large surface area of clusters. For small clusters, larger surface areas than the simple prediction with the bulk density are also reported by other studiesym1 ; raymond . A high supersaturation ratio in Matsubara et al.matsubara2007 can be another factor which causes the above difference in .
IV SUMMARY AND FUTURE WORK
Our results on the nucleation of water molecules are summarized as follows.
1. The cluster size distributions, the formation free energy of a cluster, and the nucleation rates obtained from the MD simulations are compared with the predictions by the theoretical models (see Figures 3-6 and Table II). The CNT and the MCNT overestimate the nucleation rates (or the number density of critical clusters) for all runs. On the other hand, the SP model gives a better prediction. The nucleation rates predicted by the SP model are within one order of magnitude. The free energy of cluster formation (or the cluster integrals) for small clusters () is also well predicted by the SP model (with 10% accuracy) for a wide range of temperature. In this study, only large supersaturation ratios and nucleation rates were considered. In order to verify the validity of the SP model for smaller supersaturation ratios, simulations using a larger number of molecules are necessary.
2. The sticking probability of vapor molecules onto
clusters was measured in supersaturated conditions,
by using the growth rate of
stable clusters in the MD simulations.
The sticking probability increases with the
supersaturation ratio. This tendency is the same as exhibited by the
Lennard-Jones systemtanaka2011 ; diemand2013 .
The lowest value of was observed to be 0.3 for
K and .
It is expected that would be much smaller than
0.3 for lower supersaturation ratios.
For such low- cases, we must estimate precisely for the
evaluation of .
V Acknowledgments
We are grateful to Dr. Matsubara for discussions and valuable
comments. H. Tanaka and K. K. Tanaka acknowledge Dr. Diemand and
Dr. Angelil for fruitful discussions. We would like to thank the
anonymous reviewers for their valuable suggestions to improve the
quality of the paper. This work was supported by the Japan Society
for the Promotion of Science (JSPS).
VI Appendix
In the present paper, we use Eq.(7) to obtain the equilibrium number density. In this appendix, we show the relation Eq.(7) to the formula used in Matsubara et al.matsubara2007 . Equation (7) is a recurrence relation and yields
| (17) | |||||
If we assume
| (18) |
for all , we obtain
| (19) | |||||
which corresponds to the formula (27) in Matsubara et almatsubara2007 . Since the nucleation rate is expressed with the Zeldovich factor :
| (20) |
the condition (18) is written as
| (21) |
In the theory of CNT, MCNT, and SP model, the Zeldovich factor is given by
| (22) |
where in the CNT (or MCNT) corresponds to the case of .
Equation (22) indicates that
the condition (18) is satisfied in the case of
.
References
- (1) M. Volmer and A. Weber, Z. Phys. Chem. 119, 277 (1926).
- (2) V. R. Becker and W. Döring, Ann. Physik. 24, 719 (1935).
- (3) J. B. Zel’dovich, J. Exp. Theor. Phys. 12, 525 (1942).
- (4) J. Feder, K. C. Russell, J. Lothe, and G. M. Pound, Adv. in Phys. 15, 111 (1966).
- (5) J. L. Schmitt, G. W. Adams, and R. A. Zalabsky, J. Chem. Phys. 77, 2089 (1982).
- (6) R. C. Miller, R.J. Anderson, J. L. Kassner, Jr., and D. E. Hagen, J. Chem. Phys. 78, 3204 (1983).
- (7) J. L. Schmitt, R. A. Zalabsky, and G. W. Adams, J. Chem. Phys. 79, 4496 (1983).
- (8) G. W. Adams, J. L. Schmitt, and R. A. Zalabsky, J. Chem. Phys. 81, 5074 (1984).
- (9) A. Dillmann and G. E. A. Meier, J. Chem. Phys. 94, 3872 (1991).
- (10) D. W. Oxtoby, J. Phys. Condens. Matter 4, 7627 (1992).
- (11) D. Wright, R. Caldwell, C. Moxely, and M. S. ElShall, J. Chem. Phys. 98, 3356 (1993).
- (12) C. F. Delale and G. E. A. Meier, J. Chem. Phys. 98, 9850 (1993).
- (13) Y. Viisanen, R. Strey, and H. Reiss, J. Chem. Phys. 99, 4680 (1993).
- (14) A. Laaksonen, I. J. Ford, and M. Kulmala, Phys. Rev. E 49, 5517 (1994).
- (15) Y. Viisanen and R. Strey, J. Chem. Phys. 101, 7835 (1994).
- (16) D. Kane and M. S. El-Shall, J. Chem. Phys. 105, 7617 (1996).
- (17) K. Hämeri and M. Kulmala, J. Chem. Phys. 105, 7696 (1996).
- (18) C. C. M. Luijten, K. J. Bosschaart, and M. E. H. van Dongen, J. Chem. Phys. 101, 8116 (1997).
- (19) M. P. Anisimov, P. K. Hopke, I. N. Shaimordanov, S. D. Shandakov, and L-E. Magnusson, J. Chem. Phys. 115, 810 (2001).
- (20) J. Wölk, and R. Strey, J. Phys. Chem. B 105, 11683 (2001).
- (21) V. B. Mikheev, P. M. Irving, N. S. Laulainen, S. E. Barlow, and V. V. Pervukhin, J. Chem. Phys. 116, 10772 (2002).
- (22) A. Khan, C. H. Heath, U. M. Dieregsweiler, B. E. Wyslouzil, and R. Strey, J. Phys. Chem. B 119, 3138 (2003).
- (23) y. J. Kim, B. E. Wyslouzil, G. Wilemski, J. Wölk, and R. Strey, J. Phys. Chem. A 108, 43658 (2004).
- (24) V. Holten, D. G. Labetski, and M. E. H. van Dongen, J. Chem. Phys. 123, 104505 (2005).
- (25) D. Brus, V. Ždímal, and J. Smolík, J. Chem. Phys. 129, 174501 (2008).
- (26) D. Brus, V. Ždímal, and H. Uchtmann, J. Phys. Chem. A 131, 074507 (2009).
- (27) A. A. Manka, D. Brus, A-P. Hyvärinen, H. Lihavainen, J. Wölk, and R. Strey, J. Chem. Phys. 132, 244505 (2010).
- (28) I. J. Ford, Phys.Rev. E 56, 5615 (1997).
- (29) I. Kusaka, A. -G. Wang, and J. H. Seinfeld, J. Chem. Phys. 108, 3416 (1998).
- (30) K. Yasuoka and M. Matsumoto, J. Chem. Phys. 109, 8451 (1998).
- (31) K. Yasuoka and M. Matsumoto, J. Chem. Phys. 109, 8463 (1998).
- (32) P. R. ten Wolde and D. Frenkel, J. Chem. Phys. 109, 9901 (1998).
- (33) P. R. ten Wolde, M. J. Ruiz-Montero and D. Frenkel, J. Chem. Phys. 110, 1591 (1999).
- (34) K. J. Oh and X. C. Zeng J. Chem. Phys. 110, 4471 (1999).
- (35) I. Kusaka and D. W. Oxtoby, J. Chem. Phys. 110, 5249 (1999).
- (36) B. Senger, P. Schaaf, D.S. Corti, R. Bowles, D. Pointu, J. -C. Voegel, and H. Reiss, J. Chem. Phys. 110, 6438 (1999).
- (37) K. J. Oh and X. C. Zeng J. Chem. Phys. 112, 294 (2000).
- (38) S. Tanimura, K. Yasuoka, and T. Ebisuzaki, J. Chem. Phys. 112, 3812 (2000).
- (39) H. Vehkamäki and I. J. Ford, J. Chem. Phys. 112, 4193 (2000).
- (40) K. Laasonen, S. Wonczak, R. Strey, and A. Laaksonen, J. Chem. Phys. 113, 9741 (2000).
- (41) P. Schaaf, B. Senger, J. -C. Voegel, R. K. Bowles, and H. Reiss, J. Chem. Phys. 114, 8091 (2001).
- (42) S. Yoo, K. J. Oh and X. C. Zeng J. Chem. Phys. 115, 8518 (2001).
- (43) S. Toxvaerd, J. Chem. Phys. 115, 8913 (2001).
- (44) B. Chen, J. I. Siepmann, K. J. Oh and M. L. Klein, J. Chem. Phys. 115, 10903 (2001).
- (45) S. Toxvaerd, J. Chem. Phys. 119, 10764 (2003).
- (46) K. K. Tanaka, H. Tanaka, K. Kawamura, and K. Nakazawa, J. Chem. Phys. 122, 184514 (2005).
- (47) H. Matsubara, T. Koishi, T. Ebisuzaki, and K. Yasuoka, J. Chem. Phys. 127, 214507 (2007).
- (48) K. K. Tanaka, H. Tanaka, T. Yamamoto, and K. Kawamura, J. Chem. Phys. 134, 204313 (2011).
- (49) J. Diemand, R. Angelil, K. K. Tanaka, and H. Tanaka, J. Chem. Phys. 139, 074309 (2013).
- (50) D. Reguera, R. K. Bowles, Y. Djikaev, and H. Reiss, J. Chem. Phys. 118, 340 (2003).
- (51) D. Reguera, and H. Reiss, Phys. Rev. Let. 93, 165701 (2004).
- (52) V. I. Kalikmanov, J. Chem. Phys. 124, 124505 (2006).
- (53) J. Wedekind, J. Wölk, D. Reguera, and R. Strey, J. Chem. Phys. 127, 154515 (2007).
- (54) J. Merikanto, E. Zapadinsky, A. Lauri, I. Napari, and H. Vehkamäki, J. Chem. Phys. 127, 104303 (2007).
- (55) V. I. Kalikmanov, J. Wölk, and T. Kraska, J. Chem. Phys. 128, 124506 (2008).
- (56) H. J. Berendsen, J. R. Grigera. and T. P. Straatsma, J. Chem. Phys. 91, 6269 (1987).
- (57) F. Zipoli, T. Laino. S. Stolz, E. Martin, C. Winkelmann, and A. Curioni, J. Chem. Phys. 139, 094501 (2013).
- (58) R. Schulz, B. Lindner, L. Petridis, and J. C. Smith, J. Chem. Theory Comput. 5, 2798 (2009).
- (59) W. L. Jorgensen, D. S. Maxwell, and J. Tirado-Rives, J. Am. Chem. Soc. 118, 11225 (1996).
- (60) K. K. Tanaka, J. Diemand, R. Angelil, and H. Tanaka, submitted.
- (61) B. N. Hale, J. Chem. Phys. 122, 204509 (2005).
- (62) J. Qian, E. Stöckelmann, and R. Hentschke, J. Mol. Model 5, 281 (1999).
- (63) M. Matsumoto, Fluid Phase Equilib. 125, 195 (1996).
- (64) R. Angelil, J. Diemand, K. K. Tanaka, and H. Tanaka, J. Chem. Phys. 140, 074303 (2014).
| run | [K] | [nm] | nm | [ns] | |
|---|---|---|---|---|---|
| 6e | 375 | 44.10 | 4.66 | 4000 | 20 |
| 6d | 375 | 42.30 | 5.28 | 4000 | 15 |
| 6c | 375 | 40.50 | 6.02 | 4000 | 10 |
| 6b | 375 | 36.82 | 8.01 | 4000 | 8 |
| 5e | 350 | 52.50 | 2.76 | 4000 | 30 |
| 5e2 | 350 | 52.50 | 2.76 | 8000 | 30 |
| 5d | 350 | 49.50 | 3.30 | 4000 | 15 |
| 5c | 350 | 45.00 | 4.39 | 4000 | 10 |
| 5b | 350 | 40.91 | 5.84 | 4000 | 8 |
| 4e | 325 | 59.90 | 1.86 | 4000 | 20 |
| 4e2 | 325 | 59.90 | 1.86 | 8000 | 20 |
| 4d | 325 | 54.45 | 2.48 | 4000 | 15 |
| 4c | 325 | 49.50 | 3.30 | 4000 | 10 |
| 4b | 325 | 45.00 | 4.39 | 4000 | 8 |
| 3e | 300 | 65.34 | 1.43 | 4000 | 20 |
| 3e2 | 300 | 65.34 | 1.43 | 8000 | 20 |
| 3d | 300 | 59.40 | 1.91 | 4000 | 15 |
| 3c | 300 | 54.00 | 2.54 | 4000 | 10 |
| 3b | 300 | 49.09 | 3.38 | 4000 | 8 |
| 2e | 275 | 70.79 | 1.13 | 4000 | 20 |
| 2e2 | 275 | 70.79 | 1.13 | 8000 | 20 |
| 2d | 275 | 64.35 | 1.50 | 4000 | 15 |
| 2c | 275 | 58.50 | 2.00 | 4000 | 10 |
| v2b | 275 | 53.18 | 2.66 | 4000 | 8 |
| 1e | 250 | 76.23 | 0.903 | 4000 | 20 |
| 1d | 250 | 69.30 | 1.20 | 4000 | 15 |
| 1c | 250 | 63.00 | 1.60 | 4000 | 10 |
| 1b | 250 | 57.27 | 2.13 | 4000 | 8 |
| run | S | ||||||||||
|---|---|---|---|---|---|---|---|---|---|---|---|
| 6e | 375 | 379 | 3.35 | 4.44 | 0.563 | 985 | 58.4 | 14 | 20 | 10 | 0.328 |
| 6d | 375 | 380 | 3.37 | 9.74 | 1.13 | 1461 | 92.1 | 14 | 19 | 10 | 0.425 |
| 6c | 375 | 383 | 3.49 | 19.2 | 3.71 | 2811 | 193.1 | 13 | 17 | 9 | 0.479 |
| 6b | 375 | 390 | 3.41 | 83.7 | 13.7 | 6116 | 490.8 | 12 | 16 | 8 | 0.671 |
| 5e | 350 | 357 | 4.61 | 3.71 | 0.67 | 822.1 | 38.5 | 13 | 15 | 7 | 0.407 |
| 5e-2 | 350 | 355 | 4.98 | 7.03 | 1.29 | 1189 | 53.5 | 11 | 14 | 6 | 0.464 |
| 5d | 350 | 361 | 4.70 | 8.92 | 2.05 | 1530 | 79.5 | 12 | 14 | 7 | 0.472 |
| 5c | 350 | 366 | 4.78 | 29.1 | 9.77 | 3684 | 224.7 | 14 | 13 | 6 | 0.609 |
| 5b | 350 | 374 | 4.50 | 68.7 | 27.2 | 7015 | 497.0 | 13 | 12 | 6 | 0.798 |
| 4e | 325 | 340 | 6.72 | 3.73 | 1.46 | 911 | 38.0 | 11 | 11 | 5 | 0.476 |
| 4e-2 | 325 | 338 | 7.28 | 5.94 | 2.32 | 1099 | 46.7 | 12 | 10 | 5 | 0.649 |
| 4d | 325 | 346 | 6.54 | 8.63 | 4.79 | 1837 | 88.6 | 12 | 11 | 5 | 0.613 |
| 4c | 325 | 352 | 6.48 | 19.1 | 16.8 | 3805 | 213 | 11 | 10 | 4 | 0.719 |
| 4b | 325 | 359 | 6.08 | 49.1 | 39.6 | 6630 | 422 | 11 | 10 | 4 | 0.904 |
| 3e | 300 | 328 | 10.0 | 2.99 | 3.7 | 1076 | 43.9 | 10 | 9 | 4 | 0.622 |
| 3e-2 | 300 | 323 | 11.8 | 4.92 | 7.08 | 1347 | 57.3 | 10 | 8 | 3 | 0.762 |
| 3d | 300 | 334 | 9.09 | 7.42 | 8.14 | 1845 | 84.7 | 11 | 9 | 4 | 0.794 |
| 3c | 300 | 340 | 8.73 | 18.3 | 21.5 | 3369 | 175.8 | 9 | 8 | 3 | 0.776 |
| 3b | 300 | 347 | 7.99 | 46.6 | 47.8 | 5813 | 343 | 10 | 8 | 3 | 0.938 |
| 2e | 275 | 316 | 13.8 | 4.20 | 4.69 | 921.8 | 36.4 | 9 | 7 | 3 | 0.748 |
| 2e-2 | 275 | 310 | 18.6 | 4.50 | 12.2 | 1254 | 53.7 | 10 | 6 | 2 | 1.02 |
| 2d | 275 | 322 | 13.4 | 5.59 | 13.5 | 1766 | 79.6 | 11 | 7 | 3 | 0.803 |
| 2c | 275 | 327 | 12.7 | 16.1 | 33.2 | 3144 | 160 | 10 | 7 | 3 | 0.911 |
| 2b | 275 | 335 | 11.2 | 20.0 | 62.4 | 5113 | 287 | 11 | 7 | 3 | 1.02 |
| 1e | 250 | 303 | 23.0 | 4.39 | 9.47 | 908 | 37.2 | 9 | 6 | 2 | 0.885 |
| 1d | 250 | 310 | 21.0 | 5.22 | 2.19 | 1623 | 74.1 | 10 | 6 | 2 | 0.927 |
| 1c | 250 | 316 | 18.8 | 10.0 | 42.1 | 2644 | 132 | 10 | 6 | 2 | 1.01 |
| 1b | 250 | 323 | 16.3 | 24.0 | 82.6 | 4472 | 246 | 10 | 6 | 2 | 1.12 |