Calibration and data collection protocols for reliable lattice parameter values in electron pair distribution function (ePDF) studies
Abstract
We explore and describe different protocols for calibrating electron pair distribution function (ePDF) measurements for quantitative studies on nano-materials. We find the most accurate approach to determine the camera-length is to use a standard calibration sample of Au nanoparticles from National Institute of Standards and Technology. Different protocols for data collection are also explored, as are possible operational errors, to find the best approaches for accurate data collection for quantitative ePDF studies.
pacs:
,I Introduction
In an earlier paper Abeykoon et al. (2012) it was demonstrated that atomic pair distribution functions (PDFs) obtained from electron diffraction data from nanoparticles, collected in a standard transmission electron microscope (TEM), could be modeled to obtain quantitatively reliable structural information about the 3D structure, opening the possibility that the electron-PDF or ePDF method may become a convenient laboratory based nanoparticle structural characterization approach. In this way the powerful atomic PDF methods Egami and Billinge (2012); Billinge and Kanatzidis (2004); Billinge (2008); Young and Goodwin (2011) may be opened to a much broader audience since, currently, most data for PDF studies are collected at large user facilities such as X-ray synchrotrons and neutron sources where access is an issue. With ePDF it is possible, rather easily, to get PDFs using equipment that is already available in many chemistry and materials science laboratories, allowing PDF to become part of the standard suite of sample characterization tools. Furthermore, quantitatively reliable PDFs may be obtained from very small amounts of material, micro or nanograms of nanoparticles or thin films Cockayne (2007) and still be analyzed using modern PDF modeling tools Farrow et al. (2007); Neder and Proffen (2008); Cervellino et al. (2010). The earlier paper Abeykoon et al. (2012) demonstrated proof of principle; however, a number of experimental issues need to be addressed before this can become a standard technique and we explore a number of these issues here.
Similar to rapid data acquisition X-ray PDF (xPDF) experiments using area detectors Chupas et al. (2003), in ePDF measurements the effective sample to detector distance, or camera length, must be determined to convert the position of pixels on the detector from geometric units to scattering angle, , or the magnitude of the momentum transfer, or , where and is the electron wavelength (Here and are commonly used in the PDF and electron diffraction literature, respectively, for the same quantity Abeykoon et al. (2012)). In xPDF studies the wavelength of the incident radiation is determined first, and the diffraction pattern of a calibration sample of known lattice parameter is measured. The Debye-Scherrer rings from this pattern are then fit with the known value of the lattice parameter fixed but allowing the camera length to vary. Once the camera length and wavelength are known, the calibration is replaced with the sample of interest (SOI) which is measured without changing any of the experimental setup. The camera length and wavelength are then transferrable to the data from the SOI. In structure refinements on these data the known calibration constants are then fixed but the lattice parameter of the SOI varied in the refinement Egami and Billinge (2012).
In xPDF measurements, this same calibration dataset is also used to determine any non-orthogonality between the incident beam and the detector Hammersley (2004), and in determining instrumental resolution parameters such as in PDFgui Farrow et al. (2007).
These procedures are well established for xPDF measurements. However, a number of issues need to be addressed in the context of ePDF. First, a well characterized calibration sample for the ePDF case is problematic as the method requires the study a nano-material Abeykoon et al. (2012), but the lattice parameters of nanoparticles are often modified from the corresponding bulk material Gilbert et al. (2004); Masadeh et al. (2007). Here we explore different options for ePDF calibration samples. The calibration process is further complicated in ePDF because unlike xPDF the camera length of the instrument depends on easily varied parameters such as accelerating voltage and the magnetic lens settings, as well as the precise location of the sample in the instrument. We also explore here the error in the calibration that is brought about by incorrect procedures in this process, and suggest an optimal protocol for calibration and data collection in an ePDF measurement.
II Experimental methods
All electron diffraction data presented in this paper were collected using a JEOL ARM 200CF transmission electron microscope equipped with two sets of objective apertures, the upper objective aperture (UOA) located in the diffraction plane and the lower objective aperture (LOA) located below the diffraction plane. All electron diffraction patterns were recorded on a Gatan Orius CCD that eliminates charge overflow to the neighboring CCD pixels due to center beam saturation, and no beam-stop was used since charging of the beam-stop can introduce aberrations in the diffraction pattern Abeykoon et al. (2012). An accelerating voltage of 200 keV was used with a camera length of mm yielding a usable range of up to Å-1.
Two possible standard samples were considered: a standard Au nanoparticle sample and a commercially available evaporated aluminum film. The standard Au nanoparticle specimen was obtained from the National Institute of Science and Technology (NIST) in Gaithersburg, MD, US and has the designation SRM8011. It consists of Au nanoparticles that are nominally either 10 nm or 30 nm in size (depending on which standard is selected), suspended in solvent. The evaporated aluminum film deposited on G400, 400 square mesh copper Gilder grids was obtained from Ted Pella, Inc. and is a standard TEM camera length calibration sample.
All xPDF studies presented in this paper were carried out at the beamline X17A at National Synchrotron Light Source (NSLS) at the Brookhaven National laboratory. A commercial Ni powder sample from Alfa Aesar (catalog number: 10674) was used to calibrate both sample-to-detector distance and the instrument resolution parameter, Egami and Billinge (2012) of the xPDF setup, which was then used to determine the lattice parameters of the Au nanoparticle standard sample.
Integration of 2D electron diffraction was done using the software package Fit2D Hammersley et al. (1996), which has built-in features for doing the calibration. The most convenient uses a small set of internal standard samples whose structural information is known by the program. It is also possible to use a user-defined calibration sample as we had to do here, because the -spacings of our calibration nano-samples are not necessarily the same as those of the same material in the bulk. To create a user-supplied calibration file the first few -spacings of the Debye-Scherrer peaks in the sample must be loaded into the program. This file is then used to carry out the camera length calibration on measured data from the calibration sample. The 2D diffraction patterns are then integrated into 1D diffraction patterns using these calibration constants. Conversion to Egami and Billinge (2012) and then to Egami and Billinge (2012) and structural modeling was done using the home written software packages PDFgetE (unpublished) and Srfit Juhas et al. (2014) respectively.
II.1 ePDF data collection protocols
We collected ePDF data using different protocols to test the reliability of different approaches as well as the effect on the resulting quantitative PDF of different measurement aberrations.
II.1.1 Protocol 1: parallel illumination
Step 1. Load the calibration sample.
Step 2. In image mode, adjust objective focus to standard focus or . Focus TEM image by changing sample height to the eucentric height. Insert a selected-area aperture (SAA) to select the area of interest.
Step 3. In diffraction mode, insert UOA and focus it by changing diffraction focus.
Step 4. In diffraction mode, remove the objective aperture and focus the diffraction spots or rings by adjusting the brightness setting. Record electron diffraction patterns. (Because the UOA is located at the diffraction plane, a parallel illumination condition is assumed, when the UOA is focused in Step 3.)
Step 5. Unload the calibration sample and load the real specimen.
Step 6. Repeat Step 2 for the real specimen
Step 7. Diffraction focus remains untouched, and repeat step 4 for the real specimen
In our case, we collected 200 frames of 0.4 s for electron diffraction to obtain sufficient statistics in the high- region of the diffraction pattern. However, in general the data collection time per frame should be determined by considering the chemical composition, thickness of the specimen and the threshold intensity of the CCD. The total number of frames should then be determined depending on the required statistics in the high- region of . A beam stop was not used for these measurements due to possible distortions of the diffraction pattern caused by charging of the beam stop. Abeykoon et al. (2012)
II.1.2 Protocol 2: non-parallel illumination
In this protocol, the LOA is focused in the diffraction mode instead of the UOA in Step 3, which gives a convergence angle mrad on our instrument. All other steps in protocol 1 are followed. This is actually the standard procedure for most TEM measurements but may introduce problems for an ePDF measurement which we want to test.
II.1.3 Protocol 3: introducing a large deviation from the eucentric height
Step 1 - 5 in Protocol 1 are followed. In Step 6, the sample height is set to deviate 100 m from the eucentric height, which is compensated by adjusting image focus by -100 m. However, the diffraction focus is not changed and Step 7 is performed. This is done to test the impact on the calibration of a non-optimal operator procedure.
II.1.4 Protocol 4: changing diffraction focus
Step 1-6 in protocol 1 are followed. However, in Step 7, diffraction focus is adjusted to focus the LOA, leading to a change in camera length. Our intention is to simulate the extent of the aberration introduced were operators to focus diffraction spots or rings by arbitrarily changing the brightness and diffraction focus instead of by fixing the diffraction focus and adjusting brightness.
III Results and Discussion
III.1 Evaluation of the calibration samples
III.1.1 Au nanoparticles
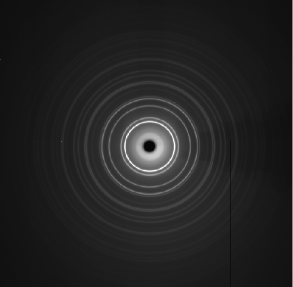
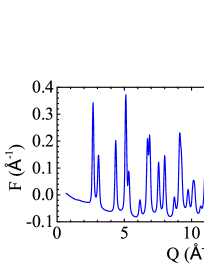
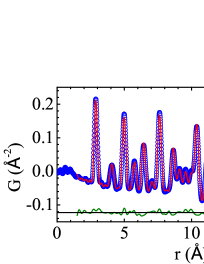
First we characterized the NIST standard 10 nm Au nanoparticles (RM8011) using the xPDF technique to have a baseline reference for the ePDF analysis. These came suspended in solution. Attempts to perform X-ray diffraction (XRD) measurements on the as-received solution in 1 mm Kapton capillaries did not produce a strong enough signal due to the low particle density in the solution. Therefore, the as-received solution was centrifuged to trap nanoparticles at the bottom of a vial. The solution at the top of the vial was carefully removed from the tube leaving (1-2) ml at the bottom with the sedimented nanoparticles which was filled into a 1 mm Kapton capillary for the XRD measurements. The 2D XRD pattern from the concentrated solution is shown in Figure 1. This pattern indicates a very good powder average. The reduced structure function calculated from the integrated 1D diffraction pattern of Au is shown in Figure 2(a), which also indicates the good statistics on the data up to Å-1. The resulting xPDF is shown in Figure 2(b) with a best-fit PDF from the FCC Au structural model overlaid. The xPDF experimental resolution function, , was obtained in the usual way by modeling a bulk Ni standard xPDF and this is fixed in subsequent modeling.
We found very good agreement between the experimental and calculated PDFs from the Au nanoparticles. The lattice constant, particle size and atomic displacement parameter (ADP) of the Au nanoparticles were obtained from the xPDF analysis, which will be used as a reference for ePDF analysis using the same standard sample. A calibration file of -spacings of the Au nanoparticles was prepared to be used in Fit2D to obtain the exact camera length used in the ePDF measurement. The calculated -spacings of Au that were used in the Fit2D calibration file are given in Table 1.
| Miller Indices hkl | Lattice spacing (Å) |
|---|---|
| 111 | 2.3534 |
| 200 | 2.0381 |
| 220 | 1.4411 |
| 311 | 1.2290 |
| 222 | 1.1767 |
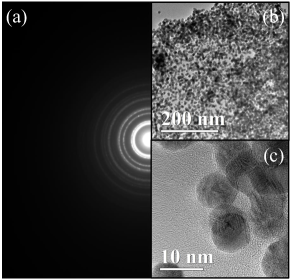
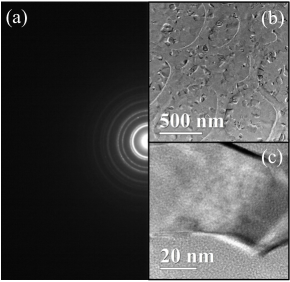
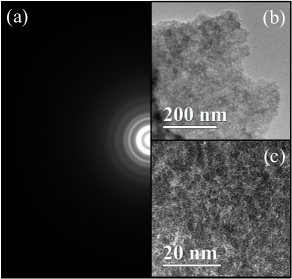
Attempts to make an ePDF calibration sample by placing a drop of the as-received solution on a TEM grid failed, again due to the low nanoparticle density. However, the TEM specimen prepared by centrifuging the as-received solution in a vial with a TEM grid placed at the bottom gave a very good signal producing the 2D electron diffraction pattern shown in Figure 3(a). This electron diffraction pattern shows a good powder average indicating a uniform 3D distribution of nanoparticles on the TEM grid. The TEM images shown in Figure 3(b) and (c) indicate a uniform distribution of particle size and shape.
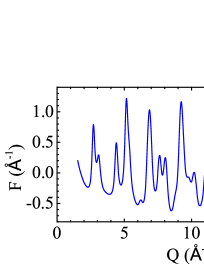
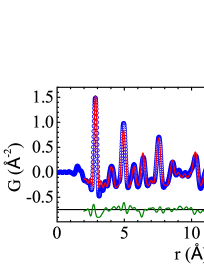
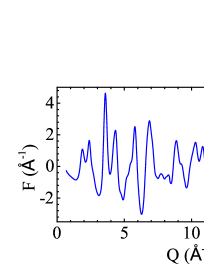
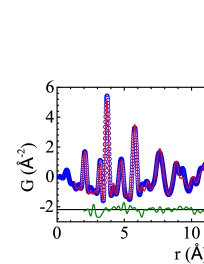
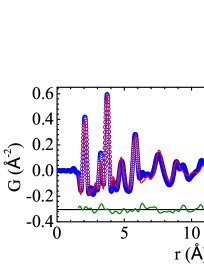
The reduced electron structure function , calculated from the integrated 1D electron diffraction pattern of Au given in Figure 4(a), shows data with very good statistics up to Å-1. The resulting PDF is shown using blue symbols in Figure 4(b). Plotted on top is the ePDF calculated from the structural model for FCC Au. The agreement is very good. The ePDF refinement results are compared with the xPDF results in Table 2.
| Au | xPDF | ePDF |
|---|---|---|
| (Å) | 4.076 | 4.076 |
| (Å2)111atomic displacement parameter(ADP) | 0.099 | 0.011 |
| (Å-1)222instrument resolution parameter | 0.043f | 0.095 |
| (Å2)333peak sharpening parameter | 3.87 | 5.71 |
| (Å-1)444peak broadening parameter | 0.057 | 0.039 |
| spdiameter (Å)555particle size | 100.6 | 100.6666fixed to the xPDF value during the refinement |
| (%) | 9 | 18 |
The good agreement between the lattice parameters obtained from the xPDF and ePDF analysis is expected since we used the -spacings obtained from the xPDF measurement to calibrate the camera length. However, there is also good agreement for the ADPs indicating minimal multiple scattering effects in this sample Abeykoon et al. (2012).
Using obtained from the Ni calibration sample, we obtained a particle size of 10.06 nm from the xPDF measurement, in good agreement with the nominal size of 10 nm reported by NIST.
In general, the PDF signal damps at high- due to two factors, the experimental -space resolution and the average particle size in a nanoparticle sample Egami and Billinge (2012). In X-ray and neutron PDF studies, the bulk standard sample measurement used to obtain the sample-to-detector distance can also be used to determine the instrument resolution function in the PDF analysis, , by assuming an infinite particle size for the crystalline calibrant. However, it is not possible to use a bulk sample as the calibration standard in ePDF studies due to the enhanced multiple scattering signal. In this situation, an electron diffraction pattern from a standard nanomaterial (with a known particle size) is a better choice to calibrate the camera length and the PDF instrument resolution function, . Here we fully characterized the NIST standard 10 nm Au nanoparticles using xPDF, and these values were used to calibrate the camera length and in ePDF experiments where the same sample was used as a calibrant. These values are presented in Table II in the xPDF column. The procedure to follow is to measure the NIST-standard Au nanoparticle sample in the TEM and do the camera length calibration. Then, during ePDF modeling, fix spdiameter to 100.6 Å, the number refined from the xPDF analysis, but allow to vary. The refined value of should then be fixed and used in subsequent refinements on ePDFs of the real samples. The parameter spdiameter can then be allowed to vary and should give an accurate determination of the particle size (or, more accurately, size of the coherent structural domain Egami and Billinge (2012)) in the sample.
III.1.2 Evaporated Aluminum
Another convenient specimen for TEM camera-length calibration is an evaporated aluminum film deposited on G400, 400 square mesh copper Gilder grid, from Ted Pella, Inc. A list of principal lattice spacings necessary to make a software calibration file is provided with the sample by the manufacturer and reproduced for completeness in Table 3).
| Miller Indices hkl | Lattice spacing (Å) |
|---|---|
| 111 | 2.3380 |
| 200 | 2.0240 |
| 220 | 1.4310 |
| 311 | 1.2210 |
| 222 | 1.1690 |
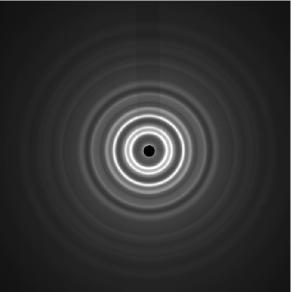
To investigate whether the commercial Al films are accurate calibrants for camera length calibration, three Al-film samples were tested. The TEM camera length was first calibrated using the NIST-standard Au sample following Protocol 1, which was then removed. Three Al film samples, from the same order received from the manufacturer, were subsequently measured one by one using the same protocol. It was noted that the electron diffraction patterns of the Al films were very spotty when the similar beam size ( m) was used for the NIST Au nanoparticle sample. Therefore, 30 electron diffraction patterns recorded from different areas were averaged to obtain a better powder average. The averaged electron diffraction pattern is shown in Figure 5(a), and the TEM image at low and high magnification is shown in (b) and (c), respectively.
The camera length was refined to be 79.61 mm for the Au nanoparticle sample, while the three evaporated Al samples gave 79.15 mm, 78.74 mm and 79.48 mm, respectively. We therefore found a significant variability in the camera length obtained from different Al-films. The evaporated Al samples are inexpensive and convenient to use, but appear to be giving camera lengths with an accuracy no better than the 1 % level. If higher accuracy than this is needed, then the particular Al film used should itself be calibrated, or NIST-standard Au should be used. A further drawback of using the Al films as an ePDF calibration sample for more accurate PDF modeling is that the particle size is not known and therefore we cannot get a reliable value for . For the most accurate work we recommend use of the NIST standard nanoparticle Au sample as a calibrant.
III.2 Evaluation of data collection protocols
Here we compare the results obtained using different data collection protocols described in Sec. II.1. A commercial SnO2 nanoparticle sample (Nano-Oxides, Inc, catalog number: 18-025) was used for this purpose. This sample was first characterized by using the xPDF technique to have a reference in the ePDF study. The 2D X-ray diffraction pattern from the SnO2 nanoparticle sample is shown in Figure 6. The rings are smooth indicating a good powder average, and broad suggesting a nanocrystalline sample. The resulting and are shown in Figure 7, (a) and (b) respectively. The xPDF from the best-fit model is plotted in red over the data with a difference curve offset below. The agreement is acceptable for a nanocrystalline sample.
Material from the same sample was then studied using electron diffraction. The 2D electron diffraction pattern and real-space TEM images from the SnO2 nanoparticle sample are shown in Figure 8. The 2D electron diffraction pattern is smooth, indicating a good powder average while the images indicate a uniform particle size and shape distribution. The resulting and ePDF is shown in Figure 9(a) and (b), respectively, again with the best-fit PDF from the structural modeling plotted over the top of ePDF. The similarity to the xPDF in Fig. 7 and the good agreement of the structural models indicate the good quality of the ePDF data.
The values of refined parameters from fits to the xPDF as well as ePDFs obtained with different protocols is reproduced in Table 4. For both xPDF and ePDF modeling, the instrument resolution parameter, , was fixed to the value refined from the calibration sample, respectively. For a more clear comparison of lattice parameters between the ePDF and xPDF results, the differences with respect to the xPDF-refined values are shown as a percentage for different protocols of ePDF, respectively. Protocol 1-3 gave deviations within 0.4% and 1.3% from the xPDF values for lattice parameter and , respectively, while differences of 1.0% and 2.6% were found for and , respectively, in Protocol 4. Overall, protocol 4 resulted in bigger differences from the xPDF reference than other protocols.
The only difference between Protocol 1 and 2 is the illumination condition with parallel illumination in Protocol 1 and non-parallel illumination in Protocol 2. Therefore, once the camera length is calibrated in the same condition, non-parallel beam illumination should still lead to correct results. Moreover, as tested in Protocol 2, with all other conditions fixed, a slightly convergent beam could improve the signal statistics at high to some extent, since a convergent beam leads to a larger electron beam current when an SAA is used. Protocol 3 also gave similar results with Protocol 1 and 2, which indicates that deviation in sample height at least up to 100 m has little or no impact on quantification of electron diffraction in the our test circumstance. However, this condition led to large distortion of real-space images, affecting correct estimation on size and shape of nanoparticles, which is not recommended. Protocol 4 simulates the wrong operation that diffraction focus is adjusted to focus diffraction spots or rings after the real specimen is loaded. Our settings gave a change of 1.6 % in camera length, which resulted in a larger deviation in lattice parameters from the xPDF reference in Protocol 4. This deviation is directly correlated with the change in camera length. Therefore, change in diffraction focus during TEM operation should be strictly avoided.
Multiple electron scattering can give rise to complications of quantifying electron diffraction patterns, especially when the sample is thick and oriented on its zone axis. In ePDF experiments, this multiple scattering effect is expected to be reduced due to the small nanoparticle size and randomly distributed orientations. However, to fully understand the impact of multiple scattering on randomly oriented nanoparticle samples, further experimental studies together with theoretical simulation will be conducted in the future.
| SnO2 | xPDF | protocol 1 | protocol 2 | protocol 3 | protocol 4 |
|---|---|---|---|---|---|
| (Å) | 4.751 | 4.75(0 %) | 4.73(-0.4 %) | 4.76(0.2 %) | 4.80(1.0 %) |
| (Å) | 3.187 | 3.23(1.3 %) | 3.21(0.7 %) | 3.23(1.3 %) | 3.27(2.6 %) |
| 0.3004 | 0.2970 | 0.2953 | 0.2956 | 0.2960 | |
| (Å2) | 0.003 | 0.001 | 0.001 | 0.003 | 0.001 |
| (Å2) | 0.03 | 0.01 | 0.01 | 0.02 | 0.01 |
| (Å-1) | 0.043777fixed during the refinement | 0.095a | 0.095a | 0.095a | 0.095a |
| (Å2) | 3.4 | 5 | 5 | 5 | 6 |
| (Å-1) | 0.14 | 0.4 | 0.5 | 0.2 | 0.5 |
| spdiameter (Å) | 21 | 22 | 24 | 25 | 25 |
| (%) | 18 | 24 | 25 | 25 | 26 |
IV Conclusions
To quantify ePDF measurements, the NIST-standard Au nanoparticle sample is recommended over the commercial Al-film sample, because the Au sample provides more reliable calibration of camera length and the uniform size distribution of the Au nanoparticles can be used to determine the instrument resolution, , in TEM. Four ePDF protocols, including common/possible operational mistakes, were tested by comparing the refined parameters of the SnO2 nanoparticle sample in ePDF with the xPDF results. Protocol 1 and 2 with parallel and slightly convergent illumination, respectively, showed accuracy within 0.4 % and 1.3 % for determining lattice parameter and , respectively. Protocol 3 with incorrect sample height also led to very similar results as in protocol 1 and 2. However, real-space images were significantly distorted, which made estimation on nanoparticle size and shape difficult. Hence, Protocol 3 is not recommended. Diffraction focus was adjusted in Protocol 4 after the Au calibration diffraction was recorded, which directly led to a change in camera length and should be strictly avoided. Overall, Protocol 1 and 2 are recommended.
Acknowledgements.
This work was carried out as part of the Flucteam project at BNL supported by the US Department of Energy, Office of Science, Office of Basic Energy Sciences (DOE-BES) through account DE-AC02-98CH10886. Use of the National Synchrotron Light Source, Brookhaven National Laboratory, was supported by the DOE-BES under Contract No. DE-AC02-98CH10886.References
- Abeykoon et al. (2012) M. Abeykoon, C. D. Malliakas, P. Juhás, E. S. Božin, M. G. Kanatzidis, and S. J. L. Billinge, Z. Kristallogr. 227, 248 (2012), highlighted on the journal cover.
- Egami and Billinge (2012) T. Egami and S. J. L. Billinge, Underneath the Bragg peaks: structural analysis of complex materials (Elsevier, Amsterdam, 2012), 2nd ed.
- Billinge and Kanatzidis (2004) S. J. L. Billinge and M. G. Kanatzidis, Chem. Commun. 2004, 749 (2004).
- Billinge (2008) S. J. L. Billinge, J. Solid State Chem. 181, 1698 (2008).
- Young and Goodwin (2011) C. A. Young and A. L. Goodwin, J. Mater. Chem. 21, 6464 (2011).
- Cockayne (2007) D. J. H. Cockayne, Annu. Rev. Mater. Res. 37, 159 (2007).
- Farrow et al. (2007) C. L. Farrow, P. Juhás, J. Liu, D. Bryndin, E. S. Božin, J. Bloch, T. Proffen, and S. J. L. Billinge, J. Phys: Condens. Mat. 19, 335219 (2007).
- Neder and Proffen (2008) R. B. Neder and T. Proffen, Diffuse Scattering and Defect Structure Simulations: A cook book using the program DISCUS (Oxford University Press, Oxford, 2008).
- Cervellino et al. (2010) A. Cervellino, C. Giannini, and A. Guagliardi, J. Appl. Crystallogr. 43, 1543 (2010).
- Chupas et al. (2003) P. J. Chupas, X. Qiu, J. C. Hanson, P. L. Lee, C. P. Grey, and S. J. L. Billinge, J. Appl. Crystallogr. 36, 1342 (2003).
- Hammersley (2004) A. P. Hammersley (2004), ESRF Internal Report ESRF98HA01T.
- Gilbert et al. (2004) B. Gilbert, F. Huang, H. Zhang, G. A. Waychunas, and J. F. Banfield, Science 305, 651 (2004).
- Masadeh et al. (2007) A. S. Masadeh, E. S. Božin, C. L. Farrow, G. Paglia, P. Juhás, A. Karkamkar, M. G. Kanatzidis, and S. J. L. Billinge, Phys. Rev. B 76, 115413 (2007).
- Hammersley et al. (1996) A. P. Hammersley, S. O. Svenson, M. Hanfland, and D. Hauserman, High Pressure Res. 14, 235 (1996).
- Juhas et al. (2014) P. Juhas, C. Farrow, X. Yang, and S. J. L. Billinge (2014), submitted.