Discovery of a Small Central Disk of CO and H I in the Merger Remnant NGC 34
Abstract
We present CO(1-0) and H I (21-cm) observations of the central region of the wet merger remnant NGC 34. The Combined Array for Research in Millimeter-wave Astronomy (CARMA) observations detect a regularly rotating disk in CO with a diameter of 2.1 kpc and a total molecular hydrogen mass of (. The rotation curve of this gas disk rises steeply, reaching maximum velocities at (410 pc) from the center. Interestingly, H I observations done with the Karl G. Jansky Very Large Array show that the absorption against the central continuum has the exact same velocity range as the CO in emission. This strongly suggests that the absorbing H I also lies within from the center, is mixed in and corotates with the molecular gas. A comparison of H I absorption profiles taken at different resolutions () shows that the spectra at lower resolutions are less deep at the systemic velocity. This provides evidence for H I emission in the larger beams, covering the region from 1 kpc to 9 kpc from the center. The central rapidly rotating disk was likely formed either during the merger or from fall-back material. Lastly, the radio continuum flux of the central source at mm wavelengths ( mJy) is significantly higher than expected from an extrapolation of the synchrotron spectrum, indicating the contribution of thermal free-free emission from the central starburst.
Subject headings:
galaxies: evolution — galaxies: individual (NGC 34, NGC 17, Mrk 938) — galaxies: interactions — galaxies: Seyfert — galaxies: starburst — radio continuum: galaxies1. Introduction
Gas-rich mergers are key to understanding the hierarchical growth and evolution of galaxies (White & Rees, 1978). Much progress has been made to understand the overall role of mergers in the formation of early-type galaxies, and it is now accepted that many are a product of gas-rich mergers (e.g., Schweizer, 1998). There are still some uncertainties on how exactly the transformation takes place, especially how a gas-rich system ultimately rids itself of gas. These details are what possibly dictate whether the merger remnant becomes an elliptical or whether a new disk forms, as seen in some observations and simulations of gas rich mergers (Schiminovich et al., 2013; Barnes, 2002). The possible presence of a starburst or AGN further complicates the picture. While gas can fuel both starbursts and AGNs, these phenomena may cause outflows and remove the gas from the inner parts. It is thus important to study the gas in the central regions of mergers in its molecular and atomic phases to help predict the ultimate fate of the system.
NGC 34 ( NGC 17 Mrk 938) is an ideal candidate to study these processes since it is gas-rich and hosts both a starburst and an AGN. Throughout the paper, we adopt a distance of 85.2 Mpc, derived for km s-1 Mpc-1 by Schweizer & Seitzer (2007, hereafter SS07). The infrared luminosity of this object is (Chini et al., 1992), placing it in mid-range of the classically defined Luminous Infrared Galaxies (LIRGs; ; Soifer et al. (1987)). In general, high IR luminosities are due to dust grains being heated by a combination of starburst and AGN, with higher values indicating a greater AGN contribution (Sanders & Mirabel, 1996). The IR luminosity of NGC 34 suggests that the starburst is the dominant phenomenon in the center, with a minor AGN component (Gonçalves et al., 1999; Prouton et al., 2004). This has been confirmed by a detailed study of NGC 34’s IR spectrum done by Esquej et al. (2012), where the AGN bolometric contribution to the total infrared luminosity is estimated to be . In addition, the IR images show that the starburst takes place in the inner kpc of the merger remnant. These authors find, however, that the presence of an AGN is needed to explain the hard X-ray luminosity.
An optical study by SS07 showed that NGC 34 is the likely product of an unequal-mass merger, with a rich system of young globular clusters. Deep optical images show two long tidal tails and structures such as ripples, jets, and shells, all typical of merger remnants (Schweizer, 1998). In addition to this, the surface-brightness profiles in , , and indicate the presence of a blue exponential stellar disk with a scale length of kpc, possibly formed from gas falling back into the merger remnant. The optical spectrum features a blueshifted Na I D doublet in absorption, indicative of a mean gas outflow velocity of km s-1 and a maximum velocity of km s-1.
Earlier, we performed a first imaging study of the H I and radio continuum to better understand the fate of cold gas during the merger (Fernández et al., 2010, hereafter Radio I). We detected of H I gas, which is mostly distributed along the tails, and saw evidence for gas settling onto the blue exponential disk found by SS07. The most puzzling part of our study was the detection of a strong H I absorption feature of km s-1 width at the systemic velocity, covering both blueshifted and redshifted velocities and seen against the strong unresolved central continuum source of 62.4 mJy. We presented two possible scenarios to explain the puzzling absorption: either we were probing an H I disk in absorption against an extended continuum source so that we saw both the blue and redshifted part in absorption, or we were seeing gas associated with the tidal tails in projection against the continuum.
In this follow-up radio study, we present new CO imaging and H I absorption observations obtained at higher angular resolution and with a wider velocity coverage. We seek to determine which of the above two scenarios explains the puzzling absorption better by comparing the distribution and kinematics of the CO to the H I absorption data. In addition, the new continuum observations at mm-wavelengths allow us to probe the spectral index at high frequencies. Lastly, both sets of new observations have a much wider velocity coverage, enabling us to search for an atomic or molecular counterpart to the outflow seen optically.
The structure of the paper is as follows. We summarize the observations and data reduction in Section 2, present our results in Section 3, discuss what we have learned from these observations in Section 4, and put forth our conclusions in Section 5.
2. Observations and Data Reduction
2.1. CARMA Observations
NGC 34 was observed in the CO transition at 115.2712 GHz with the Combined Array for Research in Millimeter-wave Astronomy (CARMA) in May 2011. The observations were done in two configurations: in D array for 4.1 hours on source and in C array for 5.8 hours. The spacings for these two arrays are m and m, respectively. The primary flux calibrator was Uranus, and 3C454.3 was used as the passband calibrator. Both sets of observations used a 1 GHz bandwidth centered at 113.11 GHz, corresponding to the central frequency of the single-dish observations. This translates to a heliocentric velocity of 5731 km s-1, using the optical definition. This setup results in a velocity coverage of 2980 km s-1, starting at 4238 km s-1 and ending at 7218 km s-1, with 150 channels with a velocity resolution of km s-1.
The data were reduced with the software package Multichannel Image Reconstruction Image Analysis and Display (MIRIAD) using standard calibration procedures for each configuration (Sault et al., 1995). For each band, we flagged the first and last 2 channels due to poor sensitivity at the edge of the band. The phase stability was inspected and poor data were flagged for each track. The C and D array calibrated visibilities were then combined and the continuum was estimated from 696 (unsmoothed) signal free channels. The deconvolution task uses a Steer CLEAN algorithm (Steer et al., 1984), and we selected natural weighting (robustness parameter set to 2) to maximize the sensitivity to broad, faint structures. The final combined data cube has a synthesized beam of ( kpc) at FWHM and a noise of 8.4 mJy beam-1.
| CO(1–0)11Observed in May 2011 | H I 22Observed in April 2011 | |
|---|---|---|
| Flux Calibrator | Uranus | 3C48 |
| Phase Calibrator | 3C454.3 | J2357-1125 |
| Number of Channels | 150 | 256 |
| Bandwidth (MHz) | 1000 | 32 |
| Synthesized Beam | ||
| Field of View | ||
| Velocity Coverage | 3000 | 7000 |
| (km s-1) | ||
| Velocity Resolution | 20 | 27 |
| (km s-1) | ||
| Noise | 8.4 | 0.21 |
| (mJy beam-1chan-1) | ||
| Column density sensitivity33In emission | () | |
| (cm-2 chan-1) |
2.2. VLA Observations
NGC 34 was observed with the Karl G. Jansky Very Large Array (VLA)111The National Radio Astronomy Observatory is a facility of the National Science Foundation operated under cooperative agreement by Associated Universities, Inc. in April 2011 in the B array configuration (spacings of km) during two runs for a total observing time of 7 hours. The observations used a 32 MHz bandwidth centered at the heliocentric velocity of 5870 km s-1, with a total of 256 channels with a resolution of km s-1. This results in a velocity coverage of 7000 km s-1, from 2426 km s-1 to 9421 km s-1.
Each run was reduced with the Astronomical Imaging Processing System (AIPS) using standard calibration procedures. The data were combined in the uv plane, and then several iterations of self-calibration were performed to correct for amplitude and phase errors. We first made a continuum image by averaging 80 line-free channels, using a robustness parameter of 1 and setting CLEAN boxes around the point source. This image served as the initial input model for the first run of phase self-calibration. After each run, we made a new input model by imaging the continuum applying the new solutions for subsequent self-calibration runs. After three runs of phase self-calibration and one of amplitude, we achieved a dynamic range of about 760:1 and an rms sensitivity of 0.07 mJy beam-1. We then applied the solutions to the whole data set, and subtracted the continuum in the uv plane by making a linear fit through the line-free channels. The H I cube was made using a robustness parameter of 1, and cleaning the channels containing H I absorption. The resulting images have an rms noise of 0.2 mJy beam-1 and a synthesized beam of ( kpc).
Table 1 summarizes all parameters used for the CARMA and VLA observations.
3. Results
3.1. A Central Disk of CO
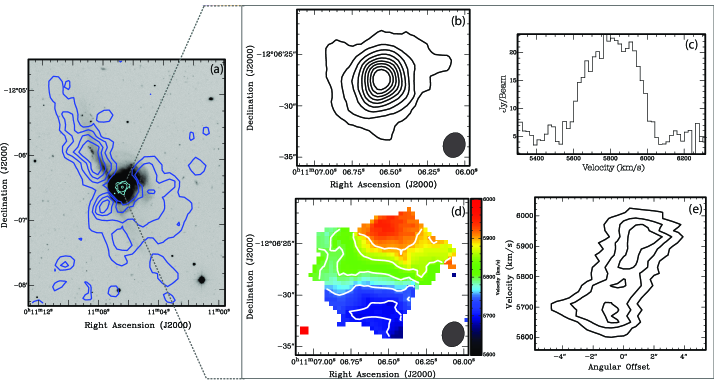
The CO observations reveal a disk of molecular gas in the central regions of the remnant. Figure 1 is composed of various panels showing the gas distribution and kinematics. This CO disk lies at the center of NGC 34 and is much smaller than the optical disk (Figure 1a). It shows a regular rotation pattern as seen in Figures 1d and 1e. There are hints of extended emission towards the northwest, northeast, and south (Figure 1b). We estimate a diameter of 2.1 kpc by measuring the extent of the emission enclosed by the second lowest density contour, which corresponds to 4.31 Jy km s-1 beam-1.
We calculate the CO luminosity with the following equation (Solomon et al., 1997):
| (1) |
where is the integrated CO flux in units of Jy km s-1, is the observed frequency in GHz, and is the luminosity distance in Mpc. We compute the CO flux using channel maps and get a value of Jy km s-1, which results in a CO luminosity of K km s-1 pc-2. We multiply this value by to get a molecular hydrogen mass in solar masses (). Here we use , which is the standard conversion factor for starbursting systems (Downes & Solomon, 1998), and get an H2 mass of .
Single-dish CO(1–0) data (Kandalyan, 2003; Chini et al., 1992; Kruegel et al., 1990) yield a flux of Jy km s-1, which is 12% higher than what we detect. This is a marginal difference, but—if significant—it might be indicating that our observations miss an extended component of the CO disk. This component is hinted at by the weak extensions seen in Figure 1b, suggesting that observing with shorter spacings could have detected this more extended gas.
As seen in the spectrum of Figure 1c, the CO emission spans close to 500 km s-1. The intensity-weighted velocity field (Figure 1d) and the position-velocity (PV) diagram (Figure 1e) along the major axis of the optical disk (PA ; SS07) show that the kinematics are consistent with rotation, with the north side of the disk receding, and the south side approaching. The extended emission features mentioned above have velocities consistent with the gas in the main body of the disk, suggesting they are real and possibly part of a fainter component not detected in our observations. The PV diagram demonstrates that the rotation curve rises very steeply, reaching peak velocities within from the center, and showing a slight decrease towards the edges.
3.2. High Resolution H I Absorption
Our new VLA B-array observations probe the previously known H I absorption feature (Radio I) with a wider velocity coverage and at higher resolution. Figure 2 consists of three panels showing these observations, including a comparison to the absorption profiles presented in Radio I, and to the CO observations in emission presented in Section 3.1. The top panel represents the H I absorption feature seen against the peak of the continuum emission and showing the full velocity coverage of 2426–9421 km s-1, with no hint of absorption seen at the outflow velocity (5000 km s-1) detected by SS07 (see next section).
The second panel compares these higher resolution (2 kpc) data to the previous H I observations in the DnC (18 kpc) and CnB (6 kpc) configurations. Note that the depth of absorption is similar in the three configurations at the extreme velocities around 5600 km s-1 and 6000 km s-1, but is very different near the systemic velocity of 5870 km s-1. A deep feature is seen in B array at this velocity, which is shallower in C and nearly absent at some velocities in D. We can understand this as follows: Since the continuum source is unresolved in B array, we see a combination of absorption against the continuum source plus emission further out within the central beam in C and D array. We can estimate how much emission there is on different scales by looking at the difference in the absorption profiles. We do this by summing the difference between the two profiles at different resolutions for each velocity bin to get a flux. As shown in Radio I, there is of H I in emission between the inner 6 and 18 kpc of the remnant. Now we can determine how much H I in emission there is between the inner 2 and 6 kpc by comparing the CnB and the B array data. We calculate an H I mass of in the velocity interval km s-1. Since the two data sets have different velocity resolutions, we created velocity bins of 50 km s-1 and then averaged the values that were in a given bin.
The bottom panel compares the range of velocities seen in the H I absorption and the CO emission. The plot shows that the velocity ranges for the emission and the absorption are almost identical. The range covered for the H I absorption profile is km s-1 and for the CO profile is km s-1, as measured at the profile base. This remarkable agreement in velocity range makes it plausible that the H I and CO emissions arise from the same central gas disk, imaged in CO at resolution (Figs 1b and 1d). In addition, it implies that the H I is intermixed with the molecular gas and that it also reaches maximum velocities within ( kpc) from the center.
3.3. Molecular and Atomic Gas Outflow
We can use the current observations to search for a counterpart in H I and/or CO(1–0) to the outflow detected by SS07 in the NaD I doublet. We do not detect the outflow in either line, but can place upper limits. We calculate the noise near the central regions of NGC 34 and around 5000 km s-1, consistent with the velocities of the optical outflow. We use the following equation to get a mass outflow rate upper limit (Heckman et al., 2000; Rupke et al., 2002) for both H I absorption and emission:
| (2) |
where is the solid angle subtended by the outflow, is the line-of-sight covering fraction, is the size of the region from where the outflow is produced, is the column density, and is the velocity of the outflow. For the first three quantities, we assume , , and = 1 kpc, which are values consistent with outflows seen in LIRGs (Rupke et al., 2002). For the absorption, we calculate the H I column density assuming 5 and get cm-2 (assuming K). Lastly, we take km s-1, which is the mean velocity of the outflow detected by SS07. The resulting upper limit for the mass outflow rate is 14 in absorption. Using the same values, but now calculating N(H I ) in emission, the upper limit is about 130 . This large number is a consequence of the poor surface brightness sensitivity in B array.
¿From the CO emission, we can calculate an upper limit for the outflow rate by dividing the molecular mass by the dynamical timescale (e.g., Alatalo et al., 2011). We compute an upper limit for the molecular-gas mass using 5 and the velocity of the optical outflow, resulting in . We can estimate the dynamical time by assuming a size of 1 kpc for the wind emitting region and the optical velocity, which results in a timescale of only 1.6 Myr. These two values yield an upper limit for the CO mass outflow rate of about 40 .
3.4. Central continuum
This study includes new continuum images of the central components of the merger remnant. The VLA B-array observations show a slightly resolved point source with a flux of mJy, consistent with the measurement presented in Radio I.
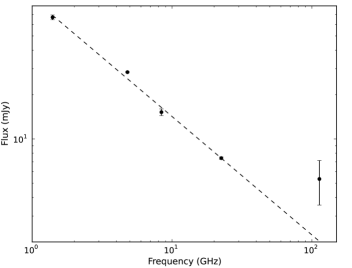
The CARMA observations reveal a faint central continuum source at millimeter wavelengths with a flux of mJy. This measurement allows us to probe the spectral index at high frequencies. At low frequencies ( GHz), the spectrum for star-forming galaxies is usually dominated by synchrotron radiation, with typical values of . At higher frequencies ( GHz), free-free emission starts to dominate and the spectral index is . Dust emission takes over at frequencies above 200 MHz with (Condon, 1992).
Figure 3 shows the radio spectrum for NGC 34 between 1.4 GHz and 113.11 GHz. The first four values in the range of GHz were reported by Clemens et al. (2008), and the one at 113.11 GHz is the measurement presented here. We fit a line through the first four measurements and extend it to 113.11 GHz to better show that the spectrum flattens at higher frequencies. The fit of the line yields a slope of , indicating that the emission at these frequencies is due to synchrotron radiation. The spectral index between 22.5 GHz and 113.11 GHz is . The flattening of the spectrum at higher frequencies shows that synchrotron emission is no longer dominant, and free-free emission from HII regions takes over.
4. Discussion
4.1. The Gaseous Disk in the Inner Regions of the Remnant
Our CO observations confirm the presence of a disk in the inner regions of the remnant, which was one of the two scenarios suggested in Radio I to explain the H I absorption observations. The match in velocities for both sets of observations (Fig. 2) strongly suggests that the central H I absorption is due to the presence of a rotating disk. As shown in the PV diagram of Figure 1e, the maximum velocities are reached within only 1 (0.4 kpc) from the center. The close match in velocity between the molecular gas and H I absorption argues that the absorbing gas also reaches maximum velocities within 0.4 kpc from the center. This is consistent with higher-resolution continuum images by Condon et al. (1991) that resolve the central source and show it to be a dominant central component with an extension to the south, with a total size of 2.5 (1 kpc). This extended continuum makes it possible to trace out the H I absorption to its maximum velocity at from the center.
The question now is whether any of the continuum emission could be due to the AGN. Several recent studies have calculated the AGN contribution to be small () in NGC 34 (e.g., Vega et al., 2008; Esquej et al., 2012; Murphy, 2013). In addition to this, VLBI observations report a single-baseline detection (Lonsdale et al., 1993), which suggests that this merger remnant does not host a strong point source due to the AGN, and its continuum is likely dominated by the starburst.
4.2. The Fate of Gas in the Merger
The optical study by SS07 and the radio observations presented here and in Radio I have shown different components of the new disk formed after the merger. SS07 find a blue stellar disk, with spiral structure extending out to a radius of 3.3 kpc, that seems to have formed 400 Myr ago and is embedded in a red spheroid. In Radio I, we found that the H I from the northern tidal tail is falling back and continuing to feed the outer regions of this optical disk, favoring the idea of inside-out growth. On smaller scales, we have shown in this study that there is a central disk of CO and H I of about 2.1 kpc in diameter. In addition, we find evidence for more extended H I emission further out as shown by the comparison of the absorption profiles at different resolutions.
Observations and simulations of mergers suggest that about 50% of the gas gets quickly moved to the central regions, losing its angular momentum due to cloud-cloud collisions, while the other 50% gets moved to large distances from the center, but remains bound and will eventually fall back (Hibbard & Mihos, 1995; Hibbard & van Gorkom, 1996; Barnes, 2002). In NGC 34 we see evidence for both processes, and at the present time there are comparable amounts of cold gas in the tidal tails and the center. We know the blue stellar disk formed 400 Myr ago from gas settling toward the center during the merger. The central gaseous disk presented here could have formed during the merger or more recently from fall-back material. The major axes of the gaseous disk and the blue stellar disk have almost identical position angles, indicating that the two disks either have the same formation mechanism or are dynamically linked. The current SFR in the inner 2 kpc calculated by Esquej et al. (2012) from the 24 luminosity is 42 M⊙ yr-1, which implies a consumption timescale of Myr for the molecular hydrogen presented here. This indicates that the gas in the central disk must be continuously replenished to sustain the current star formation rate.
Lastly, both sets of observations have enough velocity coverage to permit searching for a possible radio counterpart to the outflow seen optically in Na D I absorption by SS07. However, we do not find any evidence for such a counterpart in the atomic- or molecular-gas phase. We are able to place approximate upper limits on the HI mass outflow rate in both emission and absorption, and for the CO in emission.
5. Summary and Conclusions
We have presented new high-resolution HI and CO observations to study the central regions of the merger remnant NGC 34. Our main findings are as follows:
-
•
We detect a rotating CO disk of 2.1 kpc in diameter with a molecular-hydrogen mass of .
-
•
The velocity width of the CO(1–0) emitting gas matches the H I absorption width, indicating that the broad H I absorption is due to the central gas disk and is co-spatial with the CO.
-
•
The new B-array observations of the H I absorption feature allow us to calculate that there is of H I in the annular region of kpc from the center.
-
•
We do not detect a molecular- or atomic-gas outflow, but place upper limits on the mass outflow rates for H I in emission and absorption, and for CO in emission.
-
•
We have obtained new continuum images of the central source at 1.4 GHz and 113 GHz. We find that the spectrum flattens at the highest frequencies to a spectral index of . This indicates that the radio continuum at those frequencies is due to free–free emission from the central starburst.
References
- Alatalo et al. (2011) Alatalo, K., et al. 2011, ApJ, 735, 88
- Barnes (2002) Barnes, J. E. 2002, MNRAS, 333, 481
- Chini et al. (1992) Chini, R., Kruegel, E., & Steppe, H. 1992, A&A, 255, 87
- Clemens et al. (2008) Clemens, M. S., Vega, O., Bressan, A., Granato, G. L., Silva, L., & Panuzzo, P. 2008, A&A, 477, 95
- Condon (1992) Condon, J. J. 1992, ARA&A, 30, 575
- Condon et al. (1991) Condon, J. J., Huang, Z.-P., Yin, Q. F., & Thuan, T. X. 1991, ApJ, 378, 65
- Downes & Solomon (1998) Downes, D., & Solomon, P. M. 1998, ApJ, 507, 615
- Esquej et al. (2012) Esquej, P., et al. 2012, MNRAS, 423, 185
- Fernández et al. (2010) Fernández, X., van Gorkom, J. H., Schweizer, F., & Barnes, J. E. 2010, AJ, 140, 1965
- Gonçalves et al. (1999) Gonçalves, A. C., Véron-Cetty, M.-P., & Véron, P. 1999, A&AS, 135, 437
- Heckman et al. (2000) Heckman, T. M., Lehnert, M. D., Strickland, D. K., & Armus, L. 2000, ApJS, 129, 493
- Hibbard & Mihos (1995) Hibbard, J. E., & Mihos, J. C. 1995, AJ, 110, 140
- Hibbard & van Gorkom (1996) Hibbard, J. E., & van Gorkom, J. H. 1996, AJ, 111, 655
- Kandalyan (2003) Kandalyan, R. A. 2003, A&A, 398, 493
- Kruegel et al. (1990) Kruegel, E., Chini, R., & Steppe, H. 1990, A&A, 229, 17
- Lonsdale et al. (1993) Lonsdale, C. J., Smith, H. J., & Lonsdale, C. J. 1993, ApJ, 405, L9
- Murphy (2013) Murphy, E. J. 2013, ArXiv e-prints
- Prouton et al. (2004) Prouton, O. R., Bressan, A., Clemens, M., Franceschini, A., Granato, G. L., & Silva, L. 2004, A&A, 421, 115
- Rupke et al. (2002) Rupke, D. S., Veilleux, S., & Sanders, D. B. 2002, ApJ, 570, 588
- Sanders & Mirabel (1996) Sanders, D. B., & Mirabel, I. F. 1996, ARA&A, 34, 749
- Sault et al. (1995) Sault, R. J., Teuben, P. J., & Wright, M. C. H. 1995, in Astronomical Society of the Pacific Conference Series, Vol. 77, Astronomical Data Analysis Software and Systems IV, ed. R. A. Shaw, H. E. Payne, & J. J. E. Hayes, 433
- Schiminovich et al. (2013) Schiminovich, D., van Gorkom, J. H., & van der Hulst, J. M. 2013, AJ, 145, 34
- Schweizer (1998) Schweizer, F. 1998, in Galaxies: Interactions and Induced Star Formation, ed. D. Friedli, L. Martinet, & D. Pfenniger (Berlin: Springer), 105
- Schweizer & Seitzer (2007) Schweizer, F., & Seitzer, P. 2007, AJ, 133, 2132
- Soifer et al. (1987) Soifer, B. T., Sanders, D. B., Madore, B. F., Neugebauer, G., Danielson, G. E., Elias, J. H., Lonsdale, C. J., & Rice, W. L. 1987, ApJ, 320, 238
- Solomon et al. (1997) Solomon, P. M., Downes, D., Radford, S. J. E., & Barrett, J. W. 1997, ApJ, 478, 144
- Steer et al. (1984) Steer, D. G., Dewdney, P. E., & Ito, M. R. 1984, A&A, 137, 159
- Vega et al. (2008) Vega, O., Clemens, M. S., Bressan, A., Granato, G. L., Silva, L., & Panuzzo, P. 2008, A&A, 484, 631
- White & Rees (1978) White, S. D. M., & Rees, M. J. 1978, MNRAS, 183, 341