Local inhomogeneity and filamentary superconductivity in Pr-doped CaFe2As2
Abstract
We use multi-scale techniques to determine the extent of local inhomogeneity and superconductivity in Ca0.86Pr0.14Fe2As2 single crystal. The inhomogeneity is manifested as a spatial variation of praseodymium concentration, local density of states, and superconducting order parameter. We show that the high- superconductivity emerges from clover-like defects associated with Pr dopants. The highest is observed in both the tetragonal and collapsed tetragonal phases, and its filamentary nature is a consequence of non-uniform Pr distribution that develops localized, isolated superconducting regions within the crystals.
pacs:
74.70.Xa, 74.55.+v, 74.62.Dh, 68.37.MaIntroduction. – The discovery of unconventional superconductivity in Fe-based superconductors Kamihara ; chen opened a new era in superconductivity research greg . These new superconductors share several characteristics with their high- relatives based on copper (cuprates) zl . First, both are d-electron materials having layered structures with characteristic CuO2 and FeAs/FeSe planes where the superconductivity is believed to originate. Second, their parent compounds are antiferromagnetic and superconductivity arises by application of pressure or when they are doped by electrons or holes. Aside from introducing the charge carriers, the role of doping in iron-based superconductors, as well as in cuprates and heavy fermions, is still unclear, nor it is well understood how the dopants are distributed in the material. In addition, to promote superconductivity, the dopants are potential sources of inhomogeneity such as phase separation and crystalline or electronic disorder. In many models of superconductivity, it is assumed that the dopant atoms are distributed uniformly in the material. However, there are many indications for nanoscale inhomogeneity in these materials a ; b .
The issues of doping and inhomogeneity are well exemplified in Ca1-xPrxFe2As2 superconductor lv ; saha . This electron doped system can show 45 K, the highest among the pnictides with ThCr2Si2 crystal structure 122a ; 122b ; 122c . Such a high in a simple structure stimulated a huge scientific interest in this material from both, fundamental and applied point of view. Despite extensive studies, the origin of the high- superconducting state in Pr-doped CaFe2As2 and its filamentary nature are still under debate (see Refs. qi, ; lv2, ; ma, ; 6, ; wei, ).
Here we address these problems by investigating the local electronic inhomogeneous state in Pr-doped CaFe2As2. We perform extensive electronic and structural studies of single crystals of Ca0.86Pr0.14Fe2As2 superconductor (onset = 45 K) by use of macro- (magnetic susceptibility, electrical resistivity, specific heat) and micro-scale (scanning transmission electron microscopy [STEM] coupled with electron energy loss spectroscopy [EELS] and scanning tunneling microscopy [STM]) measurements. EELS results indicate that the Pr distribution is not uniform, while STM shows an electronic inhomogeneity, which is evidenced as a spatial variation of both local density of states and the superconducting order parameter. The results suggest that the highest , associated with clover-like defect, resides in the close vicinity of the Pr atoms and forms isolated superconducting regions. STM also confirms that a significant part of the sample (up to 30 %) remains in the normal state when cooled below , in agreement with bulk studies. Furthermore, we find that the high- superconductivity in Ca0.86Pr0.14Fe2As2 is observed in both tetragonal and collapsed tetragonal phases. We discuss the implications of this study on the role of disorder and its relationship with superconductivity, and give perspectives with extension to other exotic superconductors.
Methods. – Single crystals of Ca0.86Pr0.14Fe2As2 were grown out of FeAs flux with the typical size of about 21.50.2 mm3 122b . The energy-dispersive spectroscopy (EDS) analysis points to inhomogeneous distribution of Pr dopant on the micron size. Several spots on different crystals from the same batch have been used for the analysis giving a heterogenous Pr concentration ranging from 11.75 to 15.33 %. The average concentration has been established as 14 %, which is used in the paper. The magnetic susceptibility were measured using a Quantum Design MPMS-7 device. The electrical resistivity and heat capacity were measured using a four wire and relaxation methods, respectively, implemented in a Quantum Design PPMS-14 setup. The low temperature diffraction experiments were carried out using a PANalytical X’Pert PRO MPD x-ray diffractometer with Cu-Kα1 radiation. STEM and EELS were performed using a Nion UltraSTEM 200 microscope. The samples were imaged using the high angle annular dark field detector (HAADF), which selects diffracted electrons that have undergone elastic scattering in close proximity to the nuclei yielding an intensity nearly proportional to and consequent chemical information. The STM and scanning tunneling spectroscopy (STS) experiments were carried out in a home-built low temperature scanning tunneling microscope system. The samples were cleaved in ultra-high vacuum and then loaded into the STM head for investigations at low temperatures.
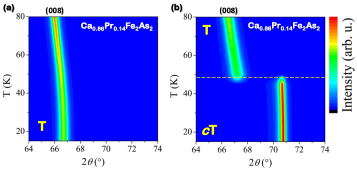
Bulk properties. – It has been reported that Ca1-xPrxFe2As2 superconductor exhibits a transformation from tetragonal () to non-magnetic collapsed tetragonal () phase at 50-70 K lv ; saha ; ma . We perform x-ray diffraction measurements and use the (008) Bragg peak, collected off the Ca0.86Pr0.14Fe2As2 single crystals at high-angle regions, as a probe of the -axis lattice parameter. Surprisingly, the majority (80 %) of our Ca0.86Pr0.14Fe2As2 samples do not show the transition (see Fig.1), and only a small fraction of our single crystals (20 %) exhibits transformation at the low temperatures. Notwithstanding the differences, the high superconducting state in Ca0.86Pr0.14Fe2As2 shows similar characteristics for the samples with or without collapsed tetragonal phase transition (see Supplemental Material in more detail sm ). Below we focus on the crystals that do not show transition, as they best represent the crystal product of the reaction batch.
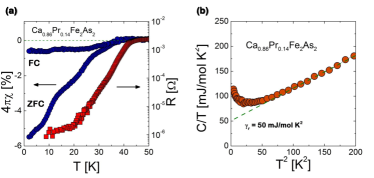
Typical low-temperature DC magnetic susceptibility and electrical resistivity of Ca0.86Pr0.14Fe2As2 single crystals are shown in Fig.2a. A diamagnetic behavior, characteristic of superconducting state, is observed in the susceptibility below 45 K together with an additional field repulsion below 20 K. However, similarly to previous reports, the magnitude of the susceptibility is very small and a maximum superconducting shielding corresponds to 5% at 2 K lv ; saha . The temperature variation of the electrical resistivity of Ca0.86Pr0.14Fe2As2 crystals is presented in Fig.2a. As seen, the resistivity shows a rapid drop at = 45 K (onset ), characteristic of superconducting state. However, the superconducting transition is broad and zero resistance may not even be observed (see Supplemental Material in more detail sm ). Figure 2b shows the low temperature dependence the specific heat presented as vs. . An upturn seen at low temperature is similar to that observed in other Fe-based superconductors and its origin is unclear greg2 ; kg . In addition, the Sommerfeld coefficient which is a measure of the density of states at the Fermi level, is as large as 50 mJ/mol K2. In general, the origin of the residual observed in superconducting materials could be caused by pair breaking effects in an unconventional superconductor, crystallographic defects and disorder, and/or spin glass behavior. However, as we show below, a relatively large value of the linear term in the specific heat of Ca0.86Pr0.14Fe2As2 is most probably associated with regions of the sample which are not superconducting.
Nano-scale properties. – All the bulk results strongly suggest that nanoscle inhomogeneity may be an important factor in Ca0.86Pr0.14Fe2As2. To explore this hypothesis and the origin of the inhomogeneous superconducting state in more detail, we have performed microscopic studies using STEM and STM measurements. Aberration-corrected STEM and EELS provide an adequate tool for probing the distribution of elements within the bulk with angstrom spatial resolution. The best geometry for analyzing the Pr distribution in Ca0.86Pr0.14Fe2As2 is a cross sectional one, in which the electron beam is parallel to the [100] axis of the crystal. In this projection, each atomic column contains only one type of atoms: Fe, As, or Ca/Pr. Ca and Pr have significantly different atomic numbers, producing different HAADF intensity. Therefore, the patchy contrast in the HAADF image of Fig.3a originates to a large extent from a variation in the number of the Pr atoms present in each Ca/Pr column, and provides a first indication for a non-uniform Pr distribution, which causes dark (Pr-poor) and bright (Pr-rich) patches. Figures 3b-f validate this hypothesis, and demonstrate the atomic resolution of EELS in this particular case. Fig 3b is another HAADF image in which the beam is now slowly scanned over a coarse grid, allowing for the acquisition of an EEL spectrum for each image pixel (spectrum image). Fig.3f shows the Ca map obtained by plotting the Ca-L integrated intensity. We notice that brighter spots in the Ca map correspond to dimmer spots in the simultaneously acquired HAADF image, and therefore to columns with high deficiency of Pr, and vice versa. This is better shown in the line profiles of Fig.3e and f, taken at the position indicated by the arrows in Fig.3b and c. The small Ca peak in Fig.3f correspond to a Ca concentration 60% of the Ca concentration in the brightest spots of Fig.3c. These variations cannot be attributed to variations in sample thickness, as shown by the thickness map in Fig.3d, acquired by using the log-ratio method for the corresponding low-loss EEL spectrum image RFE . The thickness of the sample is in fact uniform along each atomic plane in Fig.3b, with an average thickness of 0.3 electronic mean free paths. Once established atomic-scale spatial sensitivity of EELS to variations in Pr concentration, more focused spectrum images were acquired as shown in Fig.3g. In this case, the spectrum image covers a 13 u.c. 13 u.c. region within the basal plane, the same geometry used in STM experiments. The relative Pr concentration is shown in Fig.3i, which clearly displays a clustering of Pr atoms within regions of a few u.c. in size, in contrast with the quite uniform distribution for the relative Fe concentration (see Fig.3h). We note that the Pr and Fe signals in the plane view maps do not show atomic resolution. This is due in part to the coarser grid used and beam broadening effects, but also to the larger disorder associated with the (001) surface, which is observed also in STM and explains the small (3%) variation in the Fe relative concentration. Despite the signal delocalization, a simple statistic of Fig.3i reveals that, if we assume the Pr atoms are located only in the regions with intensity above the mean value (colored red to white in Fig.3i), and ignore contributions from low-intensity pixels below the 25th percentile, the biggest cluster in Fig.3i would contain 10 Pr atoms. Considering that the electron beam probes a thickness of about 8 unit cells along , a monolayer slice of the sample in the plane would show very small Pr nuclei containing only a few atoms and spaced only a few unit cells apart.
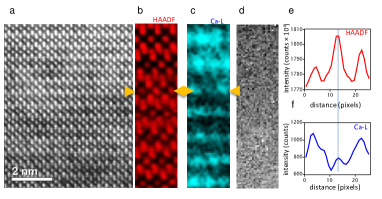
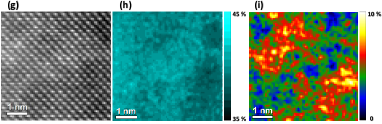
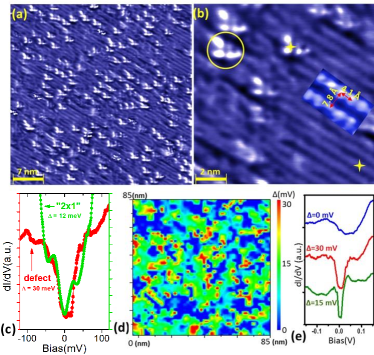
Figure 4a displays a typical topographic image taken at 4.2 K for the in situ-cleaved Ca0.86Pr0.14Fe2As2 single crystal. To visualize the defects, we flatten the STM image by compressing the overall roughness of these bright spots in order to enhance the atomic contrast of these dopants. As shown in this large scale image (42 nm42 nm), the majority of the sample surface is covered by the so-called 21 stripes. As the in-plane lattice constant is 3.98 Å, a high resolution image of two stripes, inset of Fig.4b, reveals a 21 (7.8 Å4.1 Å) structure. Such 21 striped network has been reported frequently on the surface of various 122 Fe-based superconductors, resulting from a half layer of Ba/Sr/Ca after cleaving (see Refs.1, ; 2, ; 3, ; 4, ; 5, ). Furthermore, clover-like defects, around 1-2 nm in size, are found disrupting the 21 striped structure. Figure 4b shows that each defects consist of four atomic features attached with three bright tails. Under different bias, the defects turn into bright spots (see Supplemental Material in more detail sm ), similar to the observations of Zeljkovic et al. 6 , where such defects are identified to be Pr-dopants. Interestingly, a similar clover-like structure has been recently observed in doped Bi2Se3 topological insulator STM1 ; STM2 . In the surrounding area of these defects, the surface lattice becomes highly disordered in comparison to the unperturbed 21 stripe structure. Such ”disordered” region merges smoothly into the 21 structure, and is likely a reconstruction of the Ca layer 6 .
Point tunneling spectra taken at 4.2 K on ordered 21 regions (see lower star in Fig.4b) demonstrates a clear superconducting gap (green curve in Fig.4c). The STS curves can be fit to the Dynes function 8 using a gap value of 12 meV, yielding the ratio 2/k 6.3. This is consistent with reported values for other 122 Fe-based superconductors 9 ; 10 and it is also expected for a moderate-coupling BCS superconductor. However, such a gap structure varies spatially; the STS curves measured on the clover-like defect (see upper star in Fig.4b) show a gap size as large as 30 meV with no prominent coherence peaks (red curve in Fig.4c). To further investigate the gap distribution we took a differential tunneling conductance spectra ( versus ) survey on a large surface area, using the previously explored method 11 ; 12 ; 13 (see Fig.4d). Fig.4e shows three representative tunneling spectra for superconducting (red and green curves) and normal state (blue curve) regions. The gap map demonstrates a distinct nanoscale phase separation between superconducting and non-superconducting regions. Over 2/3 area (green color) has a gap around 15 meV, while 1/3 of the material is in normal state at 4.2 K. The superconducting regions are connected to each other, therefore the presence of the percolating superconducting path and zero resistance is most probably determined by the green regions in Fig.4d. Interestingly, a localized regions of strong superconductivity are observed with a gap as large as 30 meV (see red areas in Fig.4d). The = 30 meV gap of the red regions in Fig.4d matches the gap value obtained on the clover-like defect (see red curve in Fig.4c). Therefore, these defects that are associated with praseodymium dopants create regions of strong localized superconductivity in this material. Gap inhomogeneity exists in most doped superconductors, including Fe-based materials, however, the majority of the materials are bulk superconductors, showing only nanoscale variation of the gap (see Refs. CUP1, ; CUP2, ; co1, ; 13, ; 6, ; co3, ; co4, ). The appearance of a non-superconductive phase and related phase separation explains the filamentary nature of the superconductivity in this material and is in agreement with the bulk measurements. The STM and STEM/EELS data, together with previous studies on this material 6 indicate that the clover-like defects observed in the topographic image can be identified with Pr dopants, and mark the site of localized regions of strong high- superconductivity. Furthermore, the size of the large-gap red regions in Fig.4d is very similar to the size of the red/yellow clusters in Fig.3i, indicating that the Pr clusters are indeed very small, composed of 3 or 4 atoms, and separated from other clusters by a few unit cells.
Summary and outlook. – In summary, we have investigated the effects of electronic inhomogeneity and filamentary superconductivity in Ca0.86Pr0.14Fe2As2. We use an extensive macro- and micro-probe measurements and show that the inhomogeneity is manifested as a spacial variation of both, local density of states, and the superconducting order parameter. Our analysis shows that the inhomogeneous and strongly localized high- superconducting state emerges from clover-like defects, and is a consequence of a Pr distribution which is non uniform although on a very small scale. In addition, a significant part of the sample remains in normal state at 4.2 K, in agreement with the bulk studies. Interestingly, the presence of the high- superconductivity in Ca0.86Pr0.14Fe2As2 is observed in both, tetragonal and collapsed tetragonal phases. It has been shown recently that the electronic structure is strongly reconstructed below the transition in CaFe2As2, leading to disappearance of the hole pocket and magnetism at the center of the Brillouin zone kg2 ; ty . If similar situation is observed in Pr-doped CaFe2As2, this would warrant a question on the nature of superconductivity and the role of interband spin fluctuation pairing mechanism in this material, and in other unconventional superconductors.
Acknowledgements.
This work was supported by the Department of Energy, Basic Energy Sciences, Materials Sciences and Engineering Division.References
- (1) Y. Kamihara, T. Watanabe, M. Hirano, and H. Hosono, J. Am. Chem. Soc. 130, 3296 (2008).
- (2) X. H. Chen, T. Wu, G. Wu, R. H. Liu, H. Chen, and D. F. Fang, Nature 453, 761 (2008).
- (3) G. R. Stewart, Rev. Mod. Phys. 83, 1589 (2011).
- (4) Z. Tesanovic, Physics 2, 60 (2009).
- (5) W. D. Wise et al., Nature Physics 5, 213 (2009).
- (6) M. P. Allan et al., Nature Physics 9, 220 (2013).
- (7) B. Lv, L. Deng, M. Gooch, F. Wei, Y. Sun, J. K. Meen, Yu-Yi Xue, B. Lorentz, and Ching-Wu Chu, PNAS 108, 15705 (2011).
- (8) S. R. Saha, N. P. Butch, T. Drye, J. Magill, S. Ziemak, K. Kirshenbaum, P. Y. Zavalij, J. W. Lynn, and J. Paglione, Phys. Rev. B 85, 024525 (2012).
- (9) M. Rotter, M. Tegel, and D. Johrendt, Phys. Rev. Lett. 101, 107006 (2008).
- (10) A. S. Sefat, R. Jin, M. A. McGuire, B. C. Sales, D. J. Singh, and D. Mandrus, Phys. Rev. Lett. 101, 117004 (2008).
- (11) A. Leithe-Jasper, W. Schnelle, C. Geibel, and H. Rosner, Phys. Rev. Lett. 101, 207004 (2008).
- (12) F. Y. Wei, B. Lv, L. Z. Deng, J. K. Meen, Y. Y. Xue, J. E. Hoffman, and C. W. Chu, arXiv:1309.0034
- (13) B. Lv, F. Y. Wei, L. Z. Deng, Y. Y. Xue, and C. W. Chu, arXiv:1308.3129
- (14) Long Ma, G. F. Ji, J. Dai, S. R. Saha, J. Paglione, and Weiqiang Yu, Chin. Phys. B 22, 057401 (2013).
- (15) I. Zeljkovic, D. Huang, Can-Li Song, B. Lv, Ching-Wu Chu, and J. E. Hoffman, Phys. Rev. B 87, 201108(R) (2013).
- (16) Y. Qi, Z. Gao, L. Wang, D. Wang, X. Zhang, C. Yao, C. Wang, Ch. Wang, and Y. Ma, Supercond. Sci. Technol. 25, 045007 (2012).
- (17) see Supplemental Material
- (18) J. S. Kim, E. G. Kim, and G. R. Stewart, J. Phys.: Condens. Matter 21, 252201 (2009).
- (19) K. Gofryk, A. B. Vorontsov, I. Vekhter, A. S. Sefat, T. Imai, E. D. Bauer, J. D. Thompson, and F. Ronning, Phys. Rev. B 83, 064513 (2011).
- (20) R. F. Egerton, Electron Energy-Loss Spectroscopy in the Electron Microscope.Second Edition, Plenum Press, New York and London (1996)
- (21) M. C. Boyer, Kamalesh Chatterjee, W. D. Wise, G. F. Chen, J. L. Luo, N. L. Wang, E. W. Hudson, arXiv:0806.4400
- (22) Yi Yin, M. Zech, T. L. Williams, X. F. Wang, G. Wu, X. H. Chen, and J. E. Hoffman, Phys. Rev. Lett. 102, 097002 (2009).
- (23) D. Hsieh, Y. Xia, L. Wray, D. Qian, K. Gomes, A. Yazdani, G.F. Chen, J.L. Luo, N.L. Wang, and M.Z. Hasan, arXiv:0812.2289
- (24) Hui Zhang, Jun Dai, Yujing Zhang, Danru Qu, Huiwen Ji, G. Wu, X. F. Wang, X. H. Chen, Bing Wang, Changgan Zeng, Jinlong Yang, and J. G. Hou, Phys. Rev. B 81 104520 (2010).
- (25) F. Massee, S. de Jong, Y. Huang, J. Kaas, E. van Heumen, J. Goedkoop, and M. Golden, Phys. Rev. B 80, 140507 (2009).
- (26) S. Urazhdin, D. Bilc, S. H. Tessmer, S. D. Mahanti, T. Kyratsi, and M. G. Kanatzidis , Phys. Rev. B 66, 161306(R) (2002).
- (27) Chris Mann, Damien West, Ireneusz Miotkowski, Yong P. Chen, Shengbai Zhang, and Chih-Kang Shih, Nature Comm. 4, 1 (2013).
- (28) R. C. Dynes, V. Narayanamurti, and J. P. Garno, Phys. Rev. Lett. 41, 1509(1978).
- (29) F. Massee, Y. K. Huang, J. Kaas, E. van Heumen, S. de Jong, R. Huisman, H. Luigjes, J. B. Goedkoop, and M. S. Golden, Europhys. Lett. 92, 57012 (2010).
- (30) M. L. Teague, G. K. Drayna, G. P. Lockhart, P. Cheng, B. Shen, H.-H. Wen, and N.-C. Yeh, Phys. Rev. Lett. 106, 087004 (2011).
- (31) R. Jin et al., Supercond. Sci. Technol. 23, 054005 (2010).
- (32) T. Kato, Y. Mizuguchi, H. Nakamura, T. Machida, H. Sakata, and Y. Takano, Phys. Rev. B 80, 180507 (2009).
- (33) J. E. Mitchell, B. Saparov, W. Lin, S. Calder, Q. Li, S. V. Kalinin, M. Pan, A. D. Christianson, and A. S. Sefat, Phys. Rev. B 86, 174511 (2012).
- (34) K. M. Lung et al., Nature 415, 412 (2002).
- (35) K. K. Gomez et al., Nature 447, 569 (2007).
- (36) J. E. Hoffman, Rep. Prog. Phys. 74, 124513 (2011).
- (37) F. Massee, Y. Huang, R. Huisman, S. de Jong, J. B. Goedkoop, and M. S. Golden et al., Phys. Rev. B 79, 220517(R) (2009).
- (38) Huang Yao-Bo, Richard Pierre, Wang Ji-Hui, Wang Xiao-Ping, Shi Xun, Xu Nan, Wu Zheng, Li Ang, Yin Jia-Xin, Qian Tian, Lv Bing, Chu Ching-Wu, Pan Shu-Heng, Shi Ming, and Ding Hong, Chin. Phys. Lett 30, 017402 (2013).
- (39) K. Gofryk, B. Saparov, T. Durakiewicz, M. J. Graf, and A. S. Sefat, unpublished
- (40) T. Yildirim, Phys. Rev. Lett. 102, 037003 (2009).