Exocomets in the circumstellar gas disk of HD 172555
The source HD172555 is a young A7V star surrounded by a debris disk with a gaseous component. Here, we present the detection of variable absorption features detected simultaneously in the Ca II K and H doublet lines (at 3,933Å and 3,968Å). We identified the presence of these absorption signatures at four different epochs in the 129 HARPS high-resolution spectra gathered between 2004 and 2011. These transient absorption features are most likely due to Falling Evaporating Bodies (FEBs, or exocomets) that produce absorbing gas observed transiting in front of the central star. We also detect a stable Ca II absorption component at the star’s radial velocity. With no corresponding detection in the Na I line, the resulting very low upper limit for the Na I/Ca II ratio suggests that this absorption is due to circumstellar gas.
Key Words.:
Stars: planetary systems - Stars: individual: HD 1725551 Introduction
The source HD172555 is an A7V-type star in the Pictoris moving group and harbors a dusty and gaseous circumstellar (CS) disk (Cote 1987; Lisse et al. 2009; Riviere-Marichalar et al. 2012). Lisse et al. (2009) and Johnson et al. (2012) have proposed that the dust was recently produced by a catastrophic collision between planetary mass bodies, which would have happened at around 5 au from the star. This scenario is consistent with the mid-infrared interferometric observations of the spatial distribution of dust detected at distances larger than 1 au from the central star (Smith et al. 2012). Up to now, the search for massive planets in the system have yielded only negative results (Quanz et al. 2011). The most striking recent discovery in this young circumstellar disk is the detection of [OI] emission at 63.2 m (Riviere-Marichalar et al. 2012), which shows that most of the mass of the disk must be in the gaseous phase. These works suggest that the combination of a dust debris disk with a gaseous circumstellar disk surrounding an A-type star a dozen million years old makes the HD172555 system much resembling Pictoris.
The gaseous component of the Pic disk was detected in Ca II (Hobbs et al. 1985); it presents an anomalously low Na I/Ca II ratio with a column density ratio 0.03 and an equivalent width ratio 0.1 (Vidal-Madjar et al. 1986). Furthermore, surveys of the Pic spectrum revealed the presence of variable and random additional absorptions, most often redshifted in the Ca II lines (Ferlet et al. 1987). These features are well interpreted in terms of Falling Evaporating Bodies (herafter FEBs, see review in Vidal-Madjar et al. 1998) or, in other words, exocomets.
With the Pic analogy in mind, we searched for CS gas and for any possible variable spectral signatures in the 129 spectra of HD172555 collected from 2004 to 2011 using the HARPS spectrograph. We present the analysis of this data set in Sect. 2. A stable absorption component is detected in the Ca II doublet at the radial velocity of the star and is most likely of circumstellar origin (Sect. 3.1). We also present the detection of sporadic absorptions with typical characteristics of FEBs (Sect. 3.2). The results are discussed in Sect. 4.
2 Data analysis
The spectra were obtained from 2004 to 2011 with the HARPS spectrograph (R115,000) installed at the La Silla 3.6m telescope (Table 2). We focused our attention on the Ca II stellar lines which are the most sensitive to the transit of gaseous clouds like the ones produced by exocomets in Pic. To ensure that any detected variation is of astrophysical origin and not due to variations in the wavelength or in the flux calibrations over the years, we compared the spectra in the region of the very steep Na I interstellar lines; this check confirms the tremendous stability of the instrument during the observation campaign (as expected for this spectrograph aimed at detecting minute variations in the star’s radial velocities), and thus provides very high confidence to the reality of the detected spectral evolutions (see below).
From the 129 HARPS spectra, we calculated the reference spectrum () of HD172555. It is used to search for variable absorption features and is obtained as follows. First, we assume that in the absence of variable absorption features the noise in the flux measurement is Gaussian, fluctuating around the real reference spectrum. We checked that its is proportional to with a wavelength independent factor, for which we obtained a reliable estimation in FEB-free regions. Second, at each wavelength bin, the number N of flux measurements is equal to the total number of spectra. Since we assumed that follows a Gaussian distribution, the highest flux value is an estimator of the level at which probability is equal to . By simple subtraction of from the value we thus obtain an estimation of the reference spectrum. The final reference spectrum is the mean of all these estimations obtained by varying from 3 to 10.
| Line | Rad. Vel. | Equivalent Width | Na I/Ca II Ratio | |||
| Origin | (km s-1) | (mÅ) | (Log10(D2/K) ) | |||
| Ca II K | Ca II H | Na I D2 | Na I D1 | |||
| IS | -19 | 0.87 0.08 | 0.33 0.05 | 1.02 0.05 | 0.58 0.04 | 0.07 0.10 |
| CS | 2 | 8.33 0.17 | 4.66 0.12 | 0.31 (5-) | 0.31 (5-) | -1.4 |
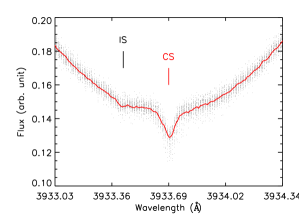
In the case of Pic, this method has proved to be extremely robust for calculating the reference spectrum despite the presence of a large number of FEB absorptions in most of the spectra (Kiefer et al. 2014, in preparation). The resulting reference spectrum for HD172555 is plotted in Fig. 1, where it is compared to the whole set of flux data points.
3 Results
3.1 The stable gaseous component
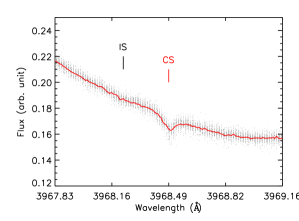
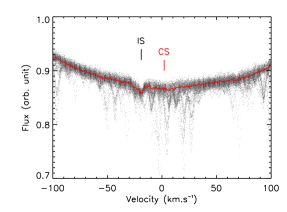
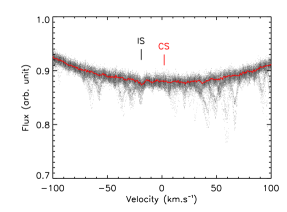
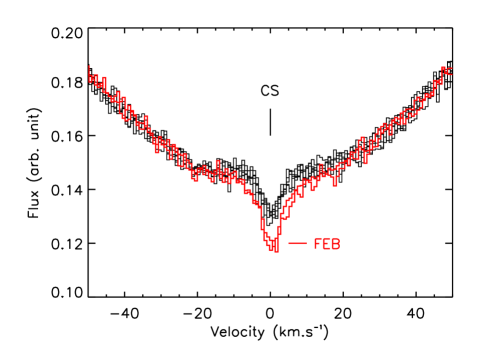
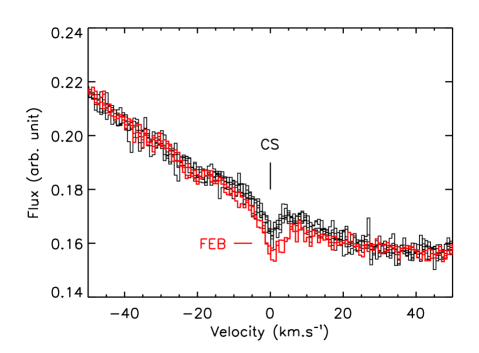
A first absorbing component in the Ca II appears at blueshifted velocities (-19 km s-1); it is also clearly detected in the Na I D2 and D1 lines (Table 1). A second feature is seen in the Ca II domain; this is the strongest feature in the spectrum of HD172555. It is located at the star radial velocity (2 km s-1); no feature is detected at the corresponding wavelengths in the Na I domain (Fig. 2).
The first feature at -19 km s-1 presents an equivalent width ratio 1 which is typical of the local interstellar medium (Welsh et al. 2010). In the line of sight of HD172555 (l=330.6°; b=-23.8°), an absorption by the G cloud of the local interstellar medium is expected at -17 km s-1 (Lallement & Bertin 1992; Redfield & Linsky 2008). We thus conclude that this stable component is most likely due to the G cloud in the interstellar medium.
On the contrary, the second feature is (i) seen at the stellar radial velocity, (ii) the strongest absorption in the Ca II lines, and (iii) not seen in Na I. This non-detection yields a 5- upper limit for the equivalent widths ratio of 0.04. This upper limit is much lower than typical values seen in the local interstellar medium where it is usually greater than 0.1 (see, e.g., Welsh et al. 2010). Keeping in mind that the Na I/Ca II ratio for the Pic CS gas disk is also anomalously low compared to IS standard, we conclude that the absorption detected in Ca II at the star’s radial velocity is most likely related to the CS gas of the HD172555 disk.
3.2 Falling Evaporating Bodies
A quick look at the HARPS HD172555 spectra immediately reveals the presence of variations in the CS Ca II line seen at the star radial velocity and identified as due to CS gas (Sect. 3.1). These variations are seen at four different epochs over a total of 22 nights of observations (Table 2). They always show up as additional absorptions over the main CS absorption, and their detection in both the Ca II-K and Ca II-H lines confirms that they are true additional absorptions to the quiet spectrum (Fig. 3).
| Year | Date | Nb of | Comment | Minimum | |
| (MJD) | (D/M/Y) | spectra | duration | ||
| 2004 | 53147 | 6 | |||
| 53156 | 3 | ||||
| 53270 | 22/09/04 | 6 | FEB | 3.5 h | |
| 2005 | 53603 | 21/08/05 | 2 | FEB | 3 min |
| 2006 | 53875 | 2 | |||
| 53880 | 2 | ||||
| 53881 | 4 | ||||
| 53989 | 2 | ||||
| 2009 | 54942 | 15 | |||
| 54943 | 10 | ||||
| 55032 | 1 | ||||
| 55035 | 1 | ||||
| 55148 | 2 | ||||
| 2010 | 55384 | 2 | |||
| 55385 | 08/07/10 | 2 | FEB | 3 min | |
| 2011 | 55723 | 11/06/11 | 31 | FEB | 1.9 h |
| 55724 | 2 | ||||
| 55725 | 2 | ||||
| 55726 | 4 | ||||
| 55763 | 2 | ||||
| 55764 | 2 | ||||
| 55765 | 26 | ||||
These variations have time scales that are probably shorter than one day since, as can be seen in Table 2, their occurrence is quite rare and at least one event, on 11 June 2011, is not observed the next day; a similar example also occurred on the 8 July 2010, but was not seen the night before. With such a low occurrence rate, detecting an event that lasted several days just before it disappears or appears would be very fortuitous.
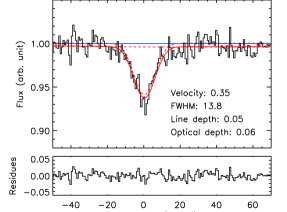
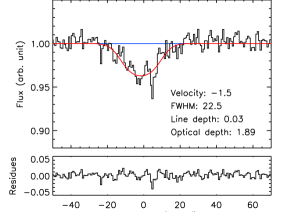
These variations thus share many common characteristics with those typically detected in Pic spectra and identified as transits of exocomets (or FEBs). To quantify the characteristics of these FEBs features, we normalized the Ca II spectra by dividing the observed spectra by the reference spectrum. Then the absorption features are fitted by a toy-model of the absorbing gaseous cloud given by
where is the fraction of the stellar surface covered by the cloud with an area (=/1). The optical depth at the wavelength is given by
where the absorption depth depends on the absorbing medium density and thickness, and the line oscillator strength. Because the oscillator strength of the Ca II K line is twice that of the Ca II H line, the absorption depths in these lines follow the relationship .
| Date | K line Depth | Velocity | FWHM | Surface Ratio | Optical depth | |
|---|---|---|---|---|---|---|
| (MJD) | (D/M/Y) | (km/s) | (km/s) | |||
| 53269.996 | 22/09/04 | |||||
| 53270.134 | 22/09/04 | |||||
| 53603.145 | 21/08/05 | |||||
| 55385.285 | 08/07/10 | |||||
| 55723.248 | 11/06/11 | |||||
| 55723.280 | 11/06/11 | |||||
| 55723.309 | 11/06/11 | |||||
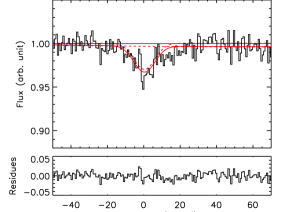
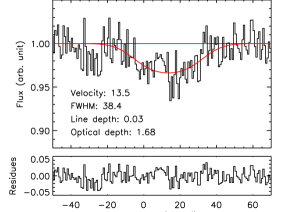
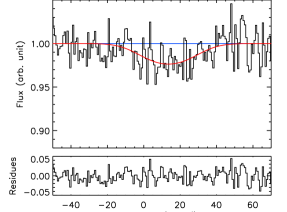
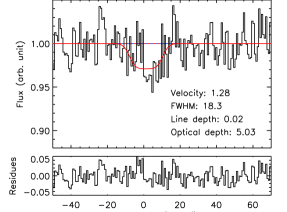
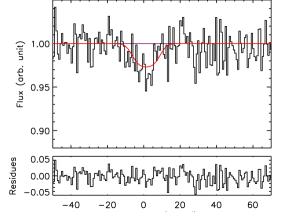
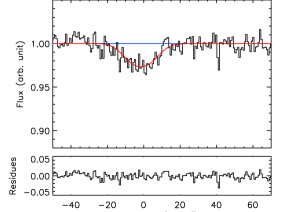
The normalized spectra of the four epochs with positive detection of FEBs are plotted in Figs. 4-7. To increase the signal-to-noise ratio, we averaged the spectra taken over 30 minute-time intervals. The results of the fits are given in Table 3.
The FEBs are mostly seen at the star radial velocity, except for the FEB on 21 August 2005 with a redshifted velocity of 13 km s-1 (Fig. 5). The most significant events on 22 September 2004 and 11 June 2011 have very different cloud characteristics, as often observed in Pic (Lagrange et al. 1992). On 22 September 2004 the absorption in the Ca II-K line is about two times deeper than in the Ca II-H line (Fig. 4), in agreement with the ratio of the lines’ oscillator strengths. This is easily explained if the features are produced by large translucent clouds covering the whole surface of the star during the transit. On 11 June 2011 the absorption in the Ca II-H line is almost as deep as in the K line (Fig. 7); this can be explained only if it is produced by an optically thick cloud, covering only a fraction of the star surface (0.041). The ratio of the lines can be equal to one if they are produced by optically thick clouds (see discussion in Lecavelier des Etangs et al. 1997).
Although the two events on 21 August 2005 and 08 July 2010 are noisy, their detection remains statistically significant, thanks to the simultaneous presence of the absorption both in the Ca II-K and Ca II-H lines. For comparison, the very nice signal detected on 11 June 2011 was actually obtained by averaging around 10 spectra similar to the ones seen on 21 August 2005 and 08 July 2010. Because of the noise, our line-finder procedure detected only one statistically significant FEB on 21 August 2005 (Fig. 5); however, the plot suggests the possibility of two absorbing components: one at about the star’s radial velocity and another at 20 km/s. This would explain the particularly large FWHM found by fitting the line with a single component (Table 3).
Table 3 also shows that the small thick clouds are found together with large FWHM. In the framework of the FEB scenario, this is interpreted by clouds transiting at very short distances to the star (a few stellar radii) for which large orbital velocity dispersion within the FEB coma yields large Doppler broadening of the lines. Meanwhile, high radiation pressure compressed the extension of the exocomets’ coma into very small size (Beust et al. 1991, 1996). These similarities with the Pic FEBs strengthen the conclusion that we are witnessing the transits of exocomets in the young circumstellar disk of HD172555, like in Pic.
4 Discussion
Considering that HD172555 and Pic have similar ages and spectral types, and that both stars are surrounded by gaseous and dusty circumstellar disks, the detection of (i) an absorption with an anomalously low Na I/Ca II ratio at the star radial velocity, and (ii) four events of variable absorptions in the Ca II line, it is very likely that we are witnessing in HD172555 a similar phenomenon to the one in Pic explained by the transit of comet-like evaporating bodies.
Although the statistics is still poor for HD172555, we can already note a difference in Doppler velocities between the Pic and HD172555 FEBs. While in Pic most of the FEB signatures appear to be redshifted up to a few hundreds of km/s (see review in Vidal-Madjar et al. 1998), the FEBs of HD172555 show up nearly at the star’s radial velocity within 10 km s-1. Importantly, this is not in contradiction with the exocomet (FEB) scenario, where the velocities of the sporadic absorptions are defined by the projection on the line of sight of the comet’s orbital velocity. Thus, redshifted and blueshifted absorptions correspond to FEBs transiting before and after the periastron, respectively. In HD172555, the FEBs at low radial velocity must be transiting near their periastron (see Beust et al. 1991 for the simulation of this configuration).
The detection of exocomets’ transits raised the issue of the inclination of the planetary system relative to the line of sight. Beust & Valiron (2007) have shown that most FEBs would remain spectroscopically undetected if the Pic disk was inclined by more that a few tens of degrees. This also applies to HD172555 if the dynamical origin of the FEBs is the same. Thus, the present detection of both the FEBs and the stable Ca II absorption argues that as Pic the HD172555 debris disk is probably close to edge-on. This remains consistent with the recent IR data constraining its inclination to be I47∘ (Smith et al. 2012) and with the large value 116 km s-1 of this A7V star.
The spectroscopic detection of transiting exocomets has already been made in a few cases other than Pic, for HR 10 (Lagrange et al. 1990), and for HD 21620, HD 42111, HD 110411, and HD 145964 (Welsh & Montgomery 2013). Here for the first time, we have presented the detection of a CS absorption feature associated with variable features detected simultaneously in the two Ca II lines, which ensure the veracity of their detection.
Now further monitoring of HD172555 is needed to obtain additionnal data and to constrain characteristics of these exocomets orbiting within a young planetary system. In analogy with Pic, observations of signatures of these exocomets in other spectral lines at different wavelengths can be anticipated with future observations.
Acknowledgements.
This work has been supported by an award from the Fondation Simone et Cino Del Duca. The authors also acknowledge the support of the French Agence Nationale de la Recherche (ANR), under programs ANR-12-BS05-0012 Exo-Atmos and ANR-2010 BLAN-0505-01 (EXOZODI).References
- (1) Beust, H., Vidal-Madjar, A., Ferlet, R., & Lagrange-Henri, A. M. 1991, A&A, 241, 488 reproduced numerically
- (2) Beust, H., Lagrange, A.-M., Plazy, F., & Mouillet, D. 1996, A&A, 310, 181
- (3) Beust, H., & Valiron, P. 2007, A&A, 466, 201 Falling Evaporating Bodies
- (4) Cote, J. 1987, A&A, 181, 77
- (5) Ferlet, R., Vidal-Madjar, A., & Hobbs, L. M. 1987, A&A, 185, 267
- (6) Johnson, B. C., Lisse, C. M., Chen, C. H., et al. 2012, ApJ, 761, 45
- (7) Lagrange-Henri, A. M., Beust, H., Ferlet, R., Vidal-Madjar, A., & Hobbs, L. M. 1990, A&A, 227, L13
- Lagrange-Henri et al. (1992) Lagrange-Henri, A. M., Gosset, E., Beust, H., Ferlet, R., & Vidal-Madjar, A. 1992, A&A, 264, 637
- (9) Lallement, R., & Bertin, P. 1992, A&A, 266, 479
- (10) Lecavelier des Etangs, A., Deleuil, M., Vidal-Madjar, A., et al. 1997, A&A, 325, 228
- (11) Lisse, C. M., Chen, C. H., Wyatt, M. C., et al. 2009, ApJ, 701, 2019
- (12) Quanz, S. P., Kenworthy, M. A., Meyer, M. R., Girard, J. H. V., & Kasper, M. 2011, ApJ, 736, L32
- Redfield & Linsky (2008) Redfield, S., & Linsky, J. L. 2008, ApJ, 673, 283
- (14) Riviere-Marichalar, P., Barrado, D., Augereau, J.-C., et al. 2012, A&A, 546, L8
- (15) Smith, R., Wyatt, M. C., & Haniff, C. A. 2012, MNRAS, 422, 2560
- (16) Vidal-Madjar, A., Ferlet, R., Hobbs, L. M., Gry, C., & Albert, C. E. 1986, A&A, 167, 325
- (17) Vidal-Madjar, A., Lecavelier des Etangs, A., & Ferlet, R. 1998, Planet. Space Sci., 46, 629
- (18) Welsh, B. Y., Lallement, R., Vergely, J.-L., & Raimond, S. 2010, A&A, 510, A54
- (19) Welsh, B. Y., & Montgomery, S. 2013, PASP, 125, 759