The polluted atmospheres of cool white dwarfs and the magnetic field connection††thanks: Based on observations collected at the European Organisation for Astronomical Research in the Southern Hemisphere, Chile under programmes ID 082.D-0750 and 091.D-0267.
Abstract
We present an analysis of X-Shooter spectra of the polluted hydrogen-rich white dwarfs (DAZ) NLTT 888 and NLTT 53908. The spectra of NLTT 53908 show strong, Zeeman-split calcium lines (Ca ii H&K and Ca i 4226) and the star appears to be a close relative of the polluted magnetic white dwarf (DAZH) NLTT 10480, while the spectra of NLTT 888 show narrow lines of calcium and iron. A comparison of the DAZ NLTT 888 and the DAZH NLTT 53908 with other class members illustrates the diversity of environment and formation circumstances surrounding these objects. In particular, we find that the incidence of magnetism in old, polluted white dwarfs significantly exceeds that found in the general white dwarf population which suggests an hypothetical link between a crowded planetary system and magnetic field generation.
keywords:
white dwarfs – stars: abundances – stars: atmospheres – stars: magnetic fields – stars: individuals: NLTT 888, NLTT 53908.1 Introduction
Polluted white dwarfs provide an opportunity to investigate the ultimate fate of planetary systems. Villaver & Livio (2007) show that under the right conditions, some planets do manage to survive the asymptotic giant branch (AGB) and post-AGB phases, while Debes & Sigurdsson (2002) had already shown that these planets and asteroids could find themselves within the white dwarf tidal radius if their orbits become unstable during close encounters with each other. The formation of debris discs around white dwarfs may be a common occurrence (Jura, 2003; Kilic et al., 2006) and is most likely related to the presence of a crowded circumstellar environment in the parent star. The presence of debris material accreted onto the white dwarf surface is evident in spectroscopic observations of a large fraction of hydrogen-rich white dwarfs (Zuckerman et al., 2003).
The origin of magnetic fields in white dwarf stars may be linked to possible field-generating merger events preceding the birth of the white dwarf (Tout et al., 2008; Nordhaus et al., 2011; García-Berro et al., 2012). The likelihood of such mergers during the post-AGB phase would be directly related to the multiplicity in their respective stellar or planetary systems: Surface metallicity and magnetic field in white dwarfs may be concomitant.
Recent investigations have uncovered several cool, magnetic, polluted DA white dwarfs (Farihi et al., 2011; Kawka & Vennes, 2011; Zuckerman et al., 2011). Because the initial class identifications were secured with low-dispersion spectra, the present DAZ selection is independent of field intensity weaker than MG. The inverse problem remains to be investigated: Could some high-field white dwarfs also be polluted? An answer to that question would require detailed modeling beyond linear Zeeman effect, but spectral lines could still escape detection because of line spread.
We present an analysis of two recently identified polluted white dwarfs from the revised NLTT catalogue of Salim & Gould (2003): NLTT 888 and the magnetic white dwarf NLTT 53908. In Section 2, we present new high signal-to-noise ratio spectra of these objects. With these data, we constrain the atmospheric parameters (Section 3.1), the magnetic field strength in NLTT 53908 (Section 3.2), and we conduct an abundance analysis (Section 3.3). Finally we summarize our results in Section 4 and examine the particular case of NLTT 53908 along with the class properties of cool, magnetic DAZ white dwarfs.
2 Observations

We first observed NLTT 53908 with the ESO Faint Object Spectrograph and Camera (EFOSC2) attached to the New Technology Telescope (NTT) at La Silla Observatory on UT 21 October 2008. We used grism number 11 (300 lines/mm) with a 1 arcsecond slit-width resulting in a resolution of Å. The spectrum revealed a cool DAZ white dwarf with Ca ii H&K. Incidentally, Limoges et al. (2013) classified NLTT 53908 (PM I 222761753) as a DA white dwarf.
| Ion/a | E.W. | Ion/a | E.W. | ||
|---|---|---|---|---|---|
| (Å) | (mÅ) | (km s-1) | (Å) | (mÅ) | (km s-1) |
| Fe i 3440.735b | 144. | 18.7 | Fe i 3820.425 | 83. | 26.3 |
| Fe i 3581.195 | 133. | 9.6 | Fe i 3859.911 | 75. | 13.9 |
| Fe i 3719.935 | 134. | 19.7 | Ca ii 3933.66 | 196. | 18.0 |
| Fe i 3734.864 | 90. | 16.6 | Ca ii 3968.47 | 140. | 19.7 |
| Fe i 3737.131 | 73. | 19.2 | Fe i 4045.813 | 43. | 13.9 |
| Fe i 3748.262 | 58. | 19.8 | Fe i 4063.594 | 30. | 7.8 |
| Fe i 3749.485 | 51. | 14.8 | H i 4861.323 | … | 7.8 |
| Fe i 3758.233 | 51. | 26.9 | H i 6562.797 | … | 24.2 |
a Laboratory wavelength from the National Institute of Standards and Technology (NIST) which is accessible from http://www.nist.gov/pml/data/asd.cfm.
b Blend of Fe i 3440.606 and 3440.989 Å.
Following-up on our own classification, we obtained two sets of echelle spectra of NLTT 53908 using the X-shooter spectrograph (Vernet et al., 2011) attached to the UT2 (Kueyen) at Paranal Observatory on UT 10 July 2013 and 9 August 2013. The spectra were obtained with the slit-width set to 0.5, 0.9 and 0.6 arcseconds for the UVB, VIS, and NIR arms, respectively. This setup delivered a resolution of , 7450 and 7780 for the UVB, VIS and NIR arms, respectively. The exposure times were 2940 and 3000 s for the UVB and VIS arms, respectively. For the NIR arm we obtained five exposures of 600 s each. The observations were conducted at the parallactic angle.
| Survey/banda | eff. | Magnitude | |
|---|---|---|---|
| NLTT 888 | NLTT 53908 | ||
| GALEX NUV | 2315 Å | ||
| SDSS | 3551 Å | ||
| SDSS | 4686 Å | ||
| SDSS | 6166 Å | ||
| SDSS | 7481 Å | ||
| SDSS | 8931 Å | ||
| 2MASS | 1.235 m | ||
| 2MASS | 1.662 m | ||
| 2MASS | 2.159 m | 17.058: | |
| WISE | 3.353 m | ||
| WISE | 4.603 m | ||
We first observed NLTT 888 with FORS2 attached to the UT2. Based on these spectropolarimetric data, Kawka & Vennes (2012a) placed an upper limit of 40 kG on the longitudinal magnetic field. The blue FORS2 spectrum revealed a cool DAZ white dwarf showing Ca ii H&K absorption lines with an abundance of (Kawka & Vennes, 2012a). Consequently, we obtained a set of six X-shooter spectra on UT 4 August 2013, 2 September 2013 and 3 September 2013. The observations were conducted with the configuration and exposure times described earlier. The spectra (Fig. 1) confirmed the Ca ii line identifications and, in addition, revealed several Fe i lines. Table 1 lists all strong lines along with their respective equivalent widths and heliocentric velocities. The H core appears rounded or possibly split by the effect of a 30 kG field. The heavy element line velocities average km s-1 and are marginally consistent with the H velocity ( km s-1).
Table 2 lists available photometric measurements from the Galaxy Evolution Explorer (GALEX) sky survey, the Sloan Digital Sky Survey (SDSS), the Two Micron All Sky Survey (2MASS), and the Wide-field Infrared Survey Explorer (WISE). We describe in Section 3.1 the continuum temperature measurements using the photometric data.
3 Analysis
In our analysis of the atmospheric properties of NLTT 888 and NLTT 53908 we used a grid of hydrogen-rich model atmospheres calculated in local thermodynamic equilibrium. These models are described in Kawka & Vennes (2006) and Kawka & Vennes (2012b). We calculated masses and cooling ages using the evolutionary mass-radius relations of Benvenuto & Althaus (1999).
3.1 Atmospheric Parameters and Spectral Energy Distributions (SED)
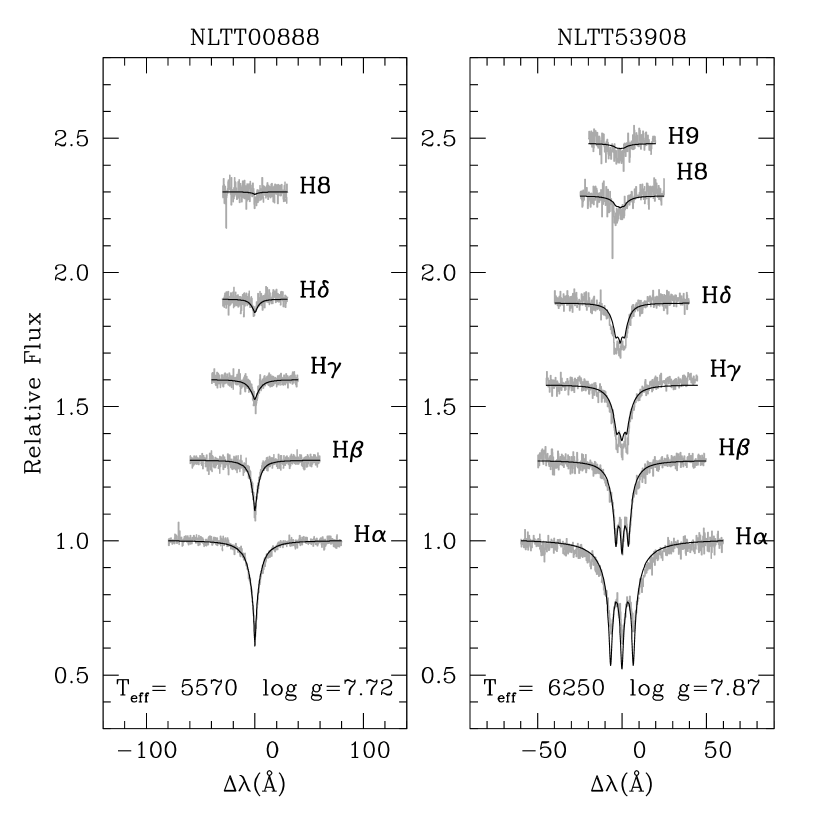
First, we determined the effective temperature and surface gravity of NLTT 888 and NLTT 53908 by fitting the observed Balmer lines with grids of synthetic spectra using minimization techniques (Fig. 2). For NLTT 888 we included H to H8, but excluded H which is dominated by Ca ii K. For NLTT 53908 we included H to H9, but again excluded H. For NLTT 53908 we also included the effect of a magnetic field on the line formation as described by Unno (1956) and Martin & Wickramasinghe (1981). However, the H core is poorly fitted: We neglected the effect of a field distribution associated with, for example, a dipolar field structure that would broaden the observed line profile. Instead, we assumed a single valued field.
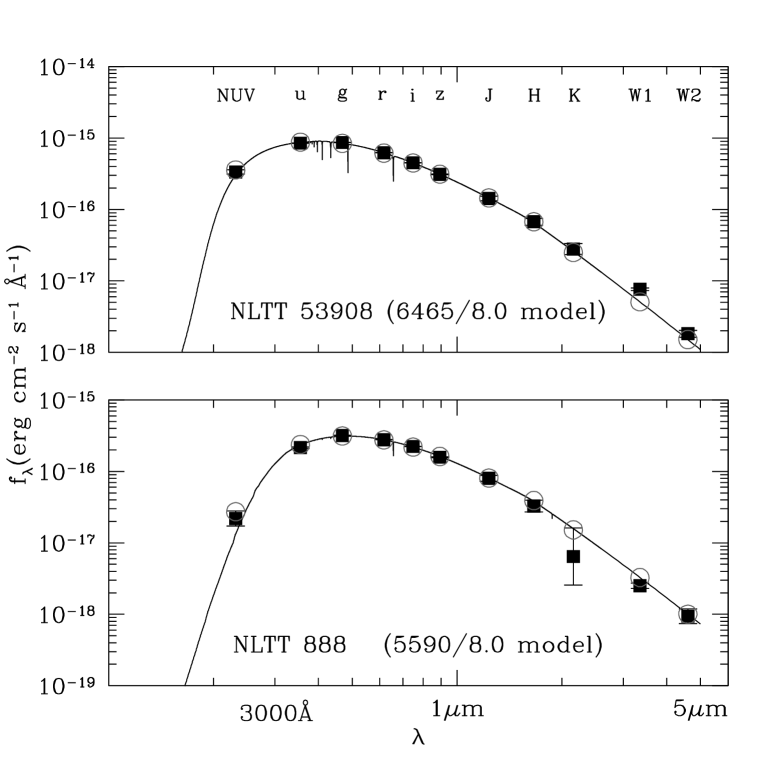
Figure 3 shows the observed and calculated SED for both objects. In the case of NLTT 888, the effective temperature determined from the Balmer line fits ( K) is consistent with the temperature determined from the SED ( K). However, for NLTT 53908, the effective temperature from the Balmer line fits ( K) is lower than the effective temperature required to match the observed SED (6465 K). Table 3 summarizes these measurements and lists additional properties derived from these measurements.
3.2 Magnetic field
We measured the strength of the average surface magnetic field in NLTT 53908 using the Zeeman split pattern of H and the calcium lines. Details of the predicted Zeeman line components are presented in Kawka & Vennes (2011). We fitted Gaussian functions to each Zeeman component of Ca i 4226 Å, Ca ii H&K, and H, and measured the line centres. Next, we simultaneously constrained the magnetic field strength and average line velocity by fitting the observed line centres with predicted positions. Using the calcium lines we determined a surface averaged magnetic field of MG with a velocity of km s-1. Using H we determined MG with a velocity of km s-1. The magnetic field measurements and velocities are consistent within uncertainties. We adopted the weighted average of these measurements MG and km s-1.
The H core in NLTT 888 shows the possible effect of broadening due to unresolved splitting by a weak field ( kG). However, a higher resolution spectrum would be required to fully resolve the Zeeman pattern and confirm the magnetic field detection.
3.3 Abundance analysis
We initiated a study of the abundance patterns in NLTT 888 and 53908 by fitting a set of model spectra with varying abundances to the X-shooter spectra. For NLTT 888 we set the effective temperature and surface gravity to that determined from the Balmer line fits. However, for NLTT 53908 we adopted K () as a compromise between the Balmer line fit and the SED analysis. For reference, we adopted the solar abundance scale described in Vennes & Kawka (2013) that was built using the compilations of Asplund et al. (2009) and Lodders et al. (2009). The measured abundances and upper limits are summarized in Table 3. The quoted uncertainties are statistical only (1), and we may add systematic errors of dex due to model uncertainties (see below). The upper limits are taken at the 90% confidence level.
The measured calcium () and iron () abundances imply that the atmosphere of NLTT 888 is iron enhanced (). Note that if we assume the abundances would be shifted up by 0.1 dex, while abundance ratios remain unaffected. The calcium abundance measured with X-shooter is in agreement with that originally determined by Kawka & Vennes (2012a) using FORS data (). We calculated magnesium and silicon abundance upper limits, but were unable to secure meaningful constraints to the aluminium abundance.
Next, we measured the abundance of calcium in the atmosphere of NLTT 53908 and calculated upper limits for the abundance of magnesium, silicon and iron. We found a significant discrepancy in the abundance of calcium based on Ca i and Ca ii lines. Using the Ca ii H&K lines we measured () compared to () using the Ca i line. A similar problem was also encountered in our analysis of the cool magnetic DAZ NLTT 10480 (Kawka & Vennes, 2011). In this case, adopting a cooler atmosphere helped restore the calcium ionization balance. However, in the case of NLTT 53908 a lower effective temperature that would restore consistency is excluded by the SED and Balmer line fits. A surface gravity shift of 0.3 dex results in abundance shift of 0.06 dex in both Ca i and Ca ii measurements, leaving the ionization ratio virtually unchanged. Also, a change in temperature of K results in abundance shifts of and using Ca i and Ca ii lines, respectively, corresponding to a change in the Ca iCa ii ionization ratio of 0.1 dex. Such small variations do not resolve the present difficulties with the calcium ionization balance. Because Ca ii is the dominant ionization species we adopted the abundance measurement based on the Ca ii lines. The calcium abundance and the upper limits offer a glimpse of the composition of NLTT 53908 and we may conclude that its atmosphere is not iron enhanced.
| Parameter | NLTT 888 | NLTT 53908 |
| (K) | ||
| (cgs) | ||
| Mass () | ||
| Distance (pc) | ||
| Age (Gyr) | ||
| (K)a | ||
| (cgs)a | (8.0) | (8.0) |
| () | ||
| () | ||
| () | 10.77(5.10)0.06 | 9.85(4.18)0.04 |
| () | 9.01(4.48)0.07 | |
| (km s-1) | ||
| (kG) |
a Based on the SED.
b [X/H] .
| WD | Name | (K) | (c.g.s) | FeCa | (kG) | (kG) | Reference | |
|---|---|---|---|---|---|---|---|---|
| WD0015055 | NLTT 00888 | 58 | 1,2 | |||||
| WD0028220 | NLTT 01675 | 8 | … | 3 | ||||
| WD0151308 | NLTT 06390 | 27 | 2,3 | |||||
| WD0243026 | LHS 1442 | … | … | 4 | ||||
| WD0245541 | G 174-14 | … | … | 4 | ||||
| WD0315293 | NLTT 10480 | 10 | 3,5 | |||||
| WD0322019 | G 77-50 | 13 | 120 | … | 6 | |||
| WD0334224 | NLTT 11393 | 7 | 2,3 | |||||
| WD1208576 | G 197-47 | … | … | 4 | ||||
| WD1344106 | G 63-54 | … | … | 4 | ||||
| WD1633433 | G 180-63 | 5 | … | 4 | ||||
| WD1653385 | NLTT 43906 | 5900 | 8.0 | 1.3 | 70 | … | 7 | |
| WD2225176 | NLTT 53908 | 13 | … | 1 |
4 Summary and Discussion
We obtained accurate calcium abundance measurements in the atmospheres of the DAZ white dwarfs NLTT 53908 and NLTT 888. Also, we measured the iron abundance in NLTT 888 and found that NLTT 53908 is a magnetic white dwarf. These two objects join a class of cool, polluted white dwarfs. Table 4 lists all DAZ white dwarfs with K. Their atmospheric parameters and abundance measurements are taken from the cited references. It is worth noting that within this sample of cool DAZ white dwarfs, the iron to calcium abundance ratio varies by a factor of from an abundance ratio close to unity (NLTT 43906) and up to 60 (NLTT 888), and assuming steady state accretion, this range of abundances suggests a remarkable diversity in the accretion source composition.
Also, Table 4 lists confirmed surface magnetic fields or upper limits based on the shape of the H core. Requiring that the components occupy separate resolution elements we have , where is the resolving power and is the magnetic line displacement. We find that kG, where is the Landé factor and is given in Å. For those stars that have been observed spectropolarimetrically we provide the longitudinal magnetic field measurement or upper limit. Out of 13 objects listed in Table 4, four are known to possess a magnetic field. Restricting the sample to temperatures below 6000 K, seven objects remain with three harbouring a magnetic field.
The incidence of magnetism in the general population of white dwarfs has been reported to be as low as % in spectropolarimetric surveys (Schmidt & Smith, 1995; Kawka & Vennes, 2012a) to possibly as high as 13-21% in the old population of nearby white dwarfs (Kawka et al., 2007). The field strengths range from a few kG (see, e.g., Landstreet et al., 2012) to several 100 MG covering five orders of magnitude. Assuming a flat distribution per field decade (Schmidt & Smith, 1995; Kawka et al., 2007), we estimate that 40% of magnetic white dwarfs have fields below 1 MG (corresponding to the largest field in our DAZ sample), i.e., 7% of the old, local population. Assuming that our DAZ sample was drawn from a similar population we find that the probability of identifying 4 magnetic white dwarfs in a sample of 13 objects is below 1%. Therefore, we can be confident at the 99% level that the population of cool DAZ white dwarfs has a higher incidence of magnetism than currently reported in the general population. For example, Bergeron et al. (1997) reported the identification of twelve magnetic white dwarfs in a survey of cool white dwarfs (4,00010,000 K) or an incidence of 11%. More specifically, eight out of 64 hydrogen-rich white dwarfs (13%) were found to be magnetic, with only two objects with a field below 1 MG. The probability that our sample of 4 magnetic objects out of 13 DAZ white dwarfs could be drawn from a population with a 3% (2/64) field incidence is below 0.1%. Important questions remain unanswered: First, having estimated the field incidence among cool, polluted white dwarfs, what would be the incidence among their warmer ( K) counterparts? Conversely, what would be the fraction of polluted white dwarfs in a high-field ( MG) sample? In the context of merger-induced magnetic fields (Tout et al., 2008; Nordhaus et al., 2011; García-Berro et al., 2012; Külebi et al., 2013; Wickramasinghe, Tout, & Ferrario, 2014), only mergers occurring on the red giant or asymptotic red giant phases generate fields. Also, diffusion models (see, e.g., Koester, 2009) imply that atmospheric pollution quickly recedes after an accretion event. A dense circumstellar environment increases the probability that these events would be observed simultaneously in a given system.
Acknowledgments
A.K. and S.V. are supported by the GAČR (P209/12/0217, 13-14581S) and the project RVO:67985815.
This publication makes use of data products from WISE, which is a joint project of the University of California, Los Angeles, and the Jet Propulsion Laboratory/California Institute of Technology, funded by the National Aeronautics and Space Administration, and from 2MASS, which is a joint project of the University of Massachusetts and the Infrared Processing and Analysis Center/California Institute of Technology, funded by the National Aeronautics and Space Administration and the National Science Foundation.
References
- Ahn et al. (2013) Ahn C. P. et al. 2013, ApJS, submitted (arXiv:1307.7735)
- Asplund et al. (2009) Asplund M., Grevesse N., Sauval A. J., Scott P. 2009, ARA&A, 47, 481
- Benvenuto & Althaus (1999) Benvenuto O. G., Althaus L. G. 1999, MNRAS, 303, 30
- Bergeron et al. (1997) Bergeron P., Ruiz M. T., Leggett S. K. 1997, ApJS, 108, 339
- Cutri et al. (2012) Cutri R. M., et al. 2012, VizieR Online Data Catalog, 2311, 0 (wise.rept, 1C)
- Debes & Sigurdsson (2002) Debes J. H., Sigurdsson S. 2002, ApJ, 572, 556
- Farihi et al. (2011) Farihi J., Dufour P., Napiwotzki R., Koester D. 2011, MNRAS, 413, 2559
- García-Berro et al. (2012) García-Berro E., et al., 2012, ApJ, 749, 25
- Jura (2003) Jura M. 2003, ApJL, 584, L91
- Kawka & Vennes (2006) Kawka A., Vennes S. 2006, ApJ, 643, 402
- Kawka & Vennes (2011) Kawka A., Vennes S. 2011, A&A, 532, A7
- Kawka & Vennes (2012b) Kawka A., Vennes S. 2012a, MNRAS, 425, 1394
- Kawka & Vennes (2012a) Kawka A., Vennes S. 2012b, A&A, 538, A13
- Kawka et al. (2007) Kawka A., Vennes S., Schmidt G. D., Wickramasinghe D. T., Koch R. 2007, ApJ, 654, 499
- Kilic et al. (2006) Kilic M., von Hippel T., Leggett S. K., Winget D. E. 2006, ApJ, 646, 474
- Koester (2009) Koester D., 2009, A&A, 498, 517
- Külebi et al. (2013) Külebi B., Ekşi K. Y., Lorén-Aguilar P., Isern J., García-Berro E. 2013, MNRAS, 431, 2778
- Landstreet et al. (2012) Landstreet J. D., Bagnulo S., Valyavin G. G., Fossati L., Jordan S., Monin D., Wade G. A. 2012, A&A, 545, A30
- Limoges et al. (2013) Limoges M.-M., Lépine S., Bergeron P. 2013, AJ, 145, 136
- Lodders et al. (2009) Lodders K., Palme H., Gail H.-P. 2009, Landolt-Börnstein, New Series, VI/4B, 560
- Martin & Wickramasinghe (1981) Martin B., Wickramasinghe D. T. 1981, MNRAS, 196, 23
- Nordhaus et al. (2011) Nordhaus J., Wellons S., Spiegel D. S., Metzger B. D., Blackman E. G. 2011, Proceedings of the National Academy of Science, 108, 3135
- Salim & Gould (2003) Salim, S., & Gould, A. 2003, ApJ, 582, 1011
- Schmidt & Smith (1995) Schmidt G. D., Smith P. S. 1995, ApJ, 448, 305
- Skrutskie et al. (2006) Skrutskie M. F., et al. 2006, AJ, 131, 1163
- Tout et al. (2008) Tout C. A., Wickramasinghe D. T., Liebert, J. Ferrario L., Pringle J. E. 2008, MNRAS, 387, 897
- Unno (1956) Unno W. 1956, PASJ, 8, 108
- Vennes & Kawka (2013) Vennes S., Kawka A., 2013, ApJ, 779, 70
- Vernet et al. (2011) Vernet J., et al., 2011, A&A, 536, A105
- Villaver & Livio (2007) Villaver E., Livio, M. 2007, ApJ, 661, 1192
- Wickramasinghe, Tout, & Ferrario (2014) Wickramasinghe D. T., Tout C. A., Ferrario L., 2014, MNRAS, 437, 675
- Zuckerman et al. (2011) Zuckerman B., Koester D., Dufour P., Melis C., Klein B., Jura M. 2011, ApJ, 739, 101
- Zuckerman et al. (2003) Zuckerman B., Koester D., Reid I.N., Hünsch M. 2003, ApJ, 596, 477